Electricity consumption transaction analysis method based on financial technical indexes

A technology of technical indicators and analysis methods, applied in the field of electricity abnormality analysis, can solve problems such as weakening the subjectivity of manual selection of features, difficulty in obtaining information that fully characterizes load changes, and difficulty in capturing abnormal changes, so as to ensure effectiveness and effectively grasp. take effect

Pending Publication Date: 2021-04-02
STATE GRID ZHEJIANG ELECTRIC POWER +3
View PDF0 Cites 1 Cited by
  • Summary
  • Abstract
  • Description
  • Claims
  • Application Information

AI Technical Summary

Problems solved by technology

Although such indicators have clear physical and explanatory meanings, feature selection is highly subjective, and it is difficult to obtain information that fully characterizes load changes.
The second category of methods mainly uses data mining methods such as clustering or neural networks to mine abnormal data. Although the subjectivity of manual feature selection is reduced, the abnormal detection results lack reasonable explanations and clear physical meanings.
In addition, it should be noted that these two types of methods are mostly limited to mining abnormalities in electricity consumption data, and it is difficult to capture abnormalities caused by enterprise production transformation, economic operation, etc.

Method used


Image

  • Electricity consumption transaction analysis method based on financial technical indexes
  • Electricity consumption transaction analysis method based on financial technical indexes
  • Electricity consumption transaction analysis method based on financial technical indexes

Examples


Embodiment Construction

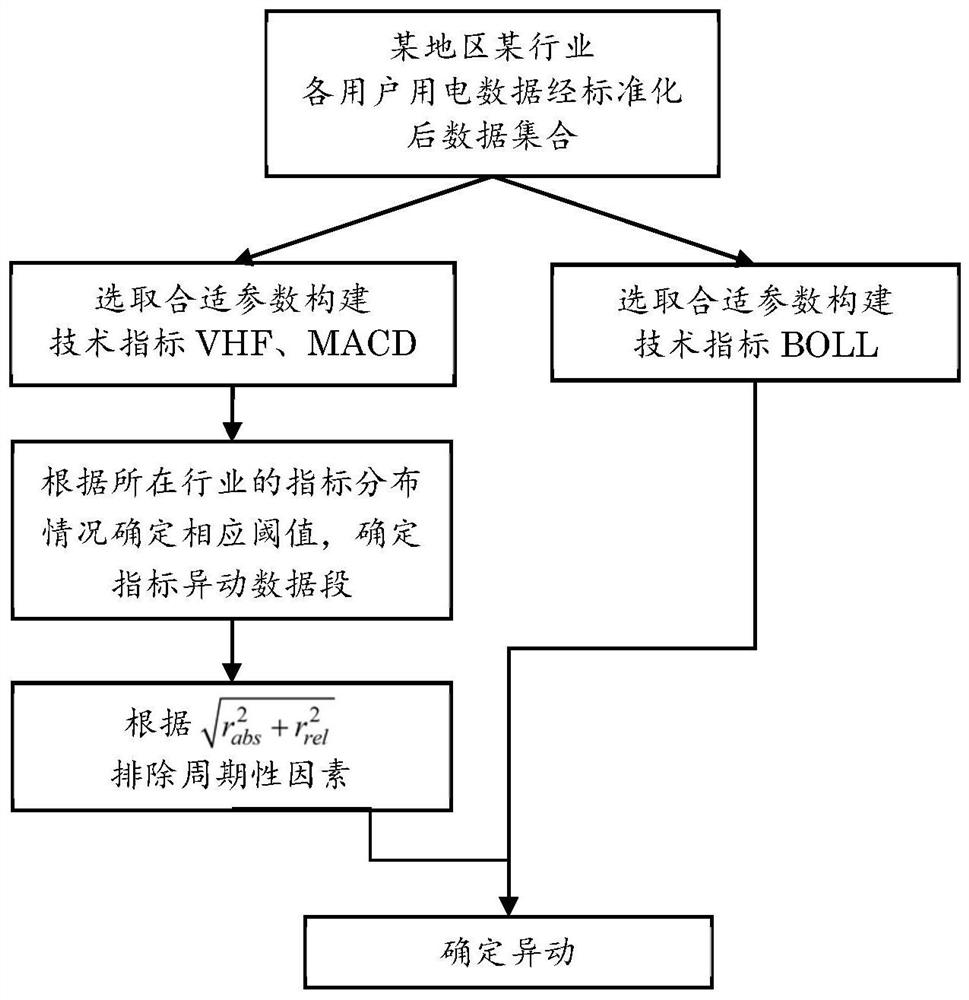
[0032] The technical solution of the present invention will be further described in detail below in conjunction with the accompanying drawings.

[0033] Such as figure 1 Shown, the present invention comprises the following steps:

[0034] S1: Obtain the power consumption data of power users, calculate the average load of each user, and perform data completion and standardization on the average load data;

[0035] S2: Based on the average load, calculate the cross filter line indicator VHF and the zero-lag moving average similarity and difference indicator ZLMACD;

[0036] Record the average load sequence P of a certain household, and calculate the technical index for P.

[0037] 1. The calculation formula of cross filter line indicator VHF is:

[0038]

[0039] where P j ,P j-1 and P k represent the average load at time j, j-1 and k, respectively, Indicates the maximum value of the average load difference for any pair of moments j and k satisfying i-n+1≤j, k≤i, and ...


PUM


Abstract

The invention discloses an electricity consumption transaction analysis method based on financial technical indexes, and relates to the field of electricity consumption transaction analysis. At present, the abnormal analysis of the power consumption data is mostly limited to mining the abnormal condition of the power consumption data, and the abnormal condition caused by enterprise production transformation, economic operation and the like is difficult to capture. Through the characteristics of an electrical load sequence are described through indexes of a cross filtering line, a zero-lag similarities and differences moving average line and a Brinell line, the index parameters are adaptively set to meet specific scenes of an abnormal change analysis task, a reasonable threshold value is set according to an index probability distribution diagram in the same industry, and the indexes exceeding the index threshold value are qualitatively determined as transaction; therefore, the load curve characteristics are effectively described, the abnormal phenomenon is effectively grabbed, and it is guaranteed that an abnormal analysis result has certain interpretability. Significant abnormal changes of the power utilization data can be accurately and effectively screened out; the detection of the power utilization mutation is captured through an auxiliary Brinell line index, thereby achieving the capturing of the abnormal movement, and further guaranteeing the effectiveness of the abnormal movement analysis.

Description

technical field [0001] The invention relates to the field of electricity consumption analysis, in particular to an electricity consumption analysis method based on financial technical indicators. Background technique [0002] The analysis of electricity consumption data has laid a necessary foundation for the operation and service optimization of my country's electric power industry. The analysis of power consumption changes can not only expose the aging faults of the power physics information collection system, but also reveal the situation of enterprises stealing electricity to a certain extent, and can evaluate the vitality of enterprise development from the perspective of electricity consumption, further adjust power supply policies, improve and increase economic benefits. At present, there are two main types of methods for the analysis of power consumption data changes. The first type of method usually sets a certain prior abnormal threshold value for the single-day lo...

Claims


Application Information

Patent Timeline
Patent Type & Authority Applications(China)
IPC IPC(8): G06F17/18G06Q10/06G06Q40/00G06Q50/06
CPCG06F17/18G06Q10/06393G06Q40/00G06Q50/06Y02P90/82
Inventor 王伟峰孙钢姚一杨程清陈政波郁春雷李帮准葛岳军
Owner STATE GRID ZHEJIANG ELECTRIC POWER
Why Eureka
Try Eureka