Method for generating contour map in real time based on monitoring data

A technology of contour map and monitoring data, which is applied in the field of value map, can solve the problems of extremely high precision and complex contour map drawing, and achieve high accuracy

Pending Publication Date: 2021-09-24
TIANJIN ENVIRONMENT MONITORING CENT
View PDF5 Cites 0 Cited by
  • Summary
  • Abstract
  • Description
  • Claims
  • Application Information

AI Technical Summary

Problems solved by technology

[0004] The drawing of the contour map is more complicated, and it needs to be combined with the actual map, and the accuracy is extremely high
Now there are a lot of software that can automatically generate contour maps, such as Surfer, Matlab, etc., but manual operation of the software is required to import data, generate and export images, etc.

Method used


Image

  • Method for generating contour map in real time based on monitoring data
  • Method for generating contour map in real time based on monitoring data
  • Method for generating contour map in real time based on monitoring data

Examples


Embodiment 1

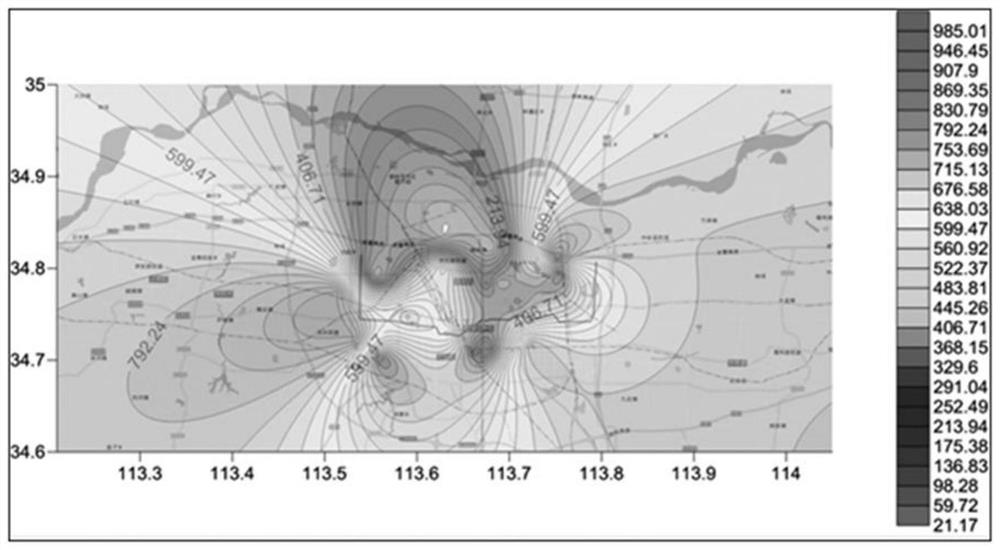
[0093] There is a set of characteristic pollutant monitoring system, with dozens of monitoring points installed in a city, which mainly detects the concentration of various pollutants in the air, including sulfur dioxide, carbon monoxide, and benzene series.

[0094] This system adopts SqlServer database, uses ASP.net platform for program development, and the background service is written by C# language.

[0095] Firstly, build a server, which is installed with a database, a web platform program and a background program for automatically generating contour maps.

[0096] Then all the monitoring point information is entered into the database, and the GPS information of each monitoring point is recorded. Configure the parameters to be collected by the data collection equipment at each monitoring point.

[0097] After the configuration is completed, the data acquisition equipment will automatically monitor the concentration of each pollutant, and regularly upload the data to the...

Embodiment 2

[0101] A temperature and humidity monitoring system in a factory workshop. Install temperature and humidity sensors at various points in a production workshop to monitor real-time temperature and humidity values ​​and display them in real time on a large screen.

[0102] This system adopts SqlServer database, uses ASP.net platform for program development, and the background service is written by C# language.

[0103] Firstly, build a server, which is installed with a database, a web platform program and a background program for automatically generating contour maps.

[0104] Enter the location information of each point into the database, and the temperature and humidity sensor will automatically upload the temperature and humidity values ​​of each point to the server for storage.

[0105] The background program on the server will regularly read the temperature and humidity data, combined with the floor plan of the workshop, generate a contour map through SurferAPI, and save i...


PUM


Abstract

The invention relates to a method for generating a contour map in real time based on monitoring data. The method comprises the following steps: acquiring monitoring data on each monitoring point site at regular time; determining a map of a monitoring area according to the distribution position of each monitoring point position, taking the map of the monitoring area as a base map of a contour map, and recording the longitude and dimension ranges of the base map; determining parameters of the contour map and data acquisition time according to the monitoring data, and generating a data file, with the format of the data file being 'longitude, latitude and numerical value'; according to the data file, calling a Kriging interpolation algorithm in a SurferAPI, and determining a grid file of the contour map; determining a level file used by the SurferAPI according to the data file; and importing the grid file, the level file and the base map by utilizing the SurferAPI, and generating the contour map consistent with the base map in size on the base map. The whole process can be fully automatic, efficient and fast, and manual intervention is not needed.

Description

technical field [0001] The invention relates to the fields of Web program development, backstage C / S program development and the like, in particular to a method for generating contour maps in real time based on monitoring data. Background technique [0002] Contour graph (also known as contour graph) is a graphic representation of continuous distribution and gradually changing quantitative characteristics by connecting lines of equal value points. It is a curve formed by connecting points with equal values ​​(ie, equivalent The projection of the line) on the plane to represent the shape and size of the subject (such as figure 1 shown). [0003] Contour maps include contour lines, isothermal lines, and isobaric lines, etc., which can intuitively reflect the distribution of each value, as well as the influence of geographical location and topography on the level of monitored values. [0004] The drawing of the contour map is more complicated, and it needs to be combined with...

Claims


Application Information

Patent Timeline
Patent Type & Authority Applications(China)
IPC IPC(8): G06T11/20
CPCG06T11/203
Inventor 陈魁唐邈肖致美郑乃源元洁刘文秀白宇郭瑞李媛
Owner TIANJIN ENVIRONMENT MONITORING CENT
Why Eureka
Try Eureka