Systems and methods for enterprise-wide visualization of multi-dimensional data

a multi-dimensional data and enterprise-wide technology, applied in multi-dimensional databases, multi-programming arrangements, instruments, etc., can solve problems such as computational complexity, difficult to build schemas, and difficult to make business decisions using raw relational tables, and achieve the effect of effectively deploying multi-dimensional data visualization capabilities across large enterprises

Inactive Publication Date: 2006-02-09
ADVIZOR SOLUTIONS
View PDF18 Cites 153 Cited by
  • Summary
  • Abstract
  • Description
  • Claims
  • Application Information

AI Technical Summary

Benefits of technology

[0019] Systems and methods are described for a multi-dimensional visualization system that may effectively deploy multi-dimensional data visualization capabilities across large enterprises. The approach uses a zero-footprint client architecture that allows a network (or Internet) connected remote display device, such as a client device with a web browser that supports industry standard dynamic HTML (e.g., HTML, images and JavaScript), to conduct sophisticated, interactive visualizations of multi-dimensional data.
[0020] Technical complications and costs associated with large scale deployments are avoided, because client devices are not required to install or execute specialized client-based software. Client actions (e.g., mouse clicks, mouse drags, related screen pointer coordinates, etc.) may be translated into, for example, method and / or application interface (API) calls to a central visualization server. If the method and / or application interface (API) calls are generated by the client web browser or scripts embedded within a displayed HTML document, the method and / or application interface (API) calls may be transmitted directly from the client to the visualization server. Otherwise, the client web browser may transmit recorded client actions to a central visualization web service that may translate the recorded user actions into method and / or application interface (API) calls compatible with the visualization server and then may transmit the method and / or application interface (API) calls to the visualization server. In response to receiving such method and / or application interface (API) calls the visualization server may generate updated visual components, or visualization graphics, (e.g., multi-dimensional visualization graphics, graphics with embedded text, etc.) and relay the updated visual components back to the client device, either directly or via the visualization web service.
[0022] The described systems and methods for implementing an enterprise-wide multi-dimensional data visualization application / system are based upon a client “zero-footprint” architecture that allows any web-enabled client to visualize large amounts of data, and to dynamically interact with the visualized data, or visualization. The approach is easy to deploy, easily maintained and will support users distributed throughout a highly diverse operational infrastructure. However, the approach requires no more network bandwidth per client session than a typical web browsing session.

Problems solved by technology

For a variety of reasons, including data cleanliness, scalability, efficiency of the relational method, difficulty in building schemas, and computational complexity, analyzing, understanding, and making business decisions using raw relational tables is difficult.
Unfortunately, the relational model and the standard interface of the structured query language (SQL) used to manipulate relational tables, as described in “A Guide to the SQL Standard,” C. J. Date et al, Addison-Wesley, Reading, Mass., 1997, are not always well-suited for analysis tasks.
When submitted against warehouses that have been engineered for fast transaction archiving, analysis queries frequently run extremely slowly.
Unfortunately, the number of large-scale deployments of multi-dimensional visualization applications has been limited.
One reason for the limited number of large-scale multi-dimensional visualization application deployments is that existing multi-dimensional visualization system architectures require software to be installed on the client device, or end-user computer.
However, such client device software technologies are not supported by standard client device web browsers.
Unfortunately, technologies such as ActiveX may have security and configuration related issues.
Technologies such as Java may have issues related to installation and version.
Further, while vector drawing techniques, such as Flash and SVG, can make pretty charts, they do not support complex interactions between a user and the visualized data.
Therefore, an architecture that requires one or more of the above technologies to be loaded upon a client device introduces installation, configuration, and operational complexities that would not be introduced by an architecture that does not require such client device technologies.
Similar problems are likely to be introduced by any multi-dimensional visualization system architecture that requires additional software to be loaded upon a client device.
The plug-in download and installation process, described above with respect to FIG. 2, may be subject to issues that render client device 2102 un-usable as a visualization client.
For example, an office user working from home may only have slow dial-up access, and the requirement to download and install a new component for the home computer would limit their ability to immediately see results.
Alternatively, a corporate user may not have sufficient privileges to download and install a plug-in software module (e.g., a latest version of Java or Flash, etc.) to the client device.
The lost time and added cost of having the IT department intercede increases the overall burden and frustration with such a system.
Furthermore, such client-based technologies may be affected by idiosyncrasies within the hardware and software of the client device.
For example, it is not uncommon to find a client device in which the graphics card has glitches in certain modes, and these glitches may impact the performance and usability of the client device for visualization.
Visualization system architectures that employ client-based technologies may experience significant deployment related difficulties.
For example, under the following enterprise deployment scenarios, a visualization system that uses client-based technology is likely to experience significant deployment related technical issues:
Users in different countries have wide variances in the configuration of the computers and do not have a local IT group to support and assist them with adding new features or software.
The user community, however, uses a wide variety of technologies, such as Macintosh computers in schools, Unix computers in research institutions, etc., making any kind of platform-specific solution unacceptable.
However, the organization cannot afford to support these users with any special technology.
However, the approach requires no more network bandwidth per client session than a typical web browsing session.

Method used


Image

  • Systems and methods for enterprise-wide visualization of multi-dimensional data
  • Systems and methods for enterprise-wide visualization of multi-dimensional data
  • Systems and methods for enterprise-wide visualization of multi-dimensional data

Examples


Embodiment Construction

[0045] System and method embodiments are described below with reference to the above drawings, in which like numerals designate like components.

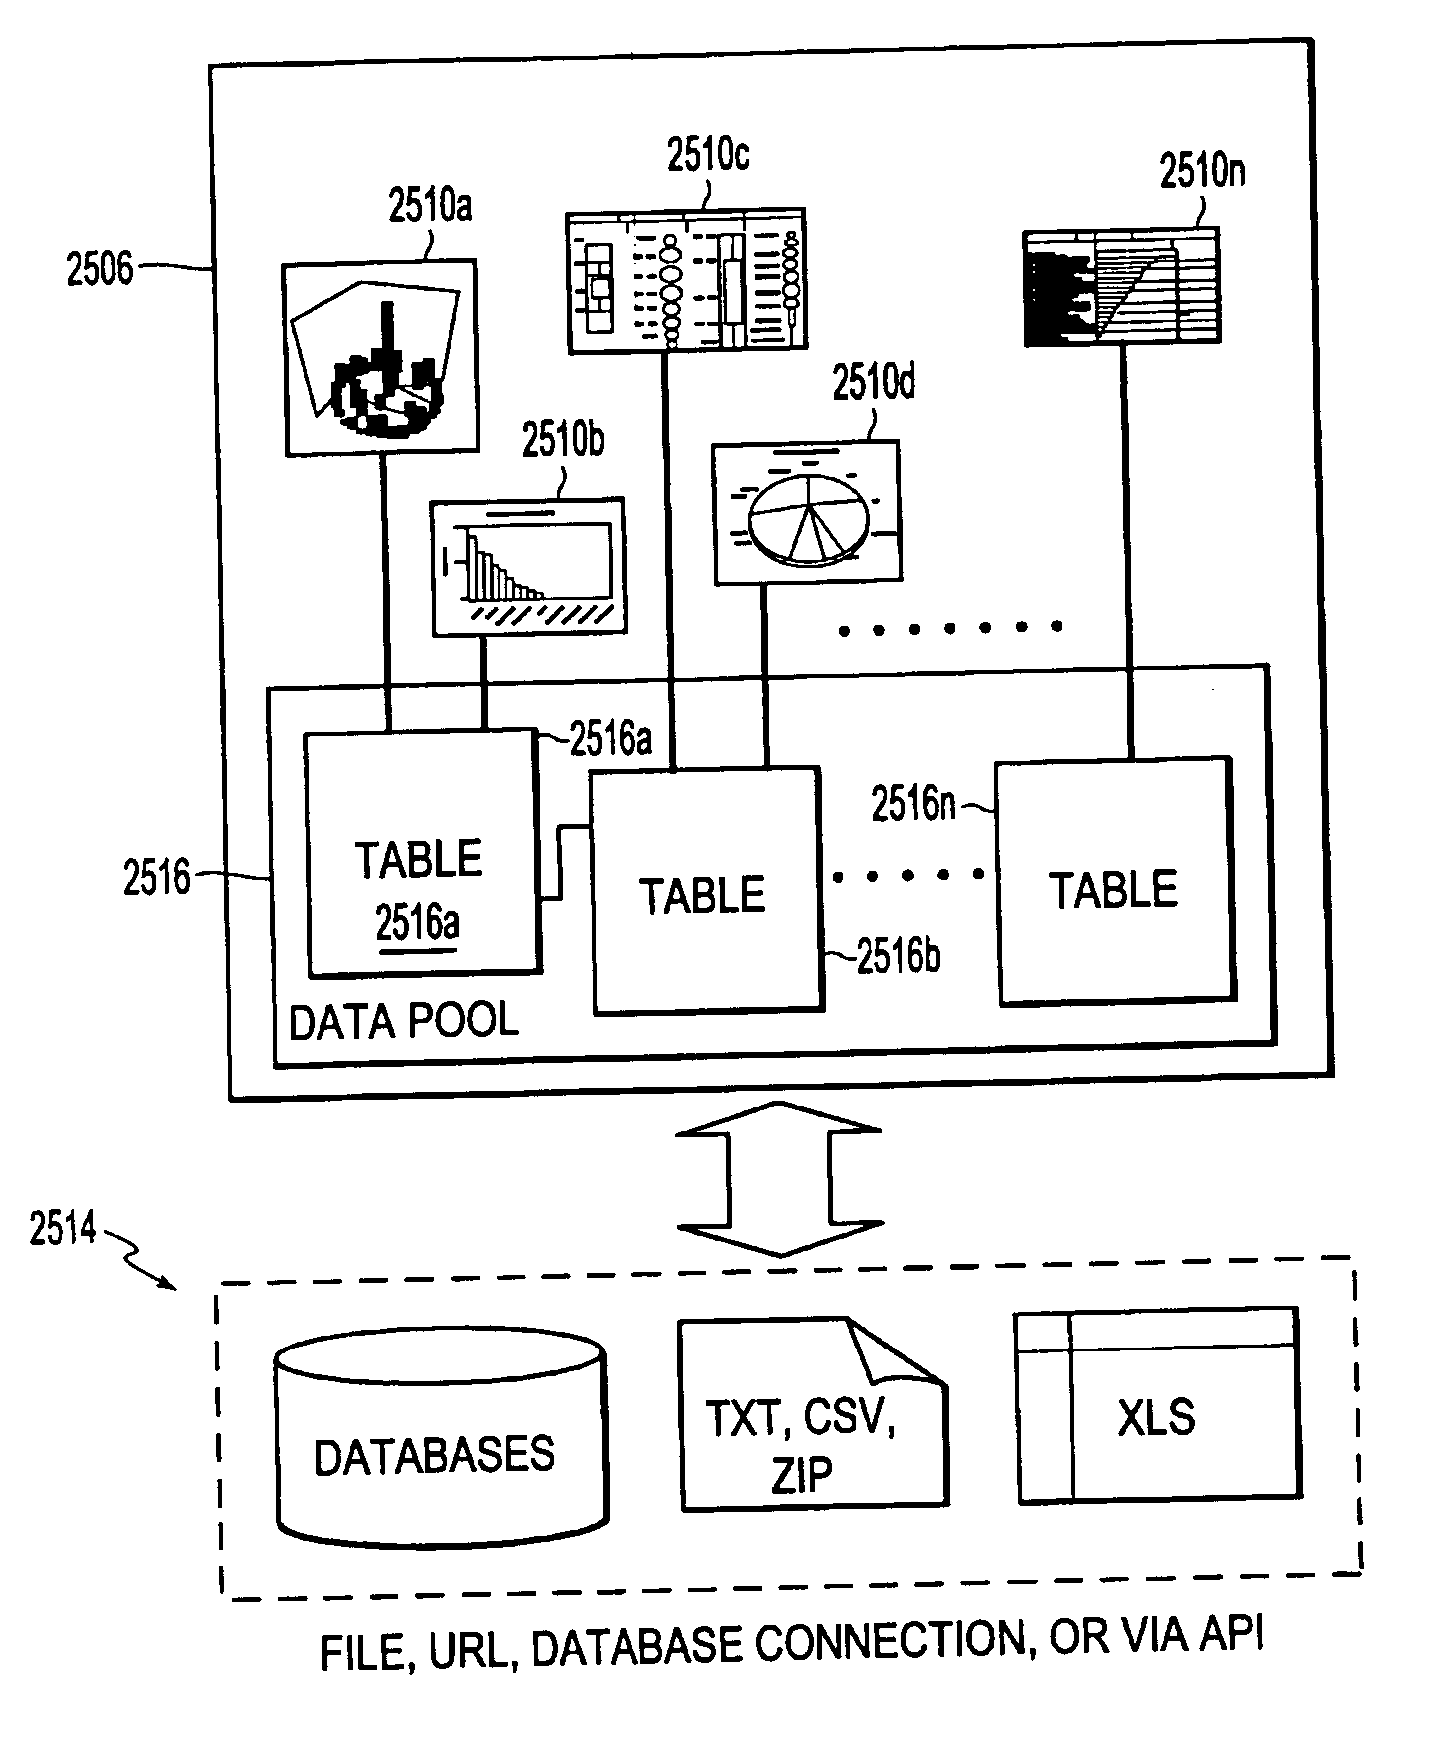
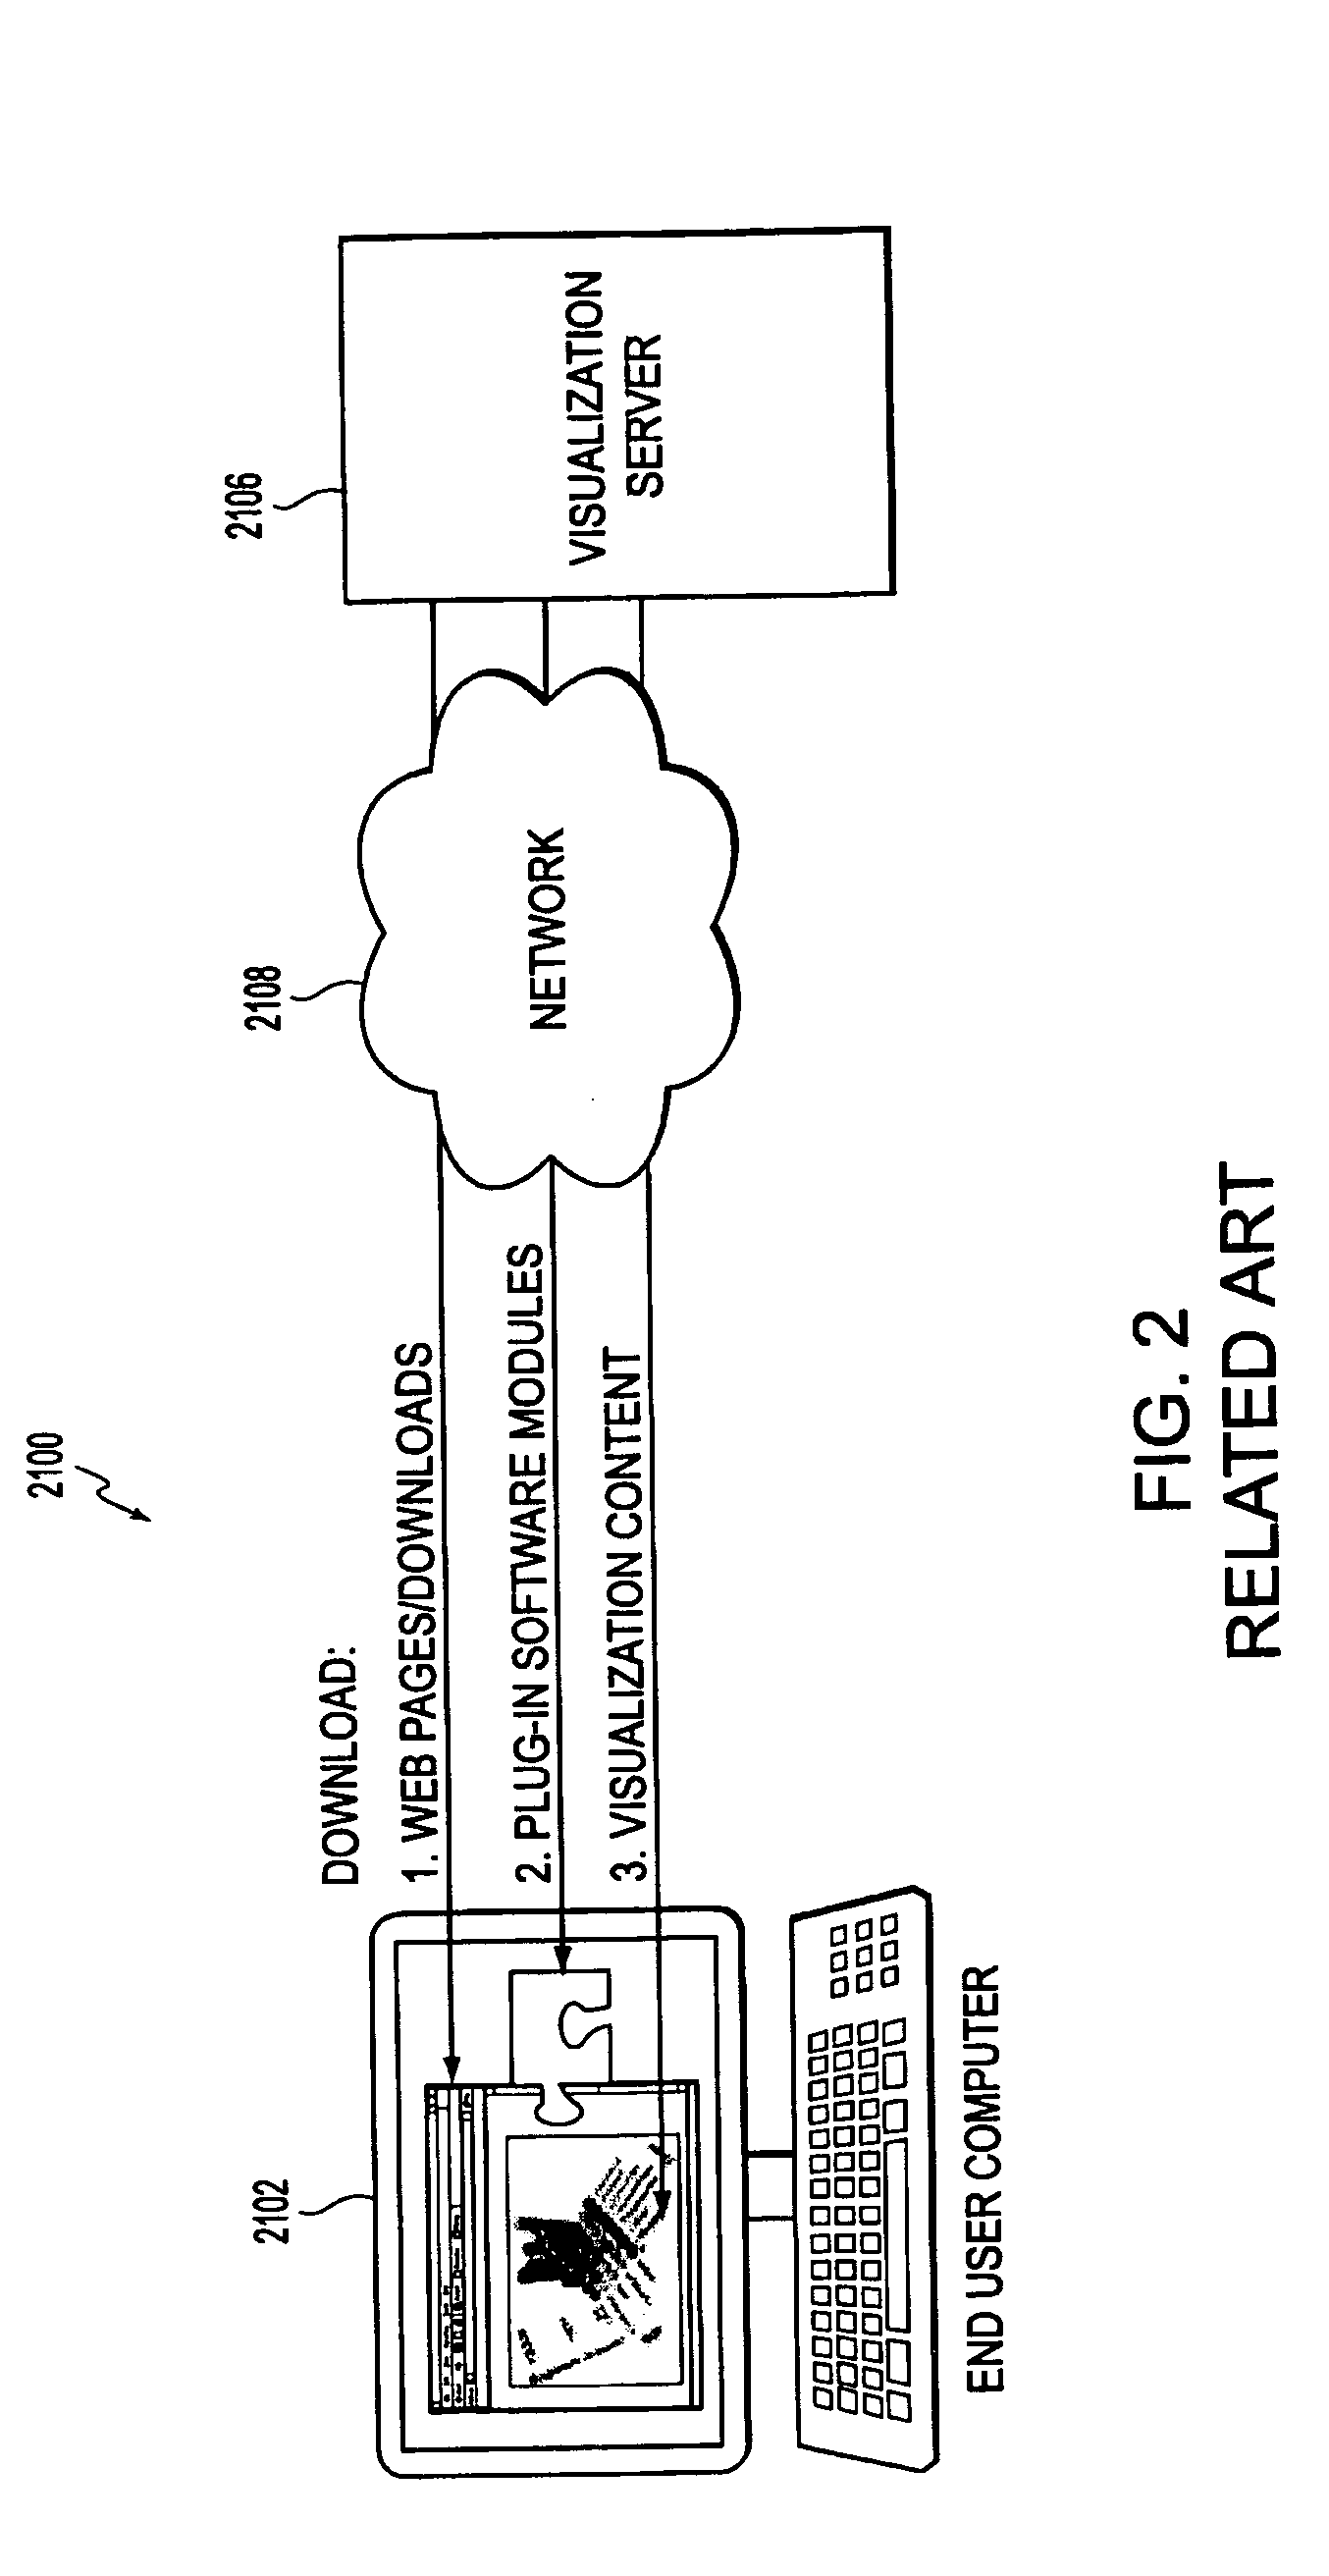
[0046] The described systems and methods relate to a novel approach for providing users with access to multi-dimensional data visualization capabilities. The approach includes an architecture that allows any web-enabled client that supports receipt of HTML web pages to act as a multi-dimensional data visualization client. The architecture does not require the remote display device, such as a client device with a web browser that supports industry standard dynamic HTML (e.g., HTML, images and JavaScript), to download and install additional or “plug-in” software. Further, a client device does not require any additional client device processing or network bandwidth resources above that which would be required by the client device to receive HTML web pages. Although the architecture requires processing and storage resources provided by one or m...


PUM


Abstract

Systems and methods are described that allow powerful multi-dimensional visualization applications to be effectively deployed across large enterprises. The approach employs a zero-footprint client architecture that allows any network (or Internet) connected client device with a web browser that supports industry standard dynamic HTML (i.e., HTML, images and JavaScript) to conduct sophisticated, interactive visualizations of multi-dimensional data. Technical complications and costs associated with large scale deployments are avoided, because client devices are not required to install or execute specialized client-based software. Client actions (e.g., mouse clicks, mouse drags, related screen pointer coordinates, etc.) may be translated into method and application interface (API) calls and transmitted, either directly from a client device or via a visualization web service, to a central visualization server. The visualization server may then generate updated visual components and may relay them back to the client device either directly or via the visualization web service.

Description

CROSS-REFERENCE TO RELATED APPLICATIONS [0001] This application incorporates by reference in its entirety U.S. Provisional Patent Application No. 60 / 598,420, entitled “Advizor Server,” filed on Aug. 4, 2004. BACKGROUND [0002] 1. Field of Invention [0003] This invention relates to visualizing multiple-dimension data. [0004] 2. Description of Related Art [0005] With the decreasing cost of storage and increased bandwidth of networks, storing large volumes of fine grain data has become technically feasible and cost effective. In business environments, this fine grain data typically includes, for example, transactions, sales records, and / or customer information. This fine grain data is typically stored in warehouses or data marts. When properly analyzed, this fine grain data provides a rich analysis source for understanding customer behavior. [0006] Transactions collected by operational systems are frequently stored in relational tables. For a variety of reasons, including data cleanline...

Claims


Application Information

Patent Timeline
Patent Type & Authority Applications(United States)
IPC IPC(8): G06F17/30G06F9/46G06F15/16G06F17/24
CPCG06F3/04815G06F17/30592G06F8/38G06F16/283
Inventor PYRCE, JOHN D.LUERS, JONATHON H.SWANSON, WILLIAM
Owner ADVIZOR SOLUTIONS
Why Eureka
Try Eureka