Fluorescent correalated spectrometric analysis device

a spectrometric analysis and fluorescence correlation technology, applied in the direction of fluorescence/phosphorescence, luminescent dosimeters, optical radiation measurement, etc., can solve the problem of large amount of time required to read out the detection signals of a single frame, and achieve the effect of high speed, extremely small influence, and high speed

Active Publication Date: 2006-11-23
HAMAMATSU PHOTONICS KK
View PDF3 Cites 13 Cited by
  • Summary
  • Abstract
  • Description
  • Claims
  • Application Information

AI Technical Summary

Benefits of technology

[0006] The present invention has been made to resolve the above issues and an object thereof is to provide a fluorescence correlation spectroscopy analyzer that enables fluorescence correlation spectroscopy analysis to be performed simultaneously on multiple points of a measured sample at high speed.
[0022] Preferably, the fluorescence correlation spectroscopy analyzer is equipped with an electronic shutter signal outputting means, which outputs, to the photodetection surface, an electronic shutter signal for sweeping away the charges generated by the pixels not belonging to the pixel set. In this case, when in reading the charges from the detector, horizontal transfer by the horizontal transfer register or the second charge accumulating elements does not need to be executed if the charges generated by the pixels belonging to the pixel set are not accumulated in the horizontal transfer register or the second charge accumulating elements. The charges generated by photoelectric conversion at the pixels belonging to the pixel set can thus be read at higher speed.

Problems solved by technology

However, when a CCD camera is used, since the detection signals of the respective pixels must be read out in order one by one, a large amount of time is required to read out the detection signals of a single frame.

Method used


Image

  • Fluorescent correalated spectrometric analysis device
  • Fluorescent correalated spectrometric analysis device
  • Fluorescent correalated spectrometric analysis device

Examples


Embodiment Construction

[0040] Preferred embodiments of the present invention's fluorescence correlation spectroscopy analyzer shall now be described in detail along with the drawings. In the description of the drawings, the same elements shall be provided with the same symbols and redundant description shall be omitted. The dimensional proportions in the drawings do not necessarily match those of the description.

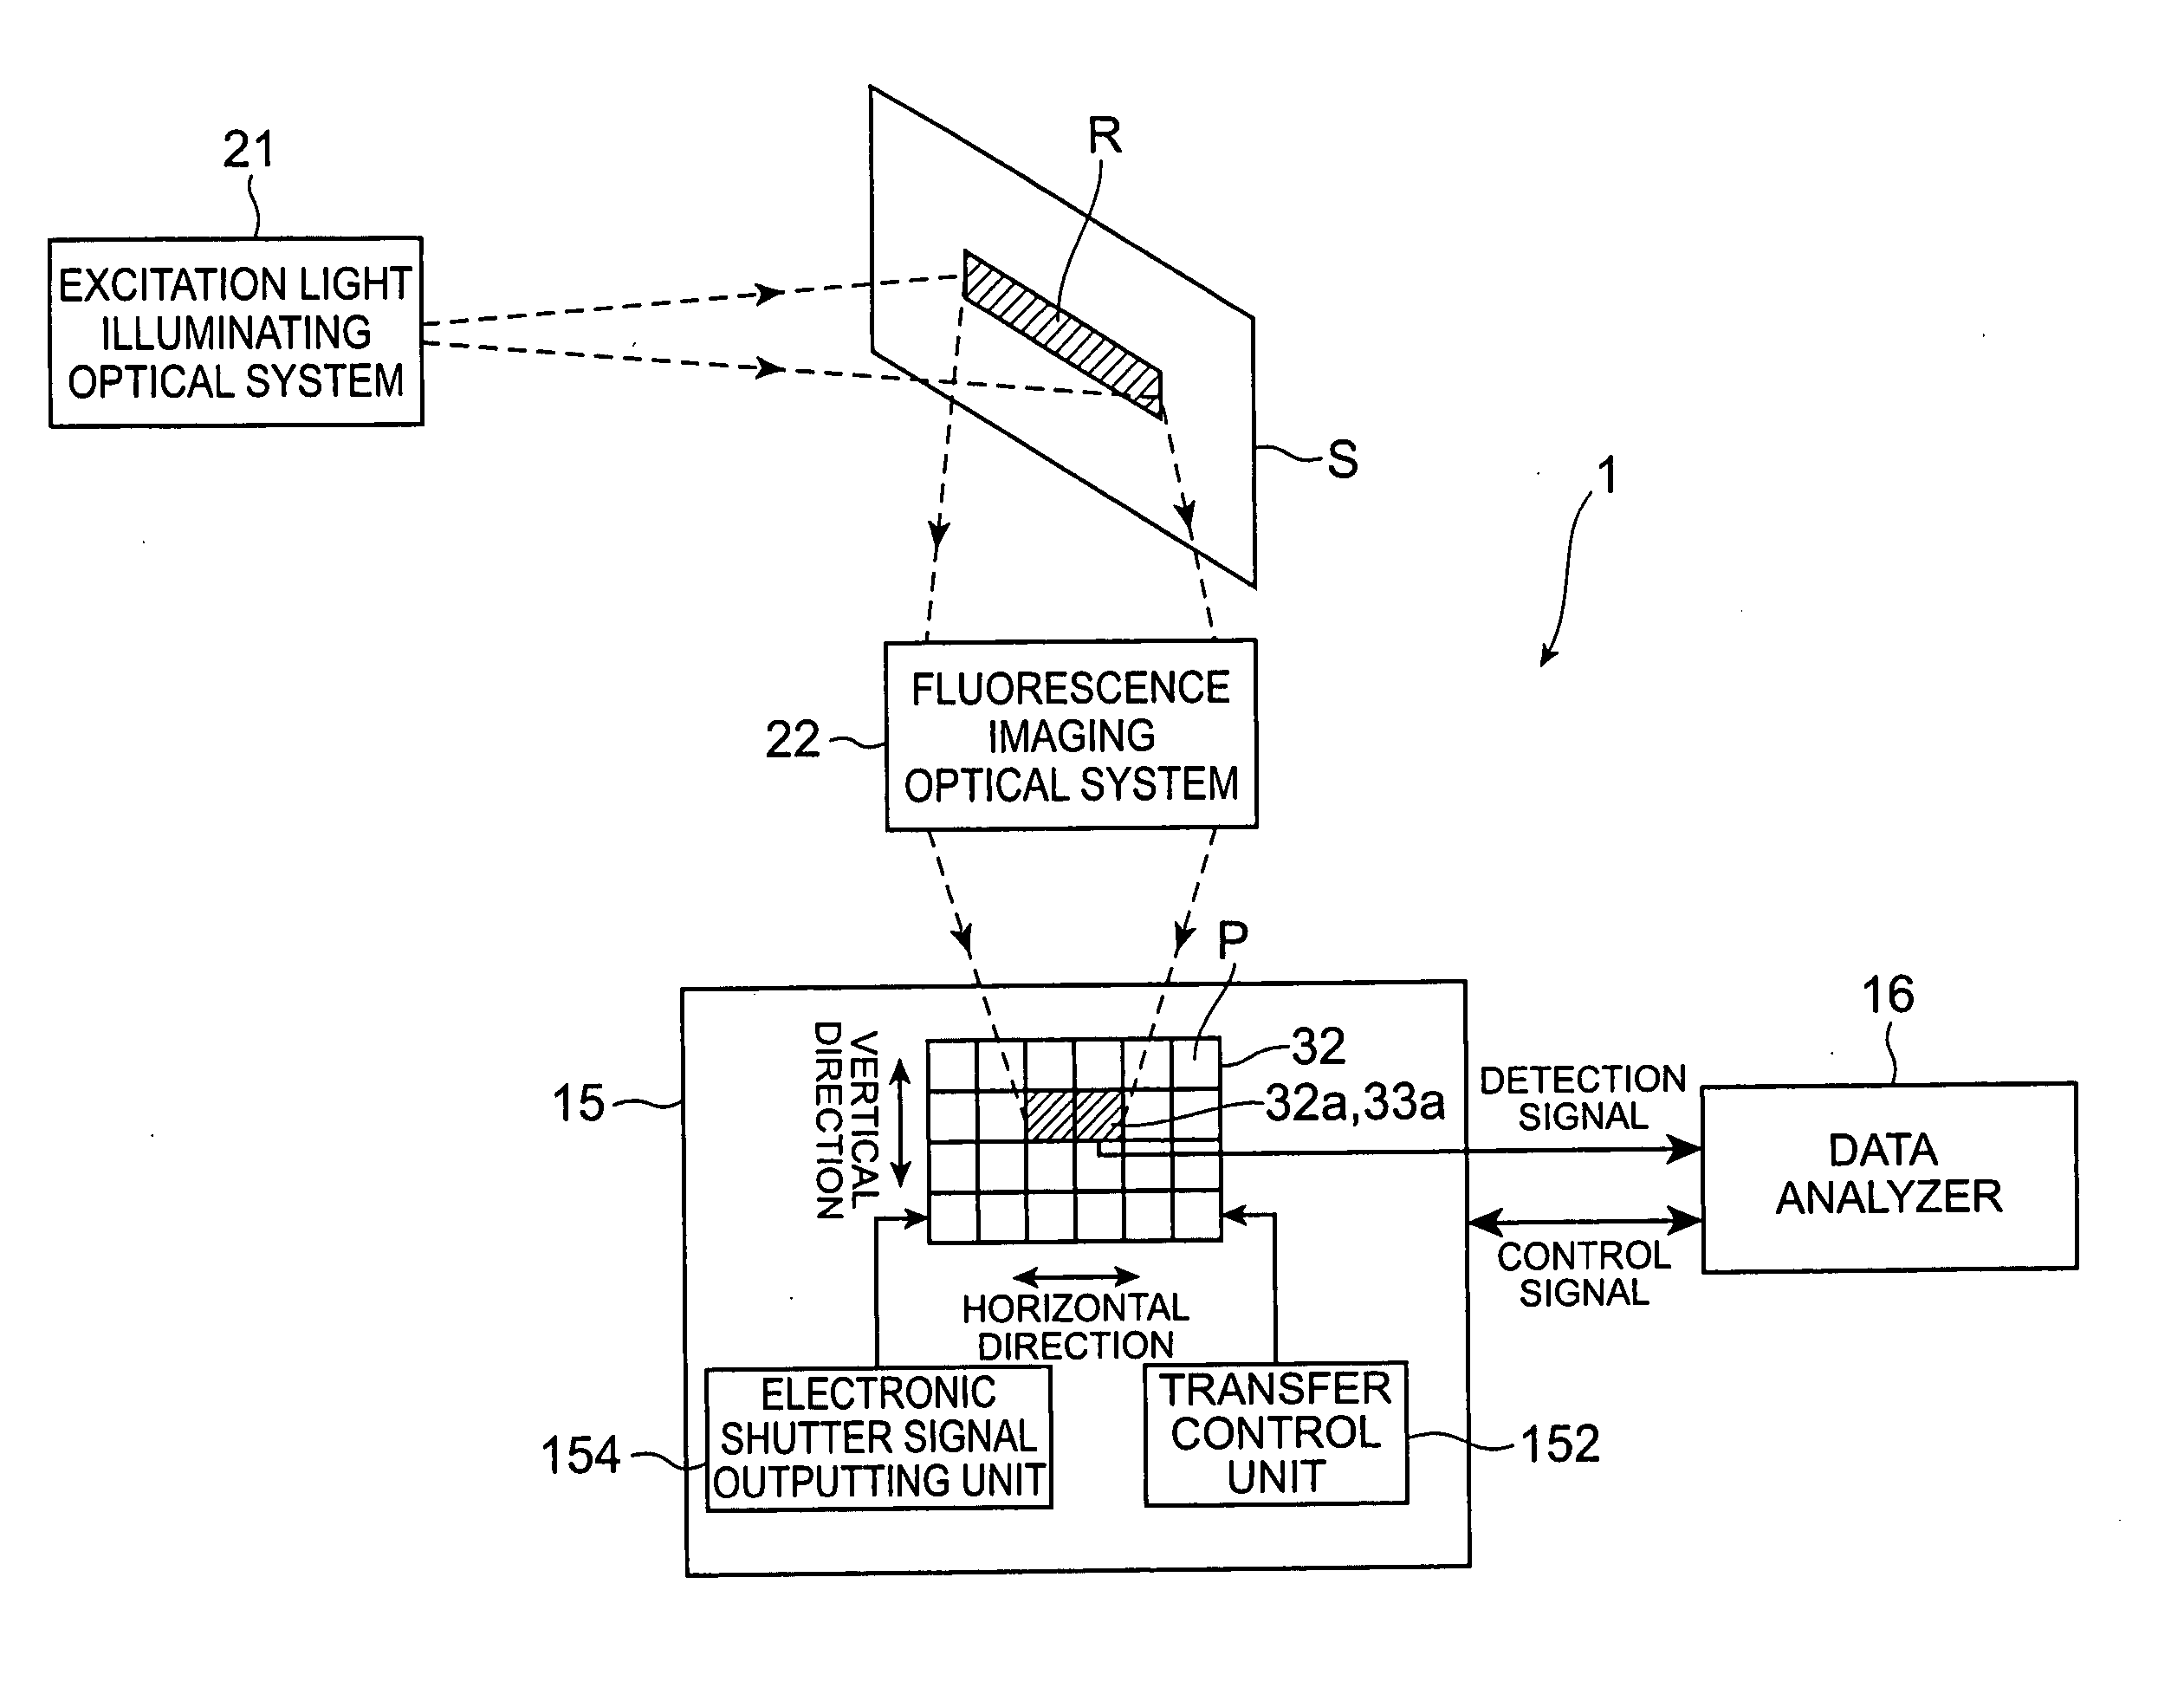
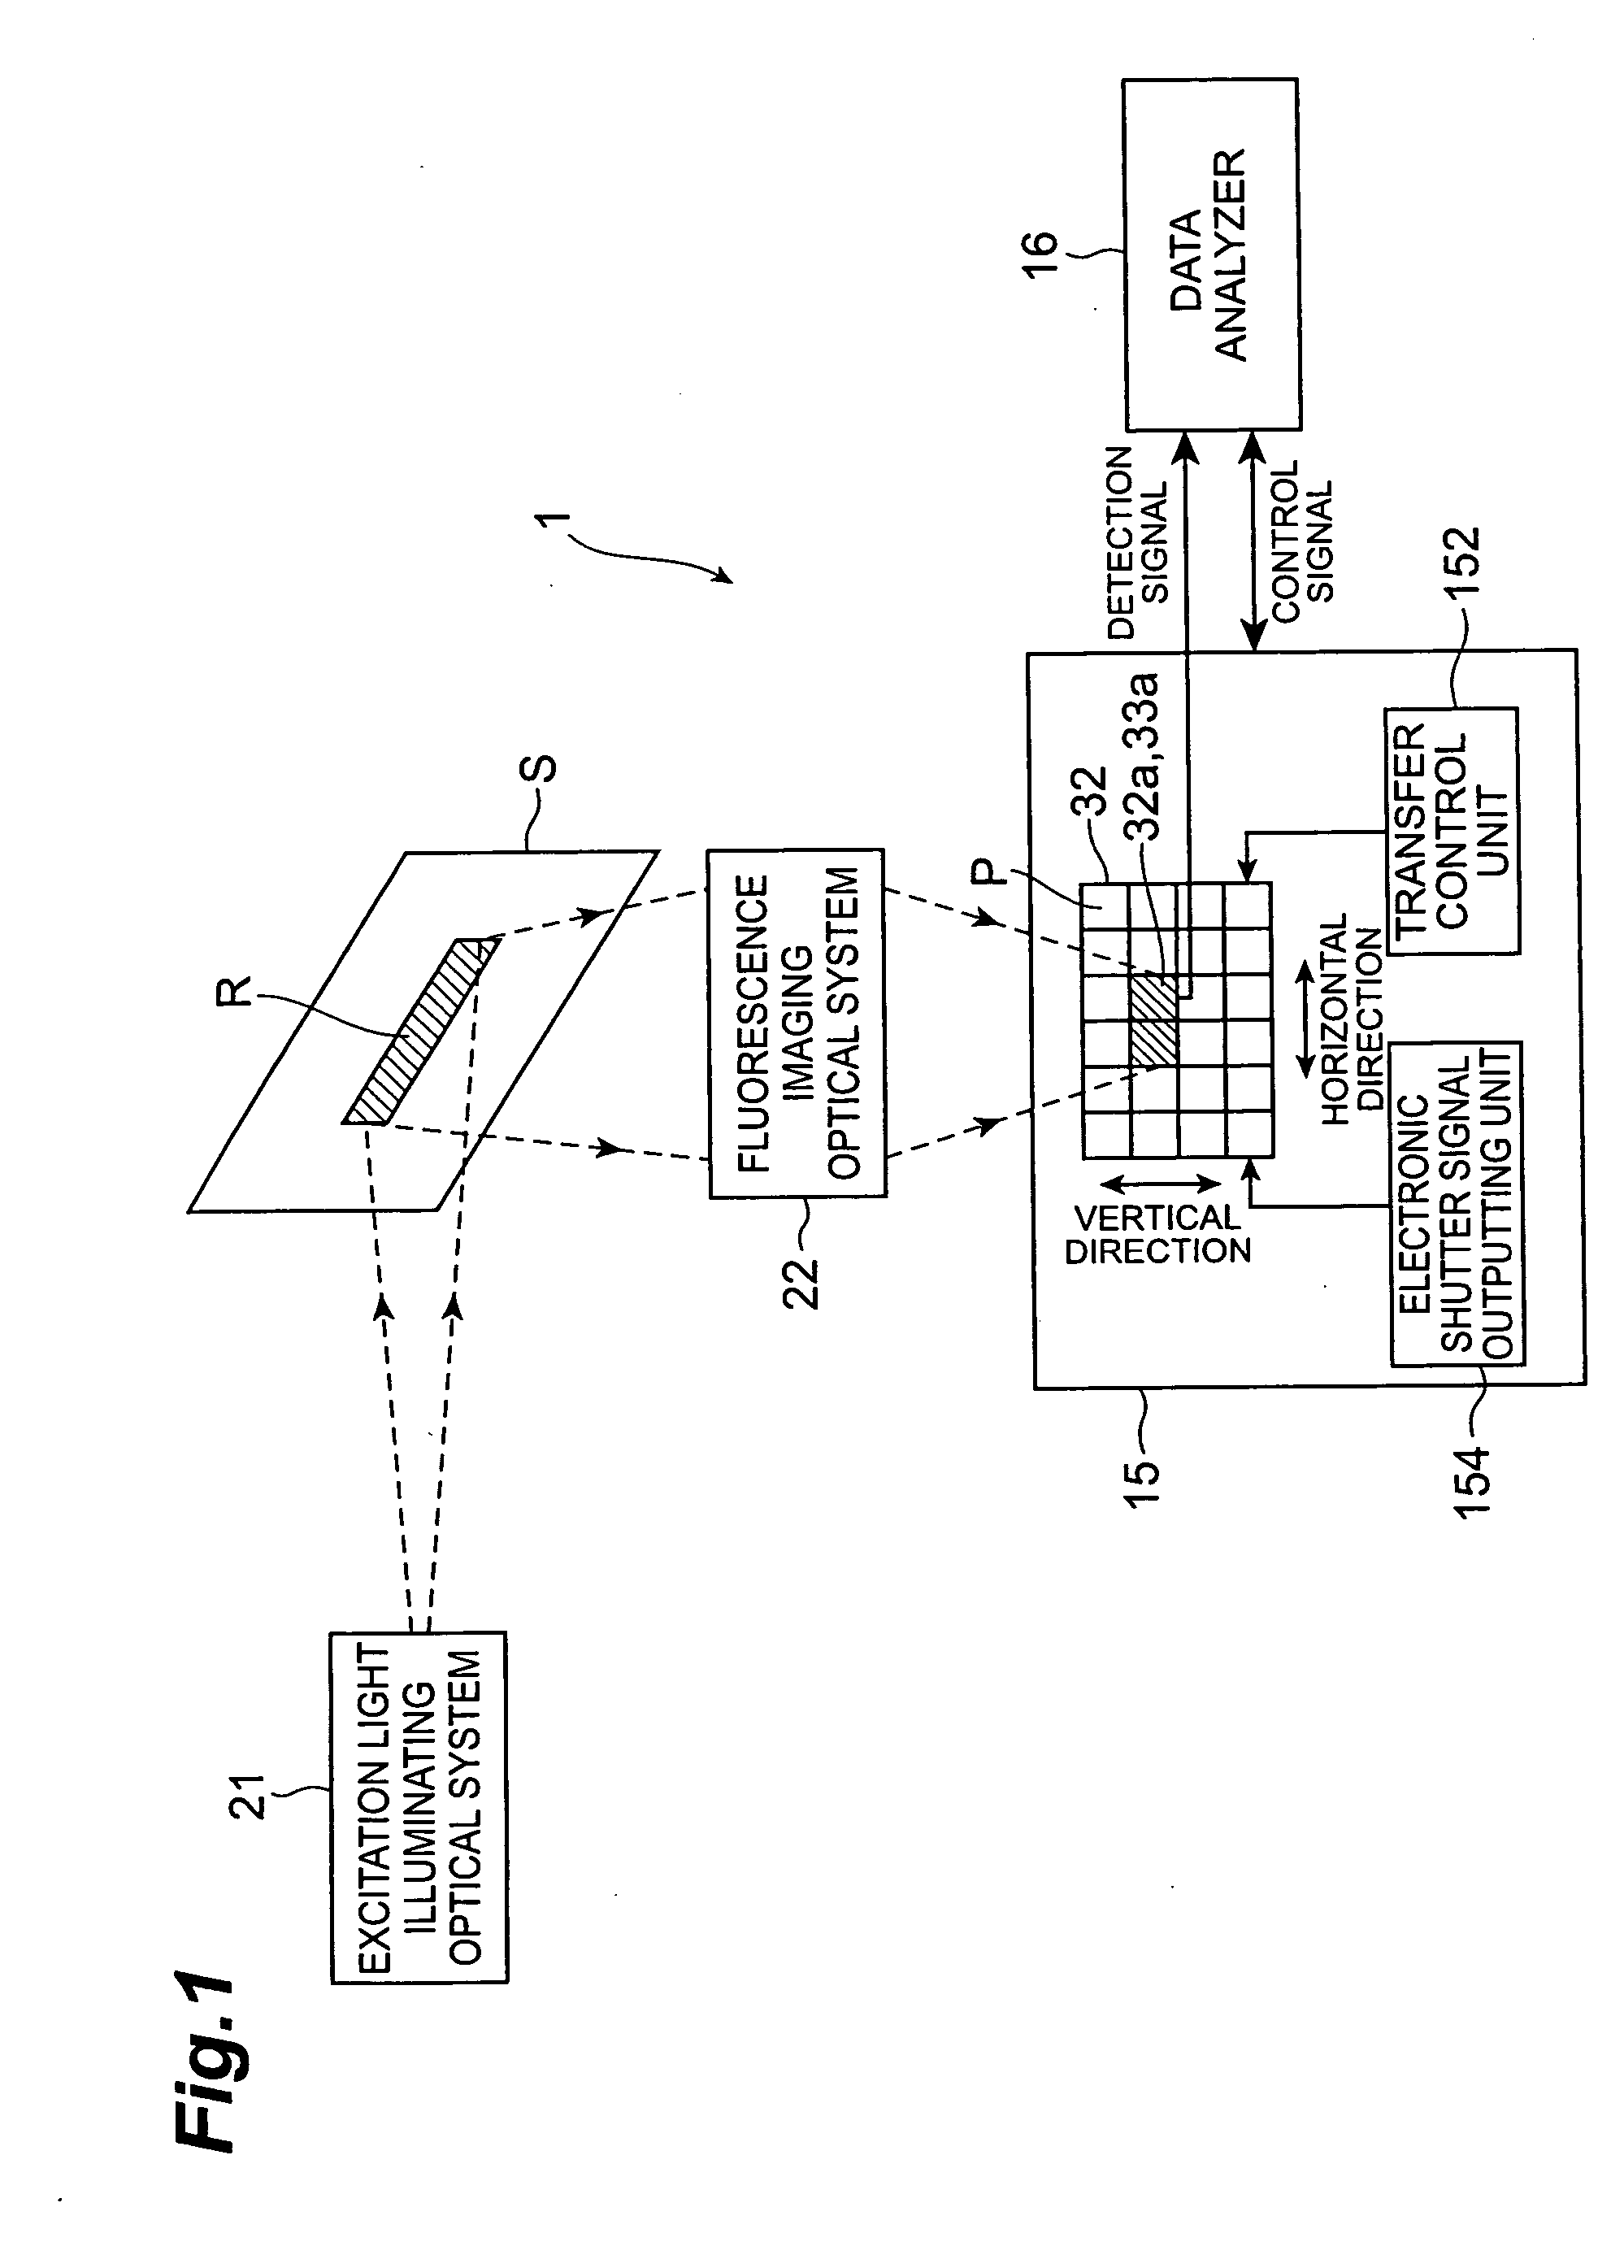
[0041]FIG. 1 is an arrangement diagram showing an embodiment of the present invention's fluorescence correlation spectroscopy analyzer. The fluorescence correlation spectroscopy analyzer 1 illuminates excitation light onto a measured sample, detects the fluorescence emitted from fluorescent molecules in the measured sample due to the illumination of the excitation light, and determines autocorrelation functions of the fluorescence fluctuations based on the detection signals to analyze translational diffusion motions, etc., of the fluorescent molecules. The fluorescence correlation spectroscopy an...


PUM

PropertyMeasurementUnit
wavelengthaaaaaaaaaa
exposure timeaaaaaaaaaa
fluorescence imaging opticalaaaaaaaaaa

Abstract

A fluorescence correlation spectroscopy analyzer 1 is equipped with an excitation light illuminating optical system 21, a fluorescence imaging optical system 22, a CCD camera 15, and a data analyzer 16. The excitation light illuminating optical system 21 illuminates excitation light onto a predetermined region of a measured sample S. The fluorescence imaging optical system 22 images the fluorescence generated at the measured sample S onto the photodetection surface of the CCD camera 15. The CCD camera 15 performs photoelectric conversion of the fluorescence made incident onto the photodetection surface in accordance with the respective pixels and outputs the charges generated by the photoelectric conversion as detection signals from an output terminal. The data analyzer 16 inputs the detection signals based on the charges generated at the pixels, among the pixels of the CCD camera 15, that belong to an analyzed pixel set and computes autocorrelation functions of the input detection signals according to each pixel. A fluorescence correlation spectroscopy analyzer, which is enabled to perform fluorescence correlation spectroscopy analysis on multiple points of a measured sample simultaneously and at high speed, is thus provided.

Description

TECHNICAL FIELD [0001] The present invention relates to a fluorescence correlation spectroscopy analyzer. BACKGROUND ART [0002] Fluorescence correlation spectroscopy (FCS) is a method wherein the fluorescence fluctuations (variations of the fluorescence intensity in time) of fluorescent molecules in a measured sample are measured and autocorrelation functions are determined from the fluorescence fluctuations to analyze the translational diffusion motions, etc., of the fluorescent molecules. By FCS, for example, the binding and motion of a single protein molecule can be analyzed. [0003] Examples of conventional analyzers that make use of FCS include those described in Document 1 (Japanese Patent Application Laid-Open No. 2000-166598), Document 2 (Japanese Patent Application Laid-Open No. 2001-272346), and Document 3 (Japanese Patent Application Laid-Open No. 2001-194305). With the analyzer described in Document 1, a point-like excitation light is illuminated onto a single point of a ...

Claims


Application Information

Patent Timeline
Patent Type & Authority Applications(United States)
IPC IPC(8): G01J3/30G01N21/64H04N5/345H04N5/372
CPCG01J3/2803G01J3/2823G01J3/2889G01J3/4406G01J2003/2813H04N5/372G01N21/645G01N21/6456G01N2021/6417G01N2021/6423H04N5/3454G01J2003/282H04N25/443H04N25/71
Inventor WATANABE, HIROHIKOWATANABE, MOTOYUKIINOUE, TAKAYUKI
Owner HAMAMATSU PHOTONICS KK
Why Eureka
Try Eureka