
Software based spread spectrum signal processing

a software and spectrum signal technology, applied in the field of spread spectrum signal processing, can solve the problems of inability to receive, device is not only expensive, and unit weight and heavyness, and achieves the effects of reducing the number of operations, reducing memory requirements, and efficient mapping

Active Publication Date: 2006-12-07
QUALCOMM TECH INT
View PDF2 Cites 16 Cited by
  • Summary
  • Abstract
  • Description
  • Claims
  • Application Information

AI Technical Summary

Benefits of technology

[0042] The object of the present invention is therefore to provide a software based solution for processing spread spectrum signals having a reduced implementation loss, which solves the problems above and thus presents a strategy that increases the sensitivity at the lowest level of operation while maintaining low processing requirements and memory usage.

Problems solved by technology

Due to different signal formats and frequency bands of these standards a navigation receiver adapted for one GNSS, say GPS, is not able to receive and process signals from a satellite that belongs to a different GNSS, say the Galileo system.
However, including multiple receiver chains in a single device is not only expensive, it also renders the unit bulky and heavy, particularly if more than two signal formats are to be processed.
This imposes a significant sensitivity loss (up to 6 dB).
This causes additional signal power degradation by 6-10 dB.
Further, if circumstances external to the receiver, such as interference, multi-path fading and signal obscuration are disregarded, any signal power loss is caused by optimizations in the quantizing of correlation operands, the quantizing of the tracking error in the time delay of code replicas and the frequency error in the Doppler estimation.
This generally degrades the performance and stability of these filters, especially in terms of dynamic performance.
However, further increases of the number of bits only provide insignificant quality enhancements, and are therefore not justified in commercial applications.
Use of single bit values instead of a 3-bit representation results in a signal power loss of about 2 dB-Hz.
A single bit representation is also unfavorable because it introduces unwanted signal properties.
More advanced (and expensive) receivers often use multi-bit data and multi-bit carrier Doppler representations.
Thus, using XOR instructions is simply not sufficient to achieve a good processing efficiency.
In this case, however, the L-value must be doubled (i.e. around 4000), which results in an equivalent overall processing load.
Naturally, such a MIPS-requirement is unsuitable for today's handheld devices.
However, to achieve such performance with acceptable accuracy the receiver must have access to a relatively large memory means having a high bandwidth and low latency.
Nevertheless, this causes a performance loss in the above-mentioned packed processing SIMD approach, since the microprocessor register widths are fixed and fewer samples can then be computed in parallel per pass with XOR operations.
If both carrier Doppler shift estimation and the incoming data stream are multi-bit valued the processing becomes very complex, and difficult to perform efficiently because the representation of the intermediate products will inevitably expand.
However, also in this case the performance penalty compared to single-bit processing is still considerable.
In implementations with more than 2 bits per data value the additional logic operations required for combining individual sign and magnitude parts becomes a serious bottleneck.

Method used


Image

  • Software based spread spectrum signal processing
  • Software based spread spectrum signal processing
  • Software based spread spectrum signal processing

Examples


first embodiment

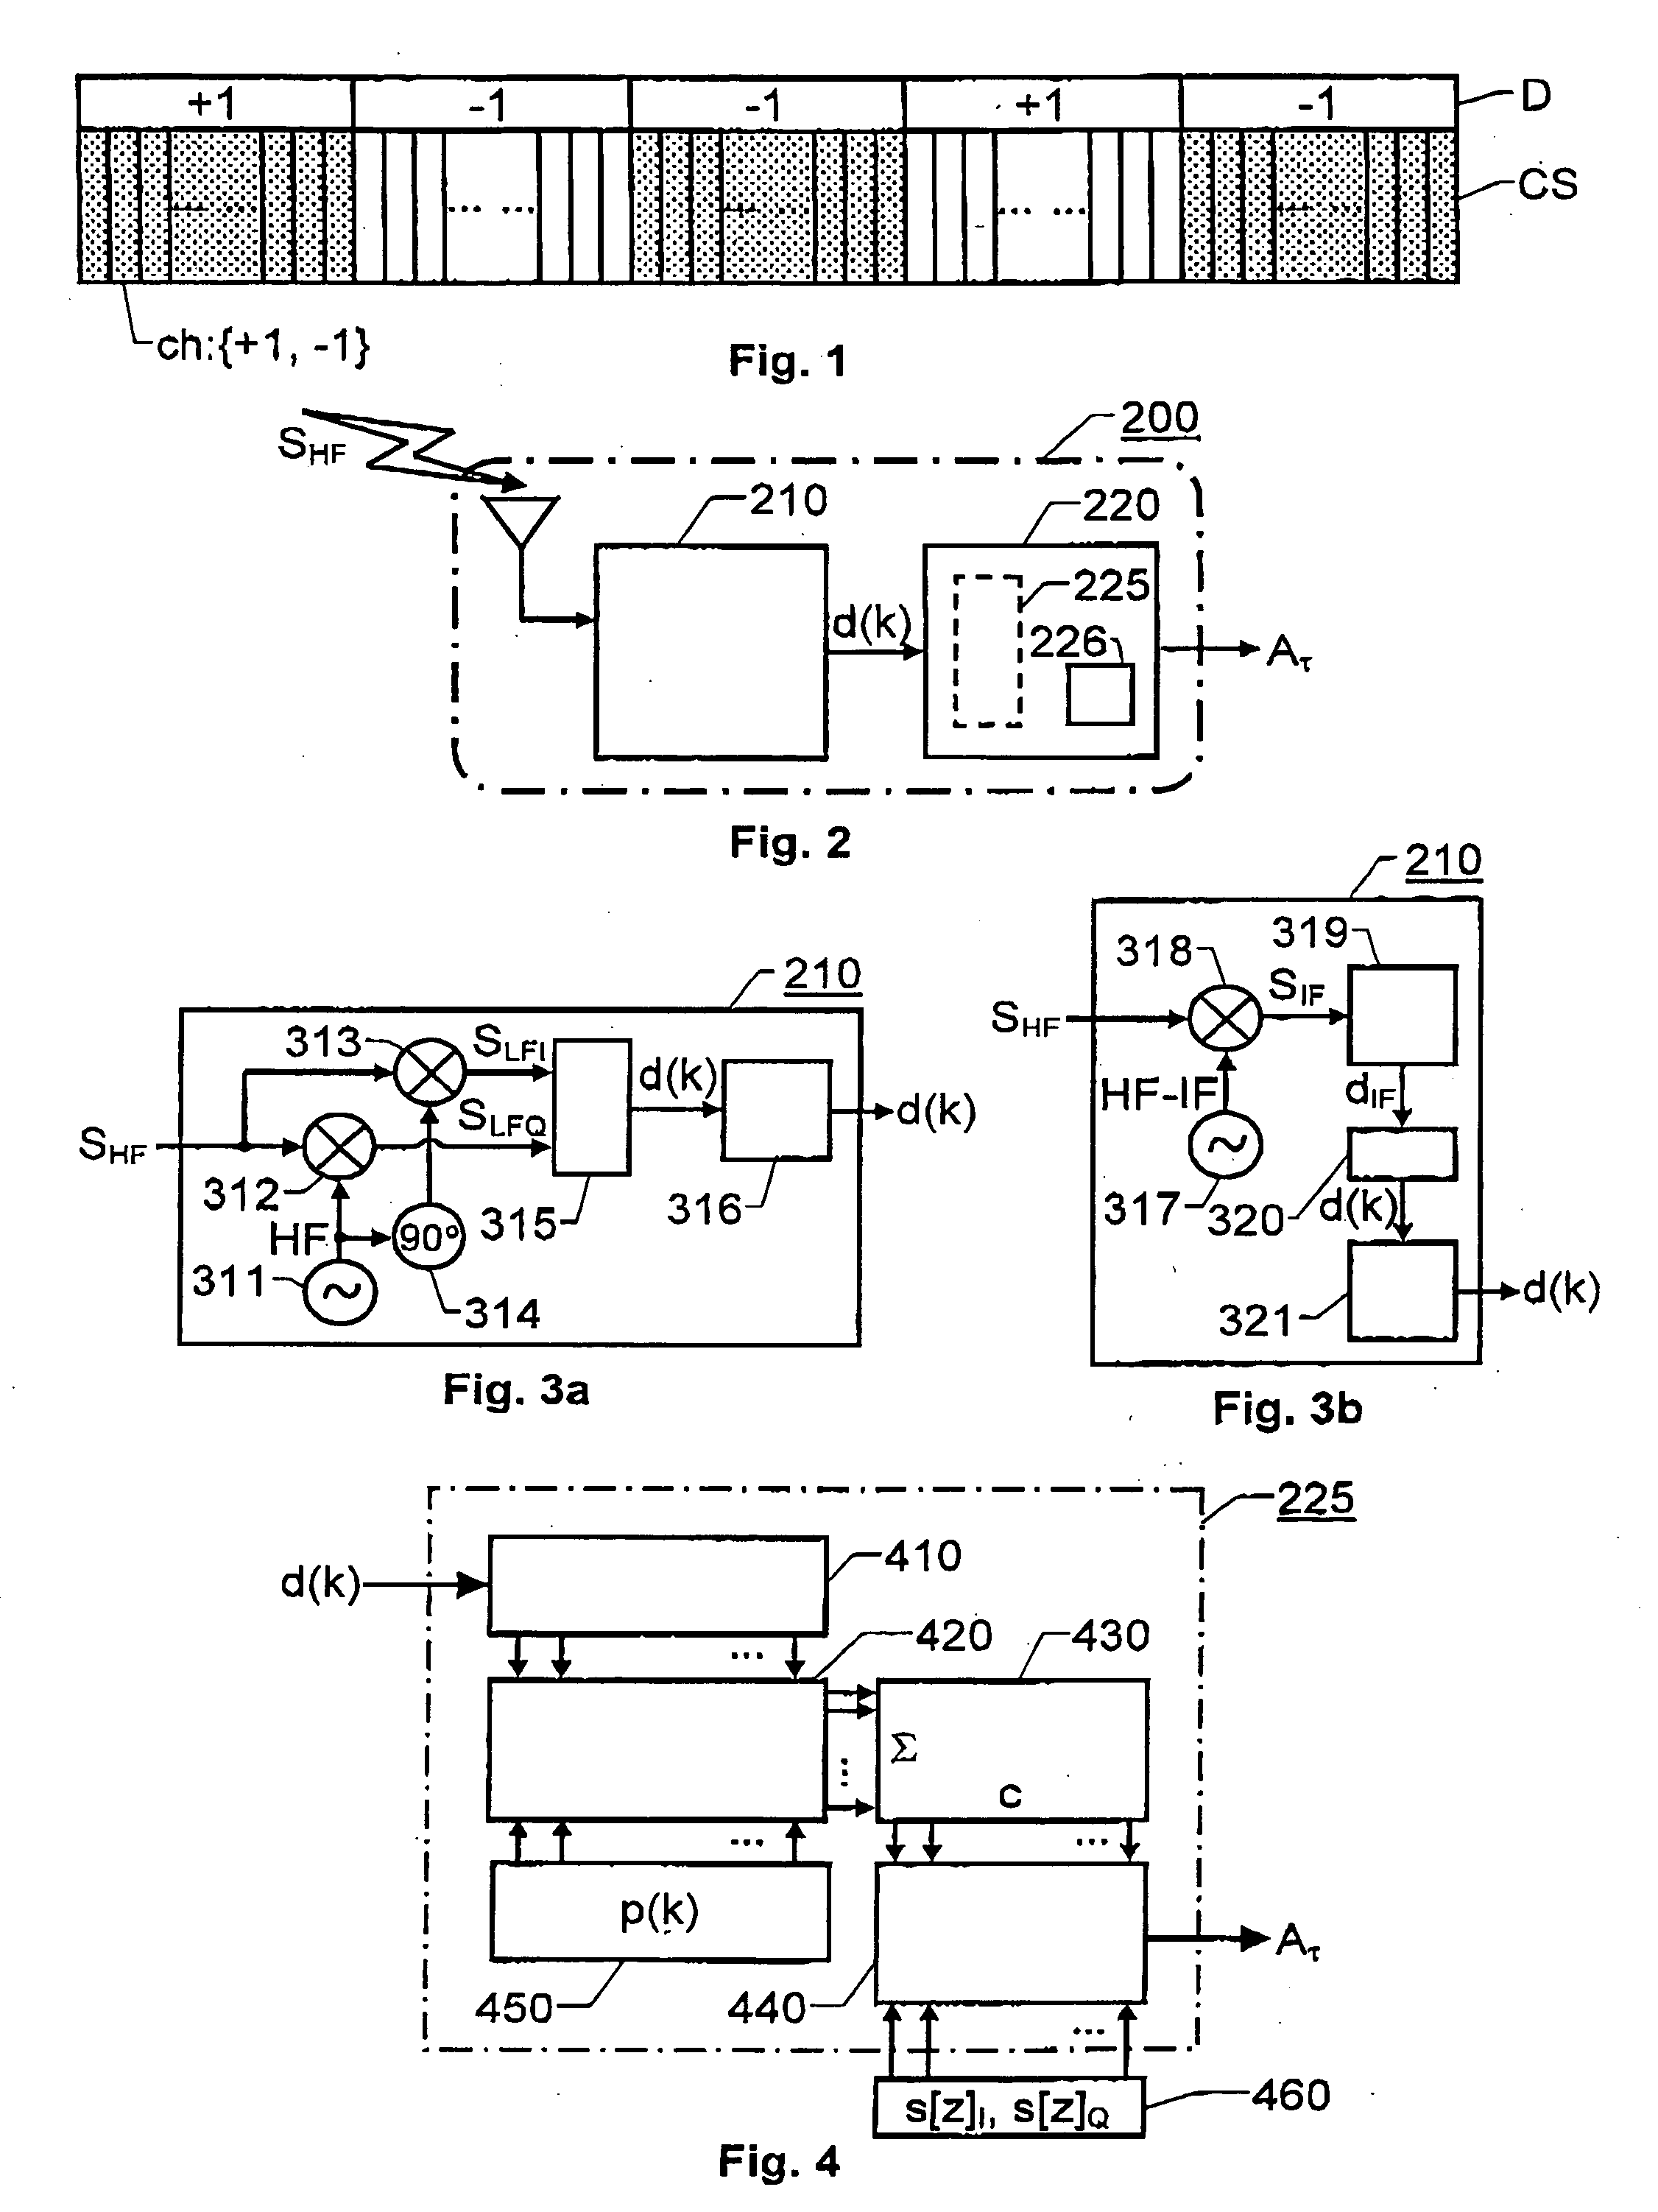
[0073]FIG. 3a shows a block diagram over the data interface unit 210 according the invention. Here, the data interface unit 210 includes a downconverting section, a digitizing section 315 and a buffer unit 316.

[0074] The downconverting section is adapted to receive the spread spectrum source signal SHF, and in response thereto produce a pair of frequency downconverted signals representing in-phase data SLFI and quadrature-phase data SLFQ respectively. To this aim, the downconverting section may include an oscillator 311, a first mixing means 312, a second mixing means 313 and a phase shifting means 314.

[0075] The oscillator 311 generates a sinusoid signal of a frequency HF which is essentially the same as that of the spread spectrum source signal SHF (i.e. a relatively high frequency). The oscillator frequency HF is fed both to the first mixing means 312 and the phase shifting means 314. The first mixing means 312 also receives the spread spectrum source signal SHF, and as a result...

second embodiment

[0079]FIG. 3b shows a block diagram over the data interface unit 210 according the invention. In this case, the data interface unit 210 includes a primary downconverting section, a digitizing section 319, a secondary downconverting section 320 and a buffer unit 321.

[0080] The primary downconverting section is adapted to receive the spread spectrum source signal SHF, and in response thereto produce a downconverted signal SIF. To this aim, the primary downconverting section may include an oscillator 317 and a mixing means 318. The oscillator 317 generates a frequency HF-IF, which is slightly lower than in the embodiment described above with reference to the FIG. 3a, however still a comparatively high frequency. The oscillator frequency HF-IF is fed to the mixing means 317. The mixing means 317 also receives the spread spectrum source signal SHF, and as a result of a mixing process accomplished by the mixing means 317, a frequency downconverted signal SIF is produced.

[0081] The digiti...


PUM


Abstract

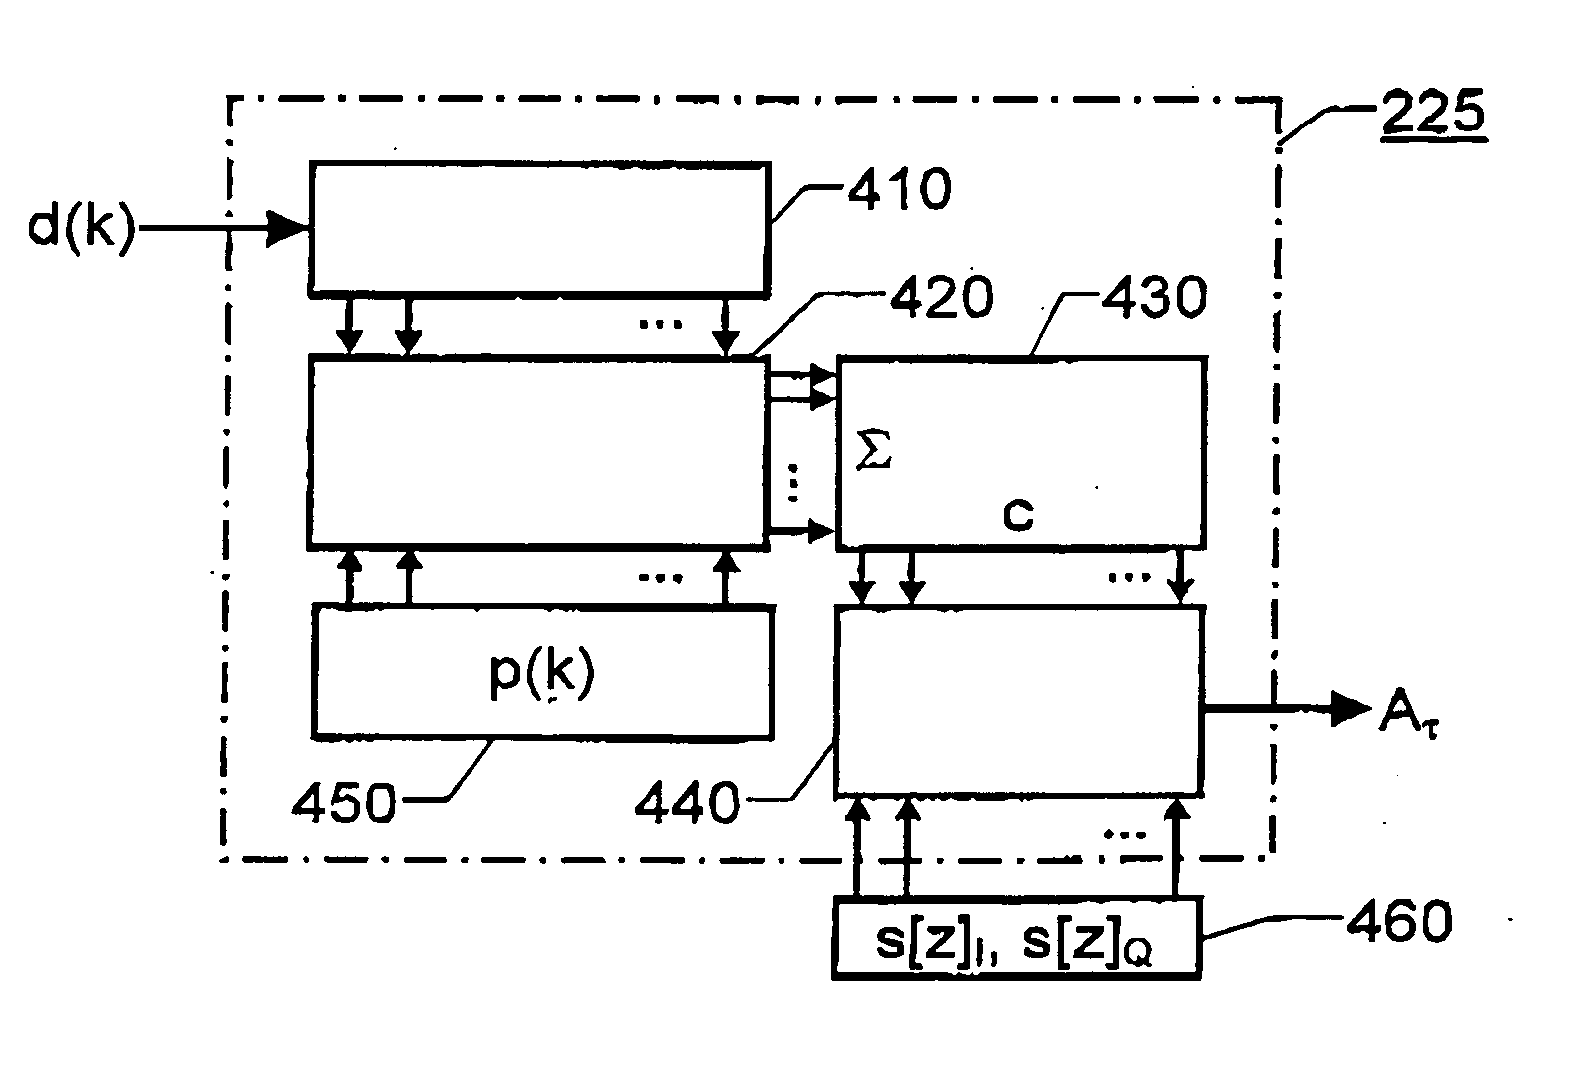
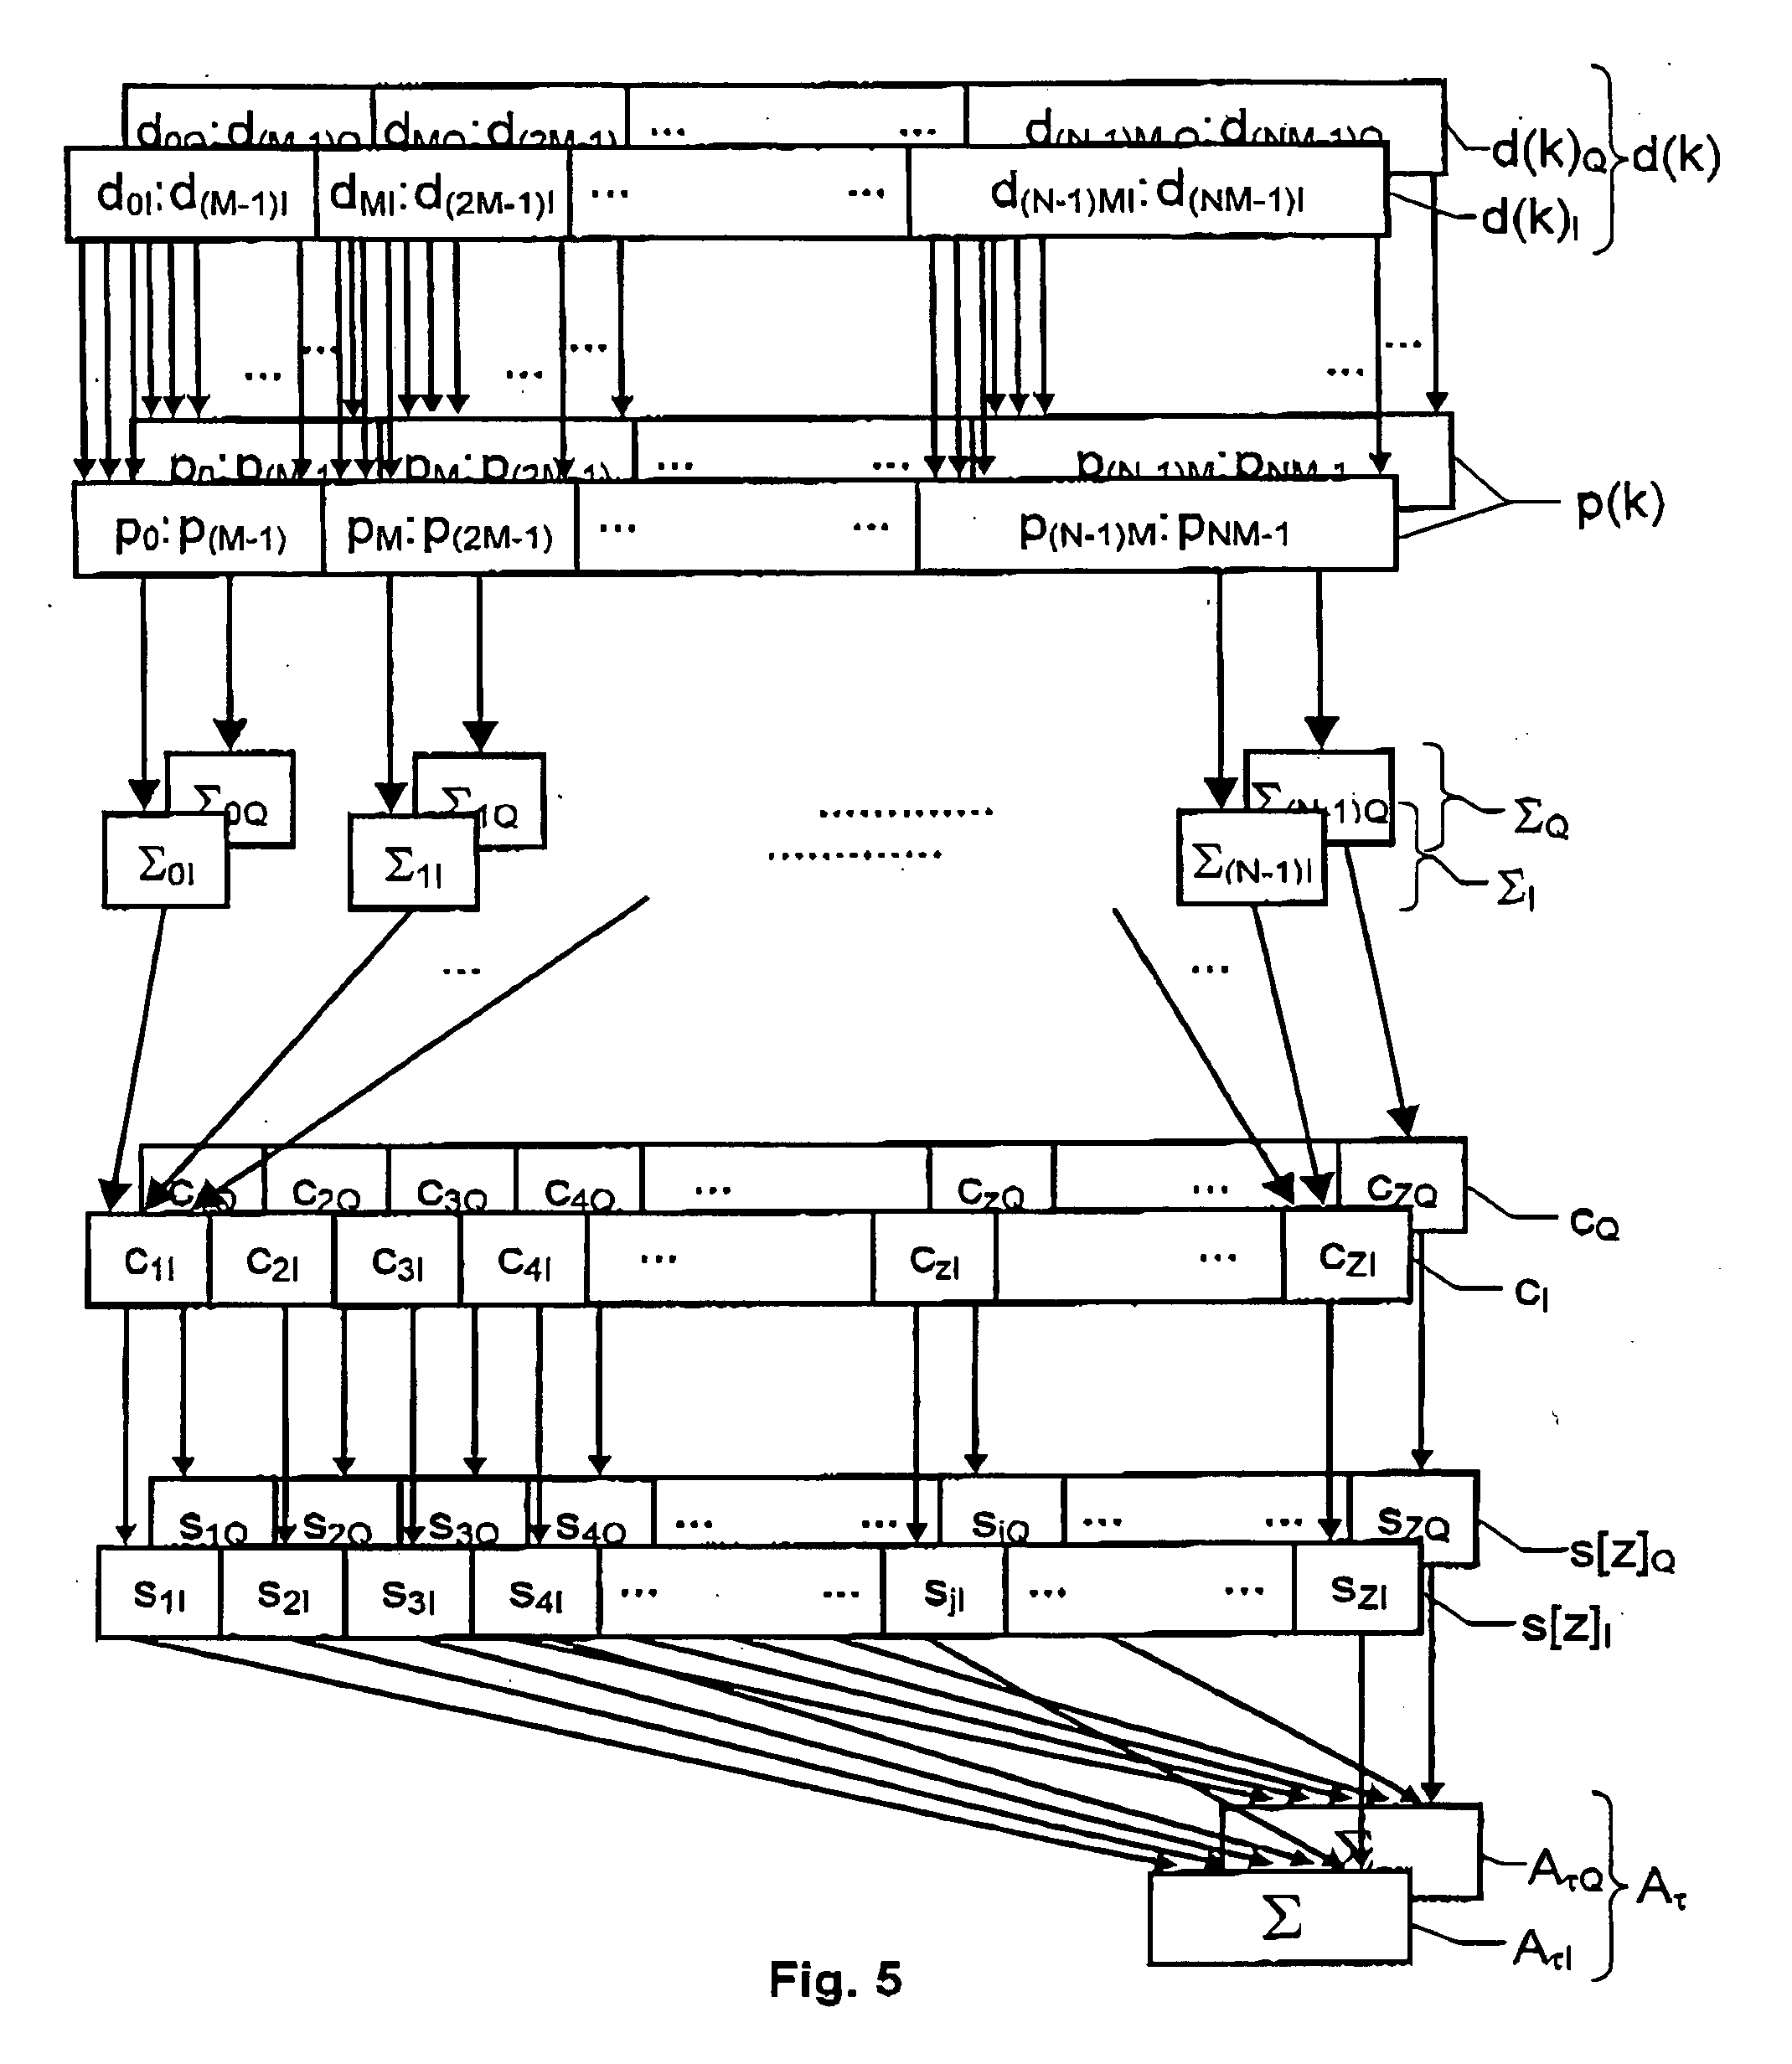
The present invention relates to production of a decoded signal (Aτ) based on in an incoming stream of data samples (d(k)) representing at least one downconverted digitized spread spectrum source signal. A number (NM) of the received data samples (d(k)) are divided into a first number (N) of data blocks, where each data block contains a second number (M) of samples. The second number (M) is an integer larger than or equal to two. Each of the data blocks is then correlated with a respective local code replica segment (p(k)) to produce a first number (N) of intermediate accumulation results (ΣI; ΣQ). To enable production of a decoded signal (Aτ) being compensated for a Doppler shift relative to a downconverting frequency for the least one spread spectrum source signal, the intermediate accumulation results (ΣI; ΣQ) are correlated with a carrier vector (s[z]I; s[zQ) expressing such a Doppler shift. However, according to the invention, the carrier vector (s[z]I; s[z]Q) only contains a target number (Z) of carrier values (s1I:sZI; s1Q:sZQ) (i.e. different carrier amplitude levels), where the target number (Z) is smaller than or equal to the first number (N). Normally, the target number (Z) is substantially smaller than the first number (N). Thus, depending on the first number (N) and the target number (Z) for the relevant carrier vector (s[Z]I; s[Z]Q), a number of consecutive results of the intermediate accumulation results (ΣI; ΣQ) are combined into a number of aggregated accumulation results (c1I:cZI; c1Q:cZQ), which is equal to the target number (Z). Thereafter, the aggregated accumulation results (c1I:cZI; c1Q:cZQ) are correlated with the carrier vector (s[Z]I; s[z]Q) to produce the decoded signal (Aτ). The invention is well adapted for implementation of software GNSS receivers.

Description

THE BACKGROUND OF THE INVENTION AND PRIOR ART [0001] The present invention relates generally to processing of spread spectrum signals by means of vector-based algorithms. More particularly the invention relates to a software correlator according to the preamble of claim 1, a spread spectrum signal receiver according to claim 9 and a method of producing a decoded signal according to the preamble of claim 13. The invention also relates to a computer program according to claim 21 and a computer readable medium according to claim 22. [0002] Spread spectrum transmission solutions are becoming increasingly important for instance in global navigation satellite systems (GNSS). Presently, the Global Positioning System (GPS; U.S. Government) is the dominating standard, however alternative standards exist and are expected to gain increased importance in the future. So far, the Galileo system (the European programme for global navigation services) and the Global Orbiting Navigation Satellite Sy...

Claims


Application Information

Patent Timeline
Patent Type & Authority Applications(United States)
IPC IPC(8): H04B1/00H04B1/707
CPCH04B1/707H04B1/7077H04L65/607H04B2201/7071H04B2201/70715H04B1/7095H04L65/70
Inventor STAHLBERG, CHRISTIANNORMARK, PER-LUDVIG
Owner QUALCOMM TECH INT
Learn More