Method and system for analysing tachometer and vibration data from an apparatus having one or more rotary components

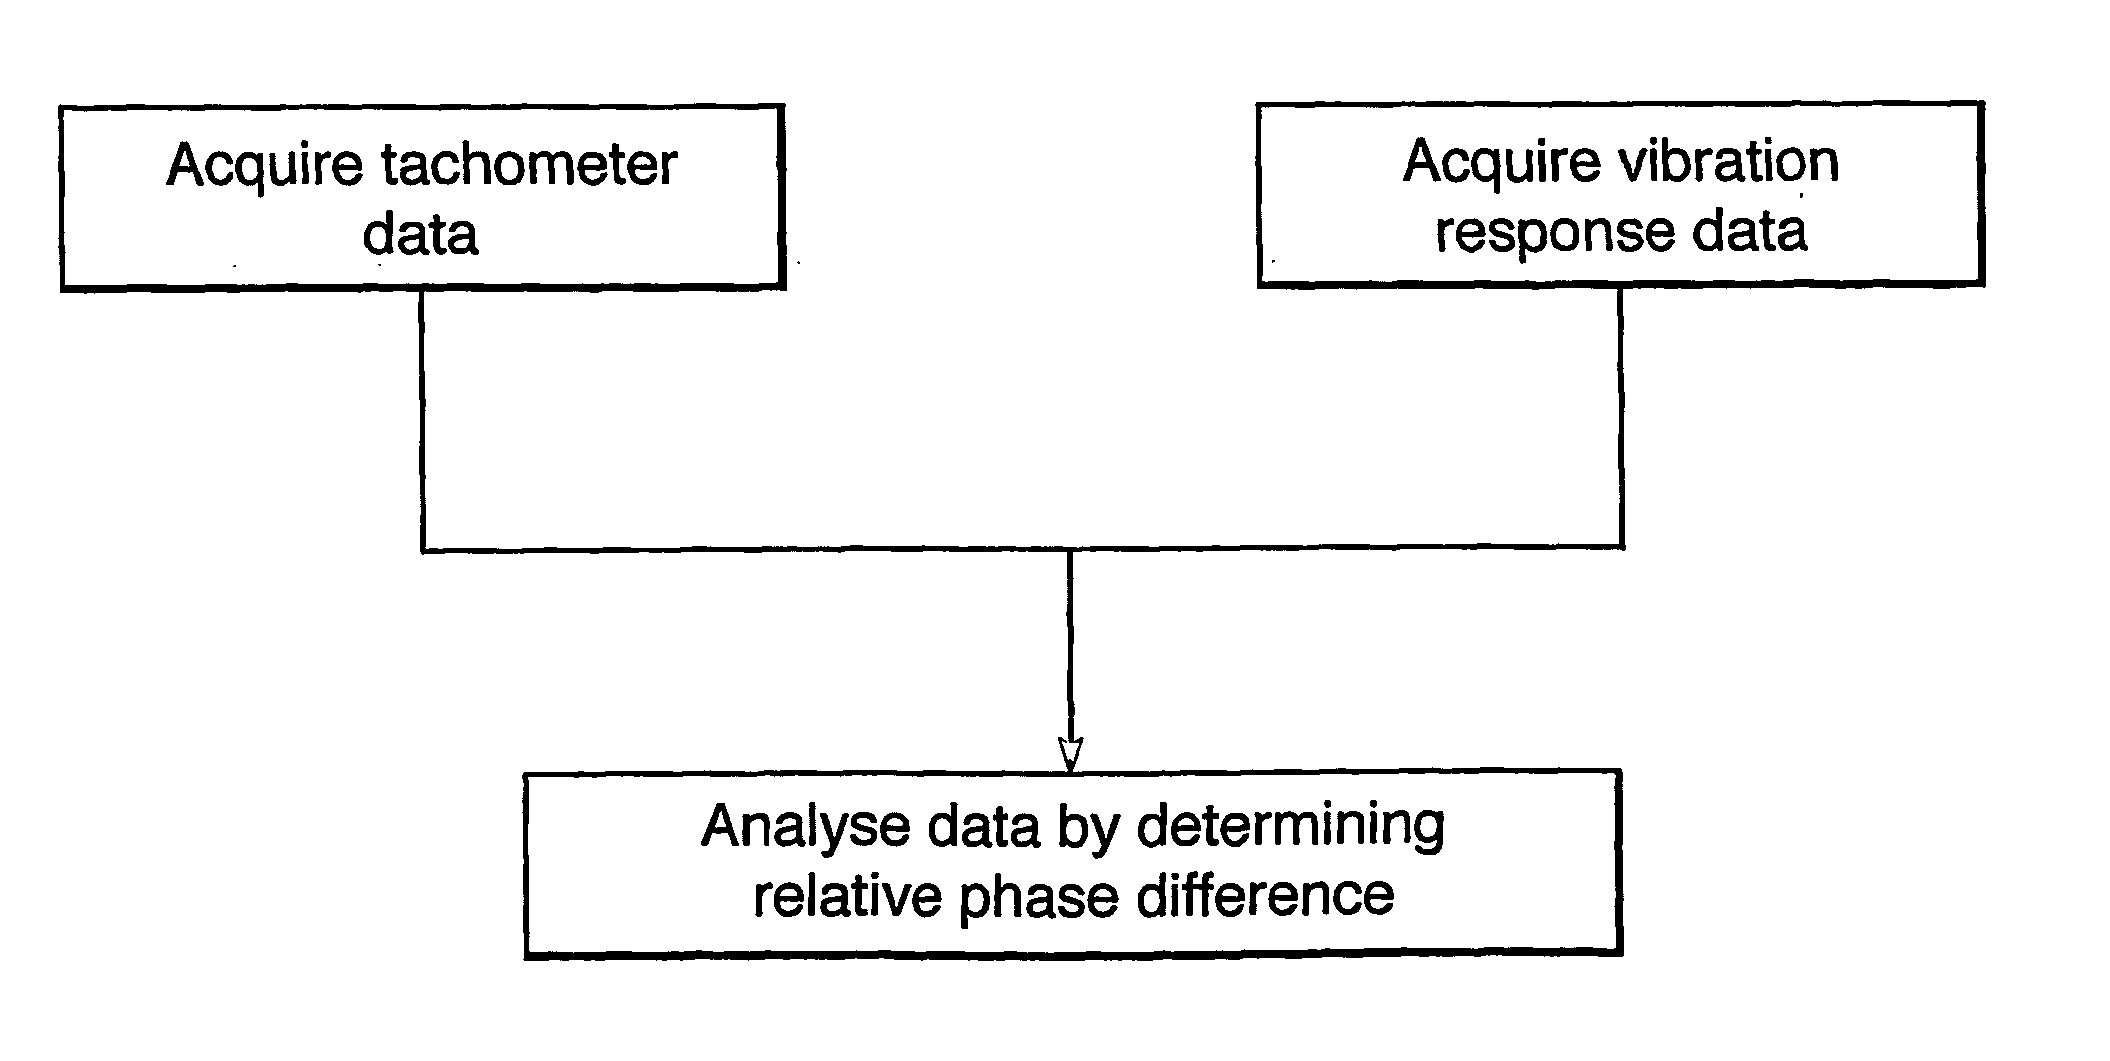
a technology of rotary components and vibration data, which is applied in the direction of vibration measurement in solids, testing/calibration of speed/acceleration/shock measurement devices, and amplifier modifications to reduce noise influence. the relative phase difference between a vibration response and the corresponding engine order may change, and the phase difference may chang

Active Publication Date: 2007-01-11
ROLLS ROYCE PLC +1
View PDF6 Cites 152 Cited by
  • Summary
  • Abstract
  • Description
  • Claims
  • Application Information

AI Technical Summary

Benefits of technology

[0027] Although the tachometer data can provide the absolute rotary position of the component, this is not essential and the tachometer data can provide merely the relative rotary position of the component instead. For example, the tachometer may measure rotary position using a multi-pole or other non-unique position indicator, or it may measure the rotary position of the output of a set of gears, which are in turn connected, at a known gearing ratio, to the component of interest. Thus the problem of fitting a dedicated tachometer to the component can be avoided. Particularly with respect to complicated machinery, such as gas turbine engines, this makes it much simpler to obtain relative phase information from a plurality of components, such as the different drive shafts of the engine.
[0029] When performing phase comparisons between signals in the frequency domain, a reasonable level of coherence must be achieved within the cross-transform. However, in the previously-mentioned conventional approach for determining the phase relationship between the forcing frequency of a rotary component and a vibration response in which a tachometer triggers the collection of vibration measurements, the tachometer signal typically takes the form of narrow pulses. These pulses do not generally contain sufficient energy to maintain adequate coherence. A possible solution would be to extend the duration of each pulse by increasing its mark-space ratio, but this is only practicable over certain speed ranges of the component. However, by performing the phase measurement in the time domain these difficulties are overcome. A further advantage is that relative phase differences can be measured on a number of independent components (e.g. shafts), together with component orders which can be fractional multiples of the reference component rotational speed or can be mechanically coupled e.g. via gear trains.
[0043] Preferably the centre of the (typically circular) area on the polar diagram encompassed by the perimeter is the average position of successive vectors r constructed from phase difference and vibration amplitude measurements at the same rotational speed. The radius may scale with the amount of scatter between the positions of the successive vectors r constructed from phase difference and vibration amplitude measurements (the amount of scatter may be quantified as the standard deviation, σ, of the different positions of the successive vectors). In this way, the method allows a statistically-based model of normal behaviour to be determined in situations where only intermittent operation occurs at each rotational speed. For example, an aero gas turbine engine under normal service conditions does not usually undergo smooth acceleration and deceleration manoeuvres between 0% and 100% speed, but rather spends varying amounts of time at different speeds. However, by applying the method of this aspect of the invention to each of a plurality of speeds, which preferably together cover the full range of speeds, a model of normal in service behaviour across the full range can be gradually accumulated without the need for dedicated acceleration and deceleration manoeuvres. A model of this type can be particularly useful for identifying slowly evolving engine abnormalities.

Problems solved by technology

However, the relative phase difference between a vibration response and the corresponding engine order may change as the engine speed varies, and particularly when the engine order traverses a resonance frequency of the engine.
Indeed, merely moving toward or away from such a resonance may cause the phase difference to change.
However, it relies on being able to fit an accurate, robust and dedicated tachometer to the component in question, something which is not always possible for complex components such as the shafts of multi-shaft gas turbine engines.
However, the method is reliant on the rotor turning at a single, fixed trigger speed, and a disadvantage of the method is that a suitable trigger speed has to be known in advance.

Method used


Image

  • Method and system for analysing tachometer and vibration data from an apparatus having one or more rotary components
  • Method and system for analysing tachometer and vibration data from an apparatus having one or more rotary components
  • Method and system for analysing tachometer and vibration data from an apparatus having one or more rotary components

Examples


Embodiment Construction

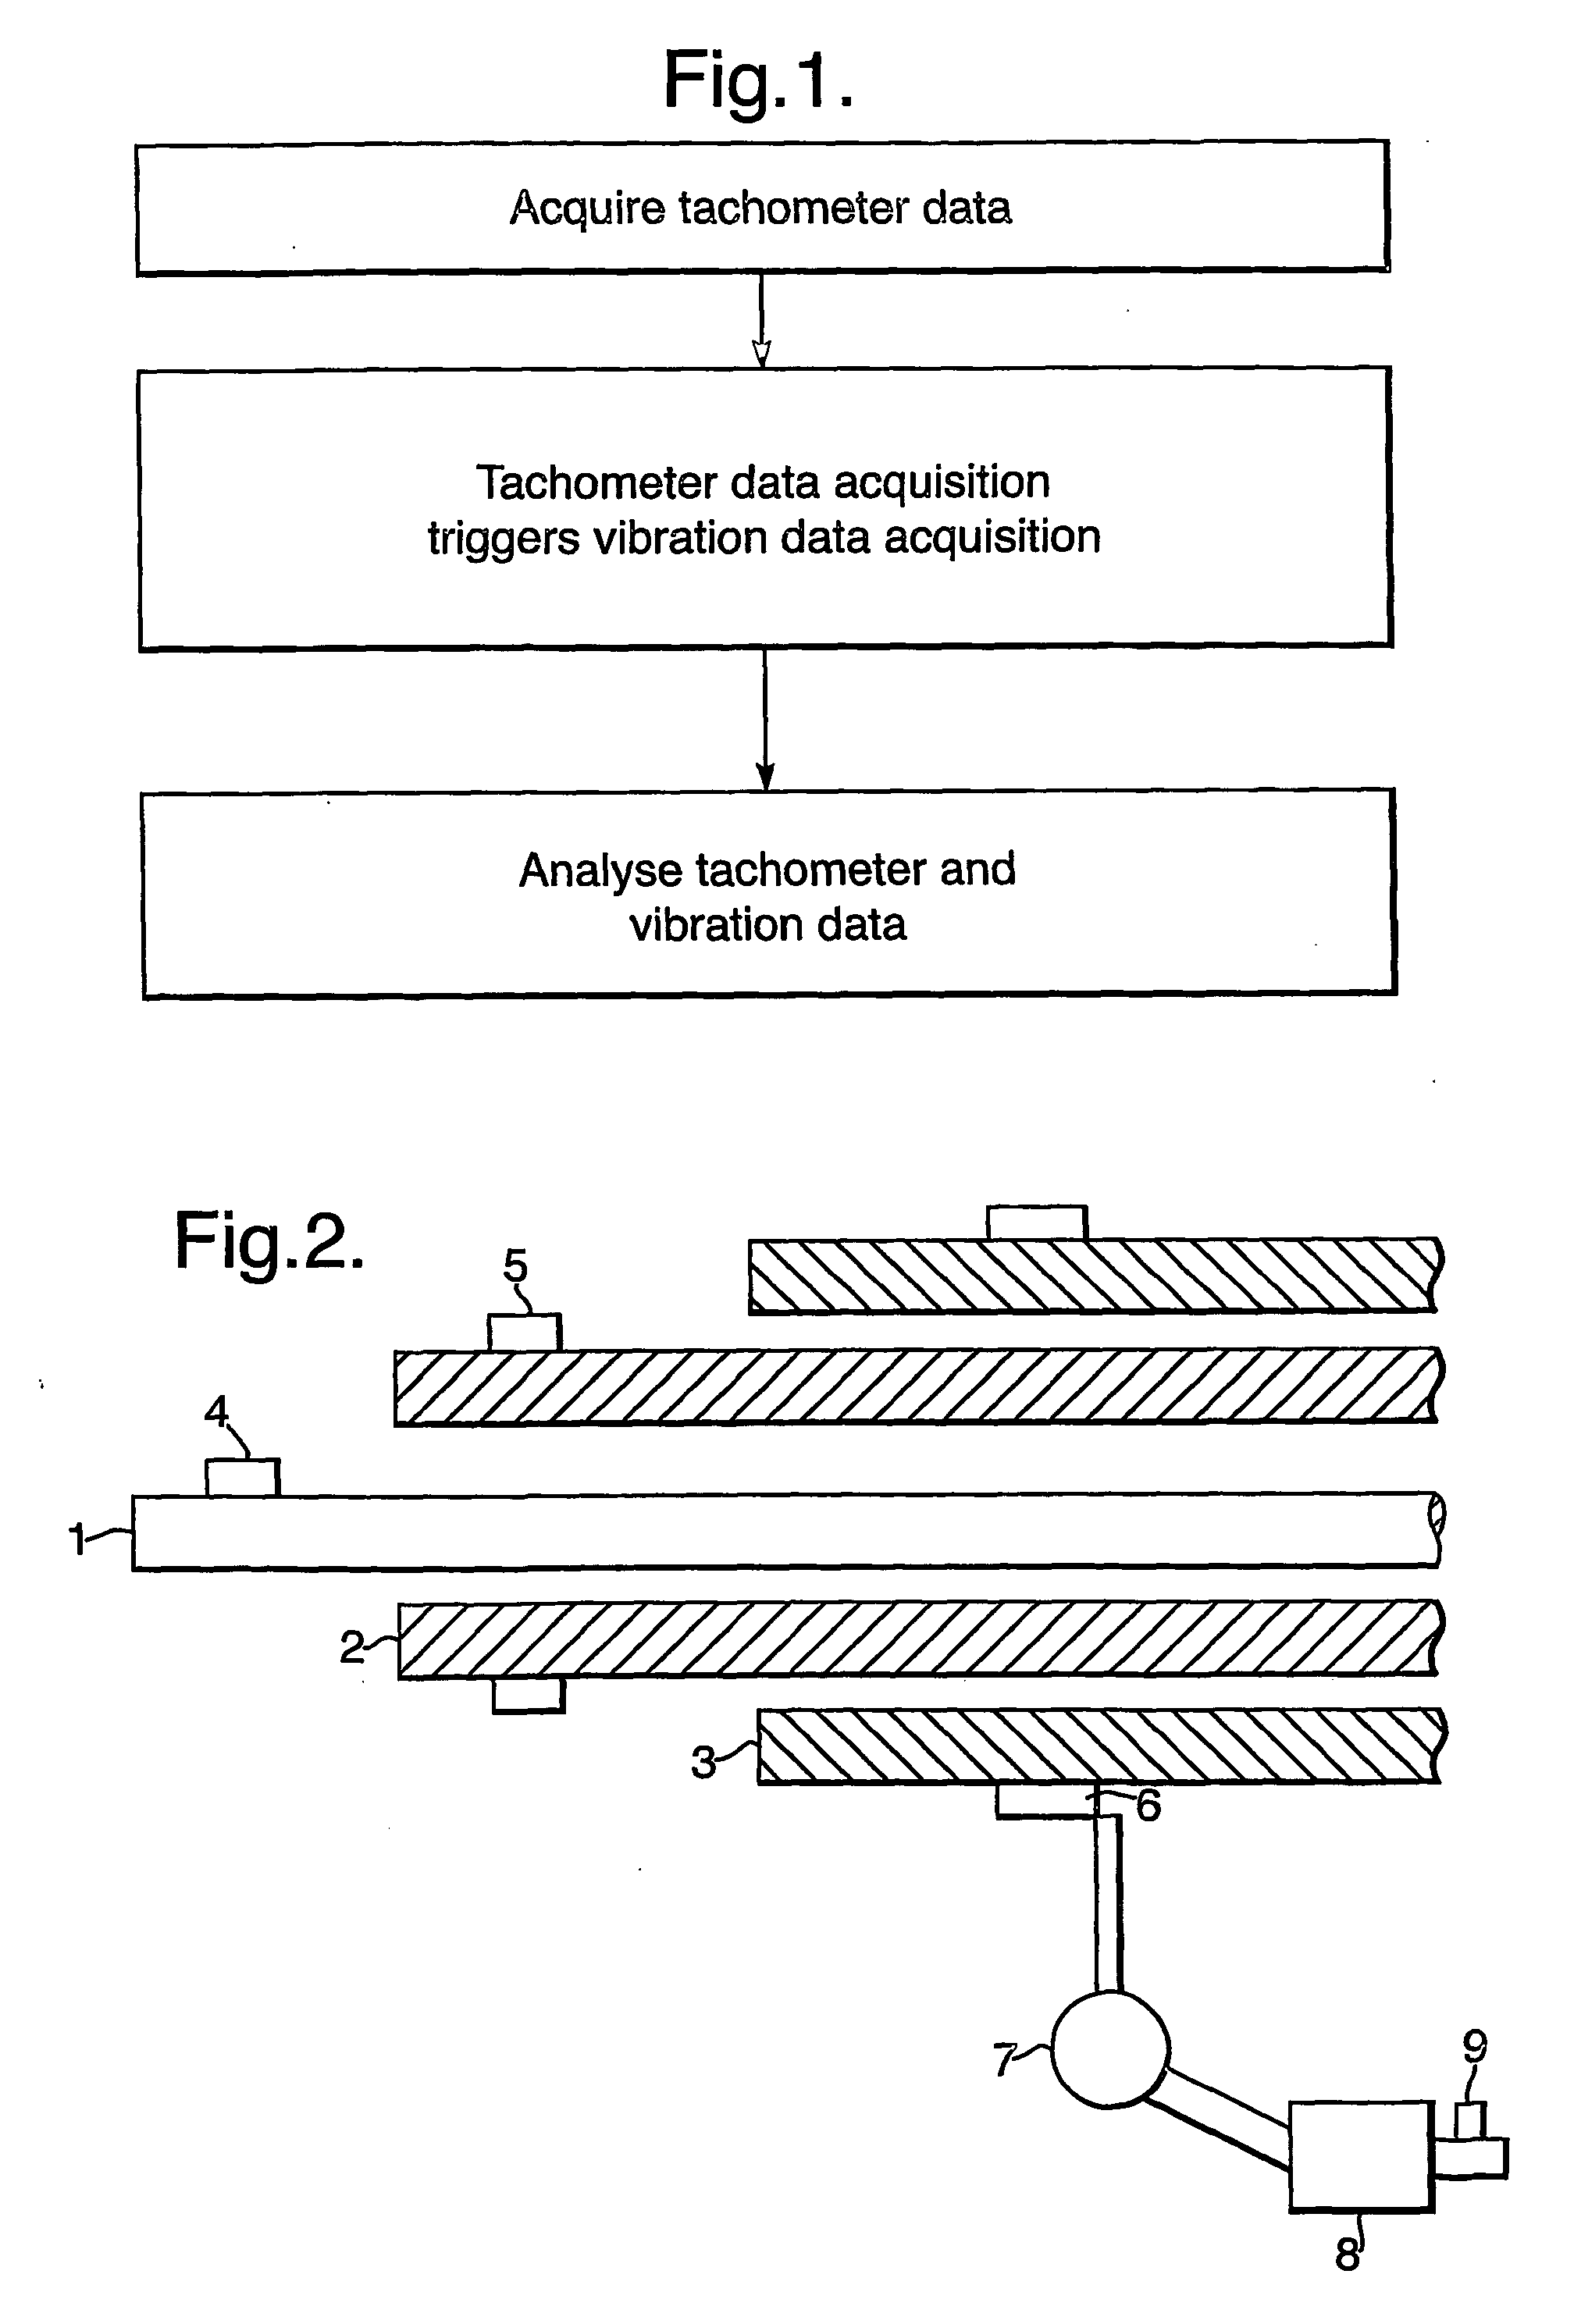
[0069]FIG. 2 shows a schematic longitudinal section of the three coaxial shafts of a Rolls-Royce multi-shaft gas turbine engine. Low pressure (LP) shaft 1 occupies the central position and is surrounded in turn by intermediate pressure (IP) shaft 2 and high pressure (HP) shaft 3.

[0070] LP shaft 1 carries a single pole tachometer 4 which is conventionally used for shaft balancing operations. IP shaft 2 carries a 60 pole tachometer 5 which is conventionally used for standard shaft speed measurements for engine control purposes. HP shaft 3 is connected via bevel gear 6 and step aside gearbox 7 to main (external) gear box 8, with a tachometer 9 connected to the output of the main gear box.

[0071] Tachometer 4 produces a signal pulse for each rotation of the LP shaft, and hence the rotational frequency (i.e. shaft speed) of the LP shaft can be determined from the inverse of the period between signal pulses. Tachometer 5 produces 60 signal pulses for each rotation of the IP shaft, and he...


PUM


Abstract

A method of analysing tachometer and vibration response data from an apparatus having one or more rotary components is provided. The method comprises the steps of: providing vibration response data and corresponding tachometer data from the apparatus for a period over which a rotary component of the apparatus varies in rotational speed, the tachometer data being for that component; repeatedly performing at intervals throughout the period the sub-steps of: determining a forcing frequency of the component from the tachometer data and a corresponding vibration response frequency of the apparatus from the vibration response data, comparing the forcing and vibration response frequencies to determine the relative phase difference between the frequencies, and determining the corresponding amplitude of the vibration response from the vibration response data; and plotting the relative phase differences and vibration amplitudes on a polar diagram. The plot trajectory is characteristic of the behaviour of the apparatus over the period.

Description

FIELD OF THE INVENTION [0001] This invention relates to a method and system for analysing tachometer and vibration data from an apparatus having one or more rotary components. BACKGROUND [0002] Apparatuses with rotary components, such as gas turbine engines, are subject to vibratory forces at frequencies which are related to the angular velocity of the respective component and hence engine speed. These frequencies are conventionally known as engine order forcing frequencies, each engine order corresponding to a rotational frequency of a particular component (or a fraction or harmonic of the fundamental frequency) and exerting a corresponding vibratory force on the engine. [0003] The forces may arise because e.g. an engine is out of balance on a particular shaft, stiffness irregularities in engine components, and (significantly in the case of gas turbine engines) aerodynamic interactions between the blades of the engine. [0004] At a given engine speed, a number of these engine orders...

Claims


Application Information

Patent Timeline
Patent Type & Authority Applications(United States)
IPC IPC(8): G01P21/00G01M1/14G01M99/00G01H1/00
CPCG01H1/003
Inventor KING, DENNIS M.ASTLEY, KEN R.TARASSENKO, LIONELANUZIS, PAULHAYTON, PAUL MICHAELKING, STEPHEN P.
Owner ROLLS ROYCE PLC
Why Eureka
Try Eureka