Eureka AIR delivers breakthrough ideas for toughest innovation challenges, trusted by R&D personnel around the world.

Method and system for estimating order scheduling rate and fill rate for configured-to-order business

a technology of order scheduling and filling rate, applied in the field of supply chain analysis, can solve the problems of affecting supply chain performance, difficult to estimate system performance, high cost, etc., and achieves the effects of improving performance, tightening capacity, and increasing uncertainty

Inactive Publication Date: 2007-01-11
IBM CORP
View PDF0 Cites 11 Cited by
  • Summary
  • Abstract
  • Description
  • Claims
  • Application Information

AI Technical Summary

Benefits of technology

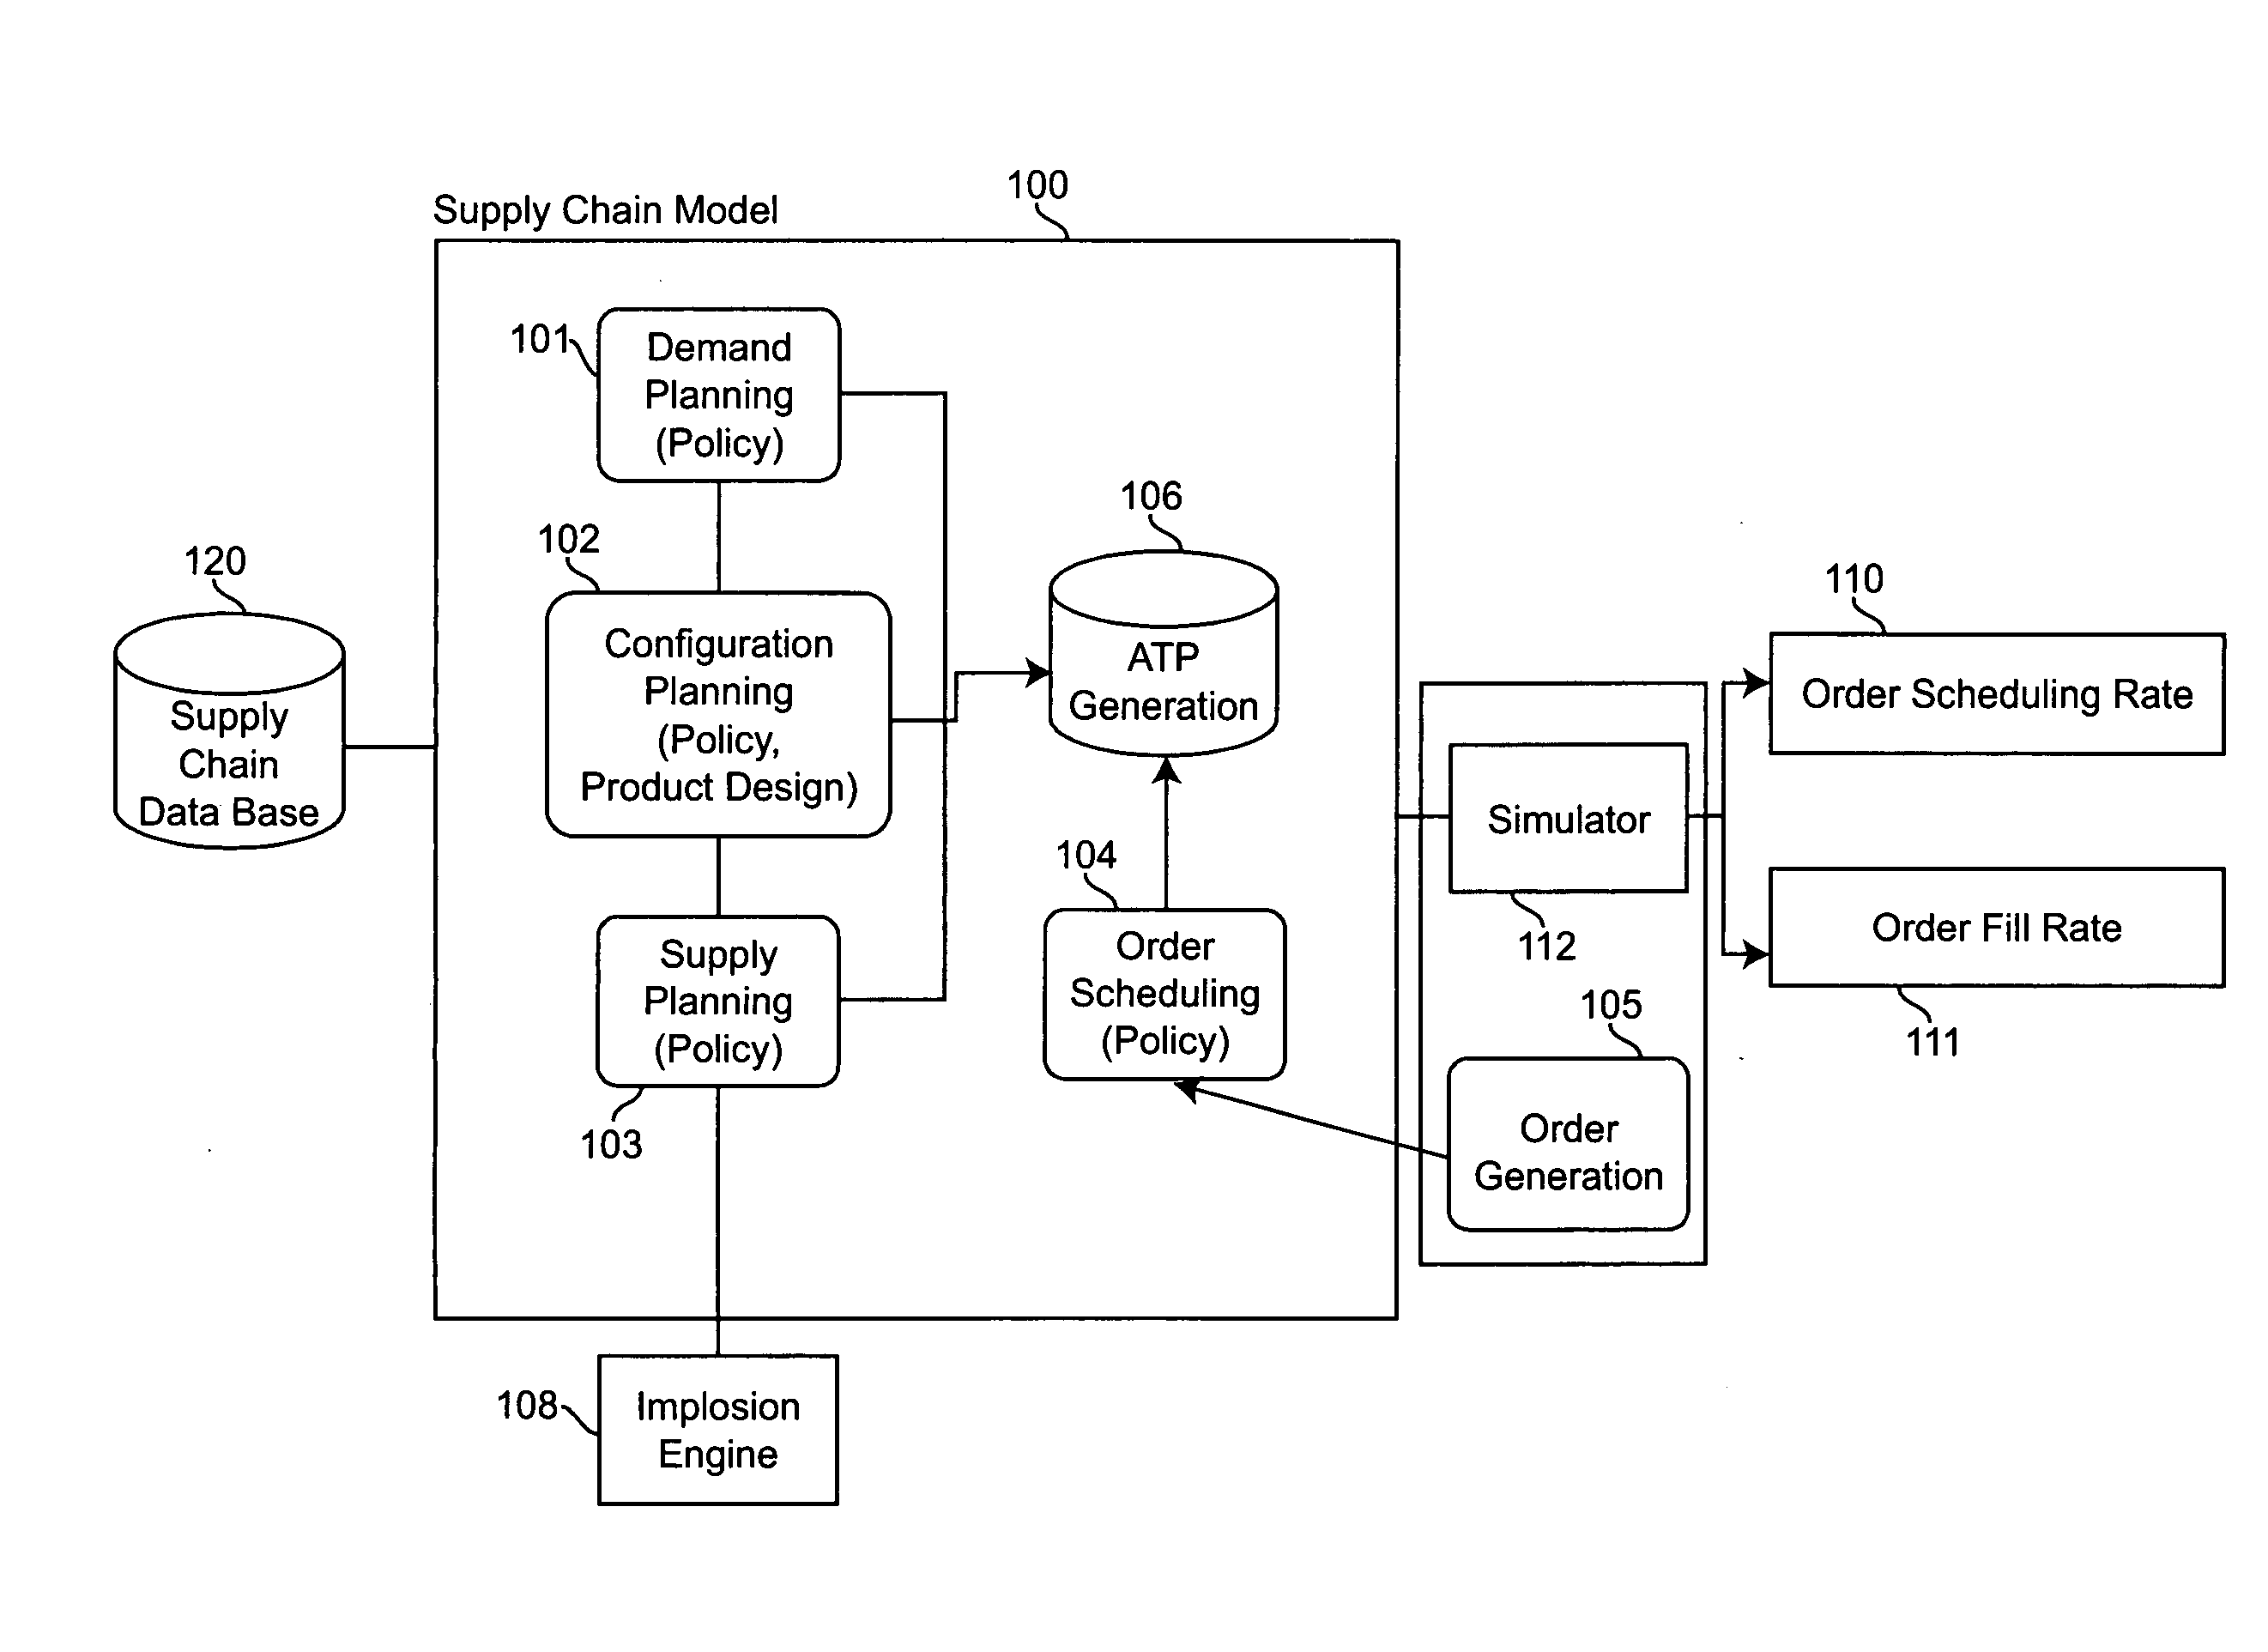
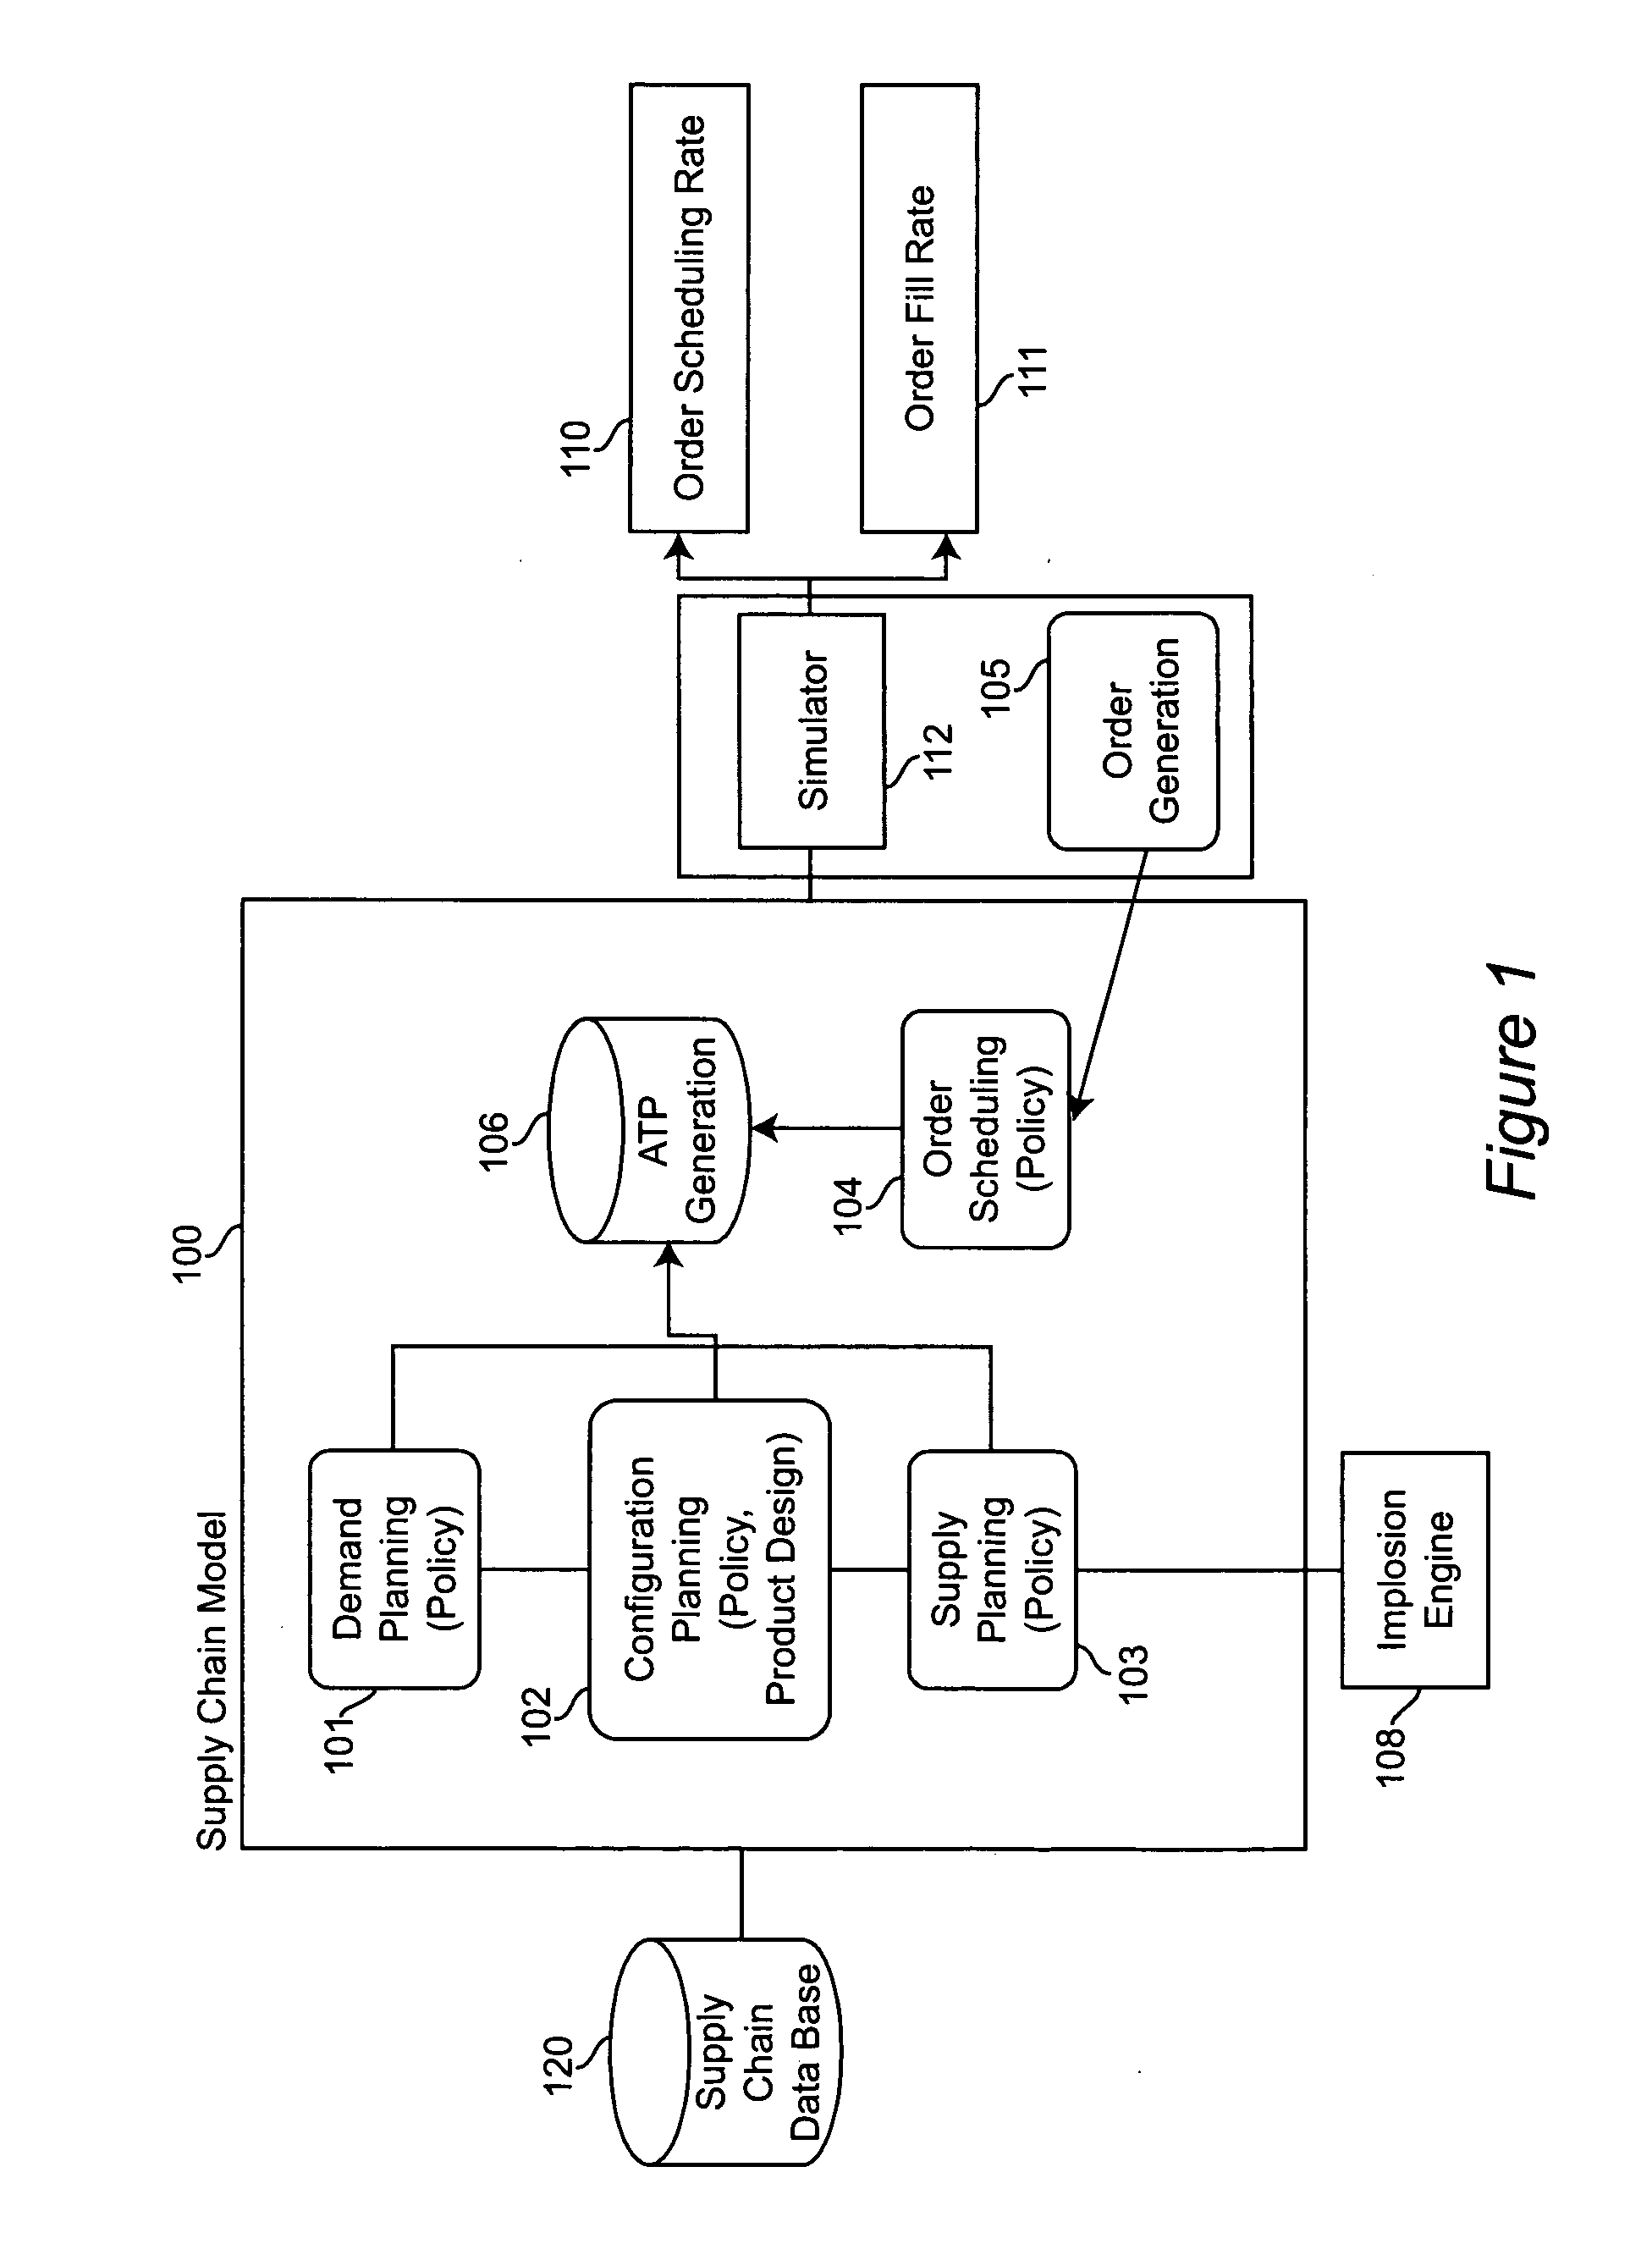
[0005] According to the invention, there is provided a method and system for estimating the performance of a supply chain's available-to-promise (ATP) and scheduling functions under various environmental and process assumptions. Using the system, it is possible to analyze various configurations of demand planning, ATP generation, and order scheduling for complex configured products. The system comprises various modules including a demand planning module, an order scheduling module, and a supply planning module. Each module can be reconfigured using various policies. The policies define business rules and system configurations which, together, specify the particular supply chain design that is to be analyzed. The system also contains a simulator, which simulates the supply chain performance based on the settings of the modules and other environmental factors such as demand uncertainty, order configuration uncertainty, supplier flexibility, supply capacity, and demand skew.
[0006] A key feature of the invention is that supply chain performance depends on how the individual polic

Problems solved by technology

However, in practice, the combined effect of various sub-processes affects the supply chain performance.
It is difficult to estimate the system performance by separately analyzing each sub-process in isolation.
But if the design is flawed, the time it takes to re-engineer can take months or years and is very costly (both in labor and in opportunity cost of poor supply chain practice).

Method used


Image

  • Method and system for estimating order scheduling rate and fill rate for configured-to-order business
  • Method and system for estimating order scheduling rate and fill rate for configured-to-order business
  • Method and system for estimating order scheduling rate and fill rate for configured-to-order business

Examples


Embodiment Construction

[0012]FIG. 1 is a block diagram illustrating the system which implements the method for estimating order scheduling rate and order fill rate for CTO (Configured-to-Order) business. The order scheduling rate here is defined as percentage of customer orders that are assigned and communicated scheduled ship dates. The customers typically request when they would like to receive the products that they are ordering. Depending on the availability of finished products and components, the scheduled ship date of the order is designated to be same as the customer requested date or later. The order scheduling rate reflects the percentage of customer orders that may not be automatically scheduled within certain scheduling horizon in the system. The order fill rate is defined here as the percentage of scheduled orders that are filled on the scheduled date.

[0013] The Supply Chain model 100 is a process of a CTO supply chain, where customer orders are processed and fulfilled. This model consists o...


PUM


Abstract

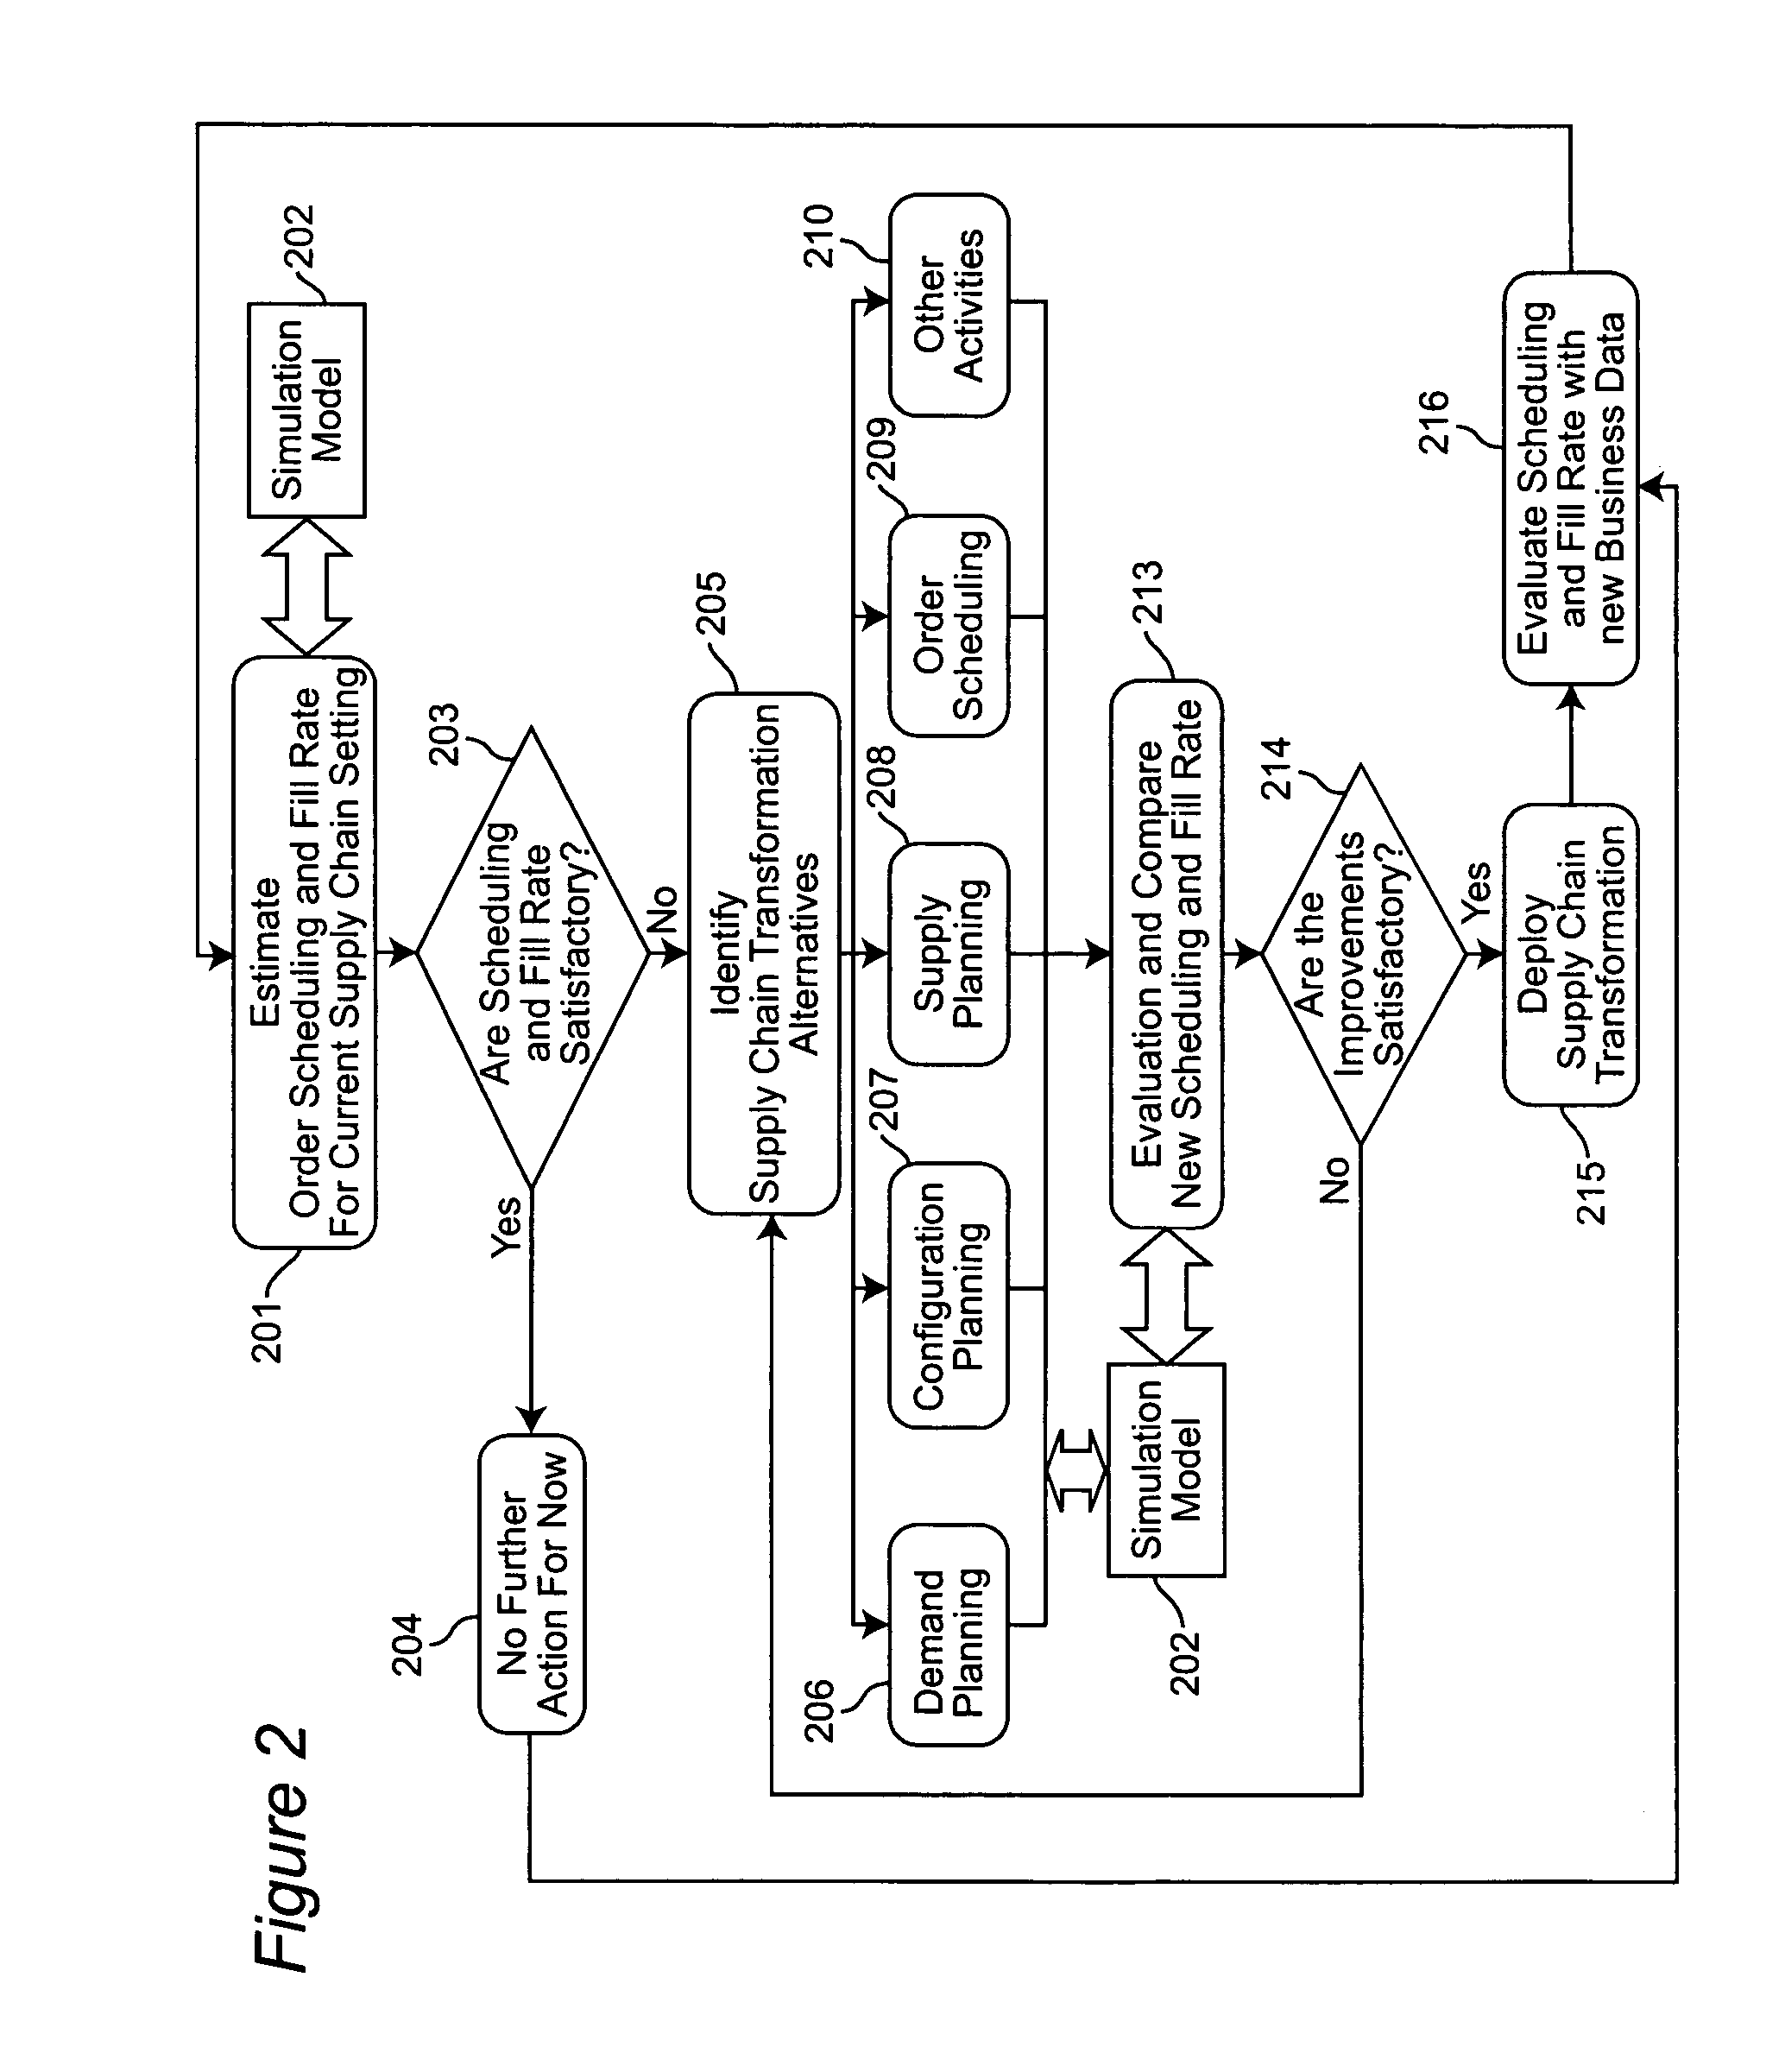
A system and method estimates performance of a supply chain's available-to-promise (ATP) and scheduling functions under various environmental and process assumptions. The supply chain's transformation alternatives are identified using a plurality of modules constituting a supply chain model and including a demand planning module, a configuration planning module, an order scheduling module and a supply planning module, each of said modules being reconfigurable using various policies, which policies, taken together, specify a particular supply chain design that is to be analyzed. A supply chain data base is accessed by the supply chain model to retrieve data elements that dictate appropriate policies within said plurality of modules. The supply chain performance is simulated based on settings of the modules and other environmental factors including demand uncertainty, order configuration uncertainty, supplier flexibility, supply capacity, and demand skew. Based on the simulation, scheduling and fill rate of new business settings are evaluated to determine if improvements to the supply chain are satisfactory.

Description

BACKGROUND OF THE INVENTION [0001] 1. Field of the Invention [0002] The present invention is generally related to supply chain analysis and, more particularly, to a method and system for estimating order scheduling rate and fill rate for configured-to-order business where both products and product recipes are forecasted. [0003] 2. Background Description [0004] Most supply chain performance analysis has been typically conducted within a sub-process, such as demand planning, supply planning or order scheduling, in isolation. However, in practice, the combined effect of various sub-processes affects the supply chain performance. It is difficult to estimate the system performance by separately analyzing each sub-process in isolation. For many companies, the only way to estimate the performance of new supply chain design is to put it in production and measure it from there. But if the design is flawed, the time it takes to re-engineer can take months or years and is very costly (both in ...

Claims


Application Information

Patent Timeline
IPC IPC(8): G06F19/00
CPCG06Q10/06
Inventor CHENG, FENGERVOLINA, THOMAS ROBERTGHOSH, SOUMYADIPGUPTA, BARUNLEE, YOUNG MIN
Owner IBM CORP
Why Eureka
Eureka Blog
Learn More