
System and method for optimizing drug therapy for the treatment of diseases

a drug therapy and disease technology, applied in the field of disease management, drug therapy, disease monitoring and pharmacogenomics, can solve the problems of reducing efficacy, affecting patients, and bacillus, and reducing the treatment effect of many patients, and reducing the treatment

Inactive Publication Date: 2008-01-10
GROEN KEES +1
View PDF1 Cites 14 Cited by
  • Summary
  • Abstract
  • Description
  • Claims
  • Application Information

AI Technical Summary

Benefits of technology

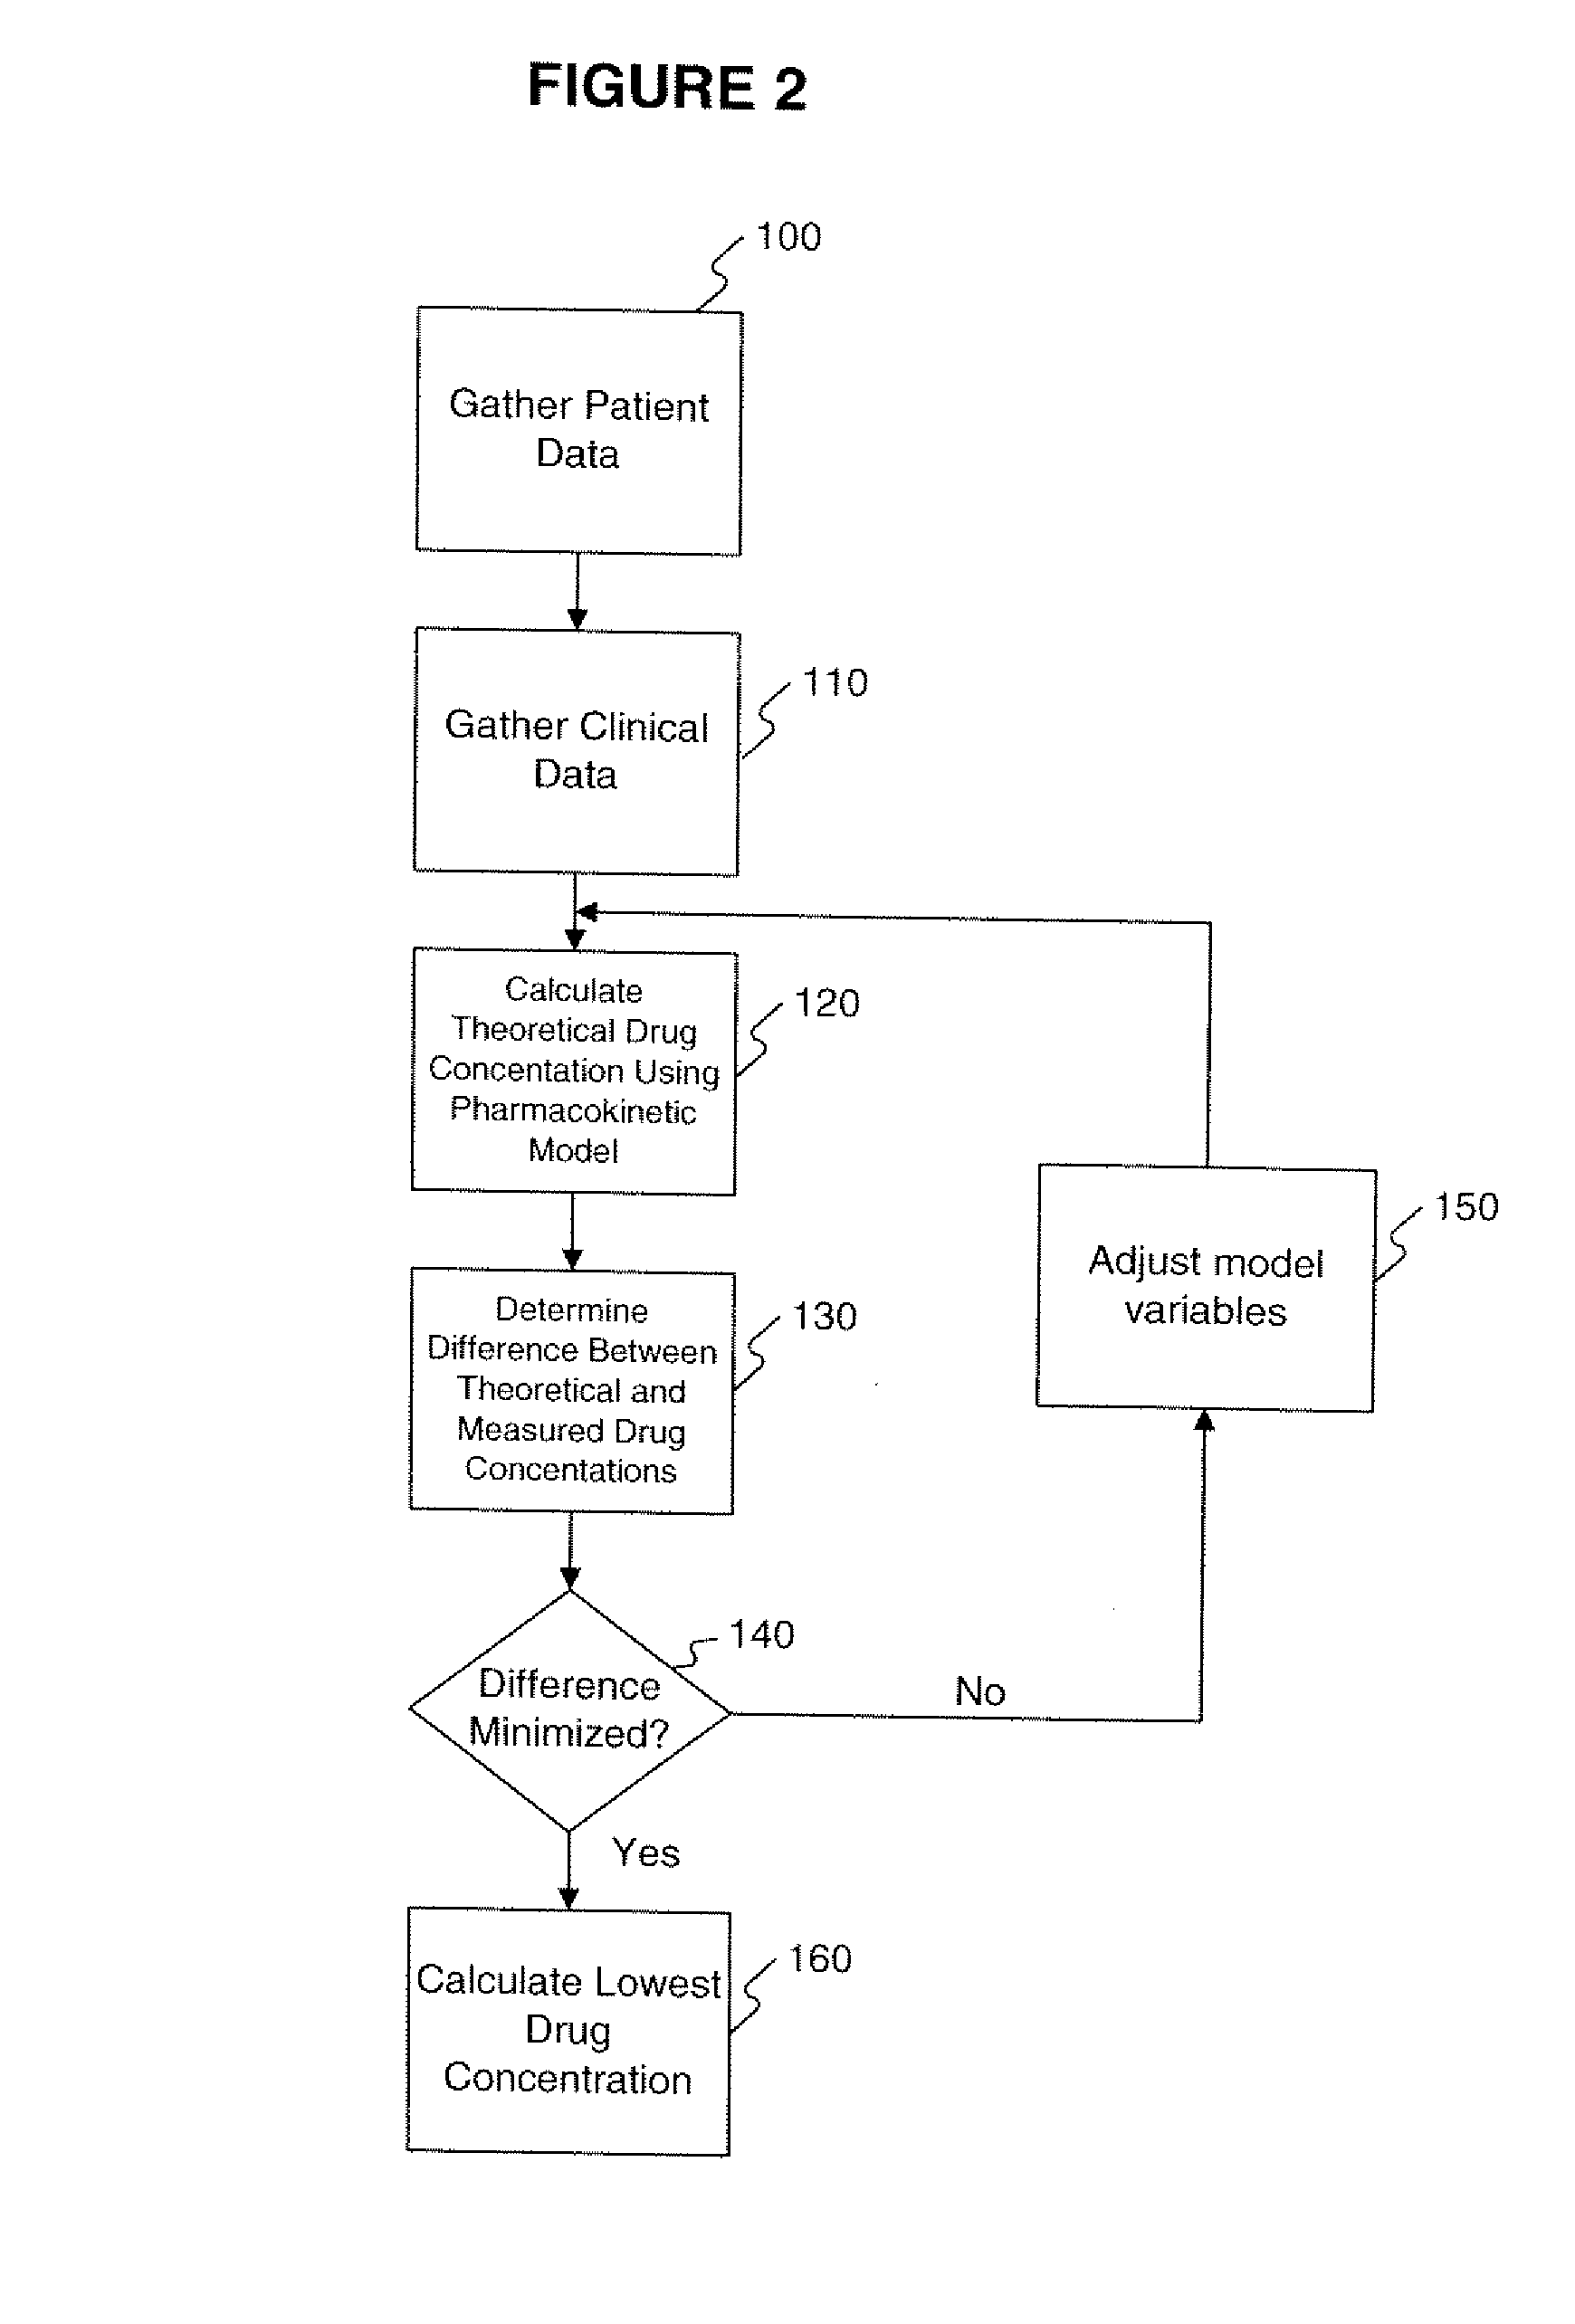
[0020] d) minimizing the difference by changing at least one parameter in the first population pharmacokinetic model in order to generate an optimized population pharmacokinetic model;

Problems solved by technology

Infectious agents including tuberculosis bacillus, human immunodificiency virus (HIV) and cell proliferative disorders have proven difficult to treat once affecting an individual.
However, many patients experience treatment failure, or reduced efficacy over time with many anti-cancer drugs and therapies.
Such treatment failure may be due to a variety of causes, such as development of resistance to the particular drug via mutation or other process, progression of disease requiring an altered dosage regimen, patient noncompliance, sub-optimal pharmacokinetics, toxicity to a drug etc.
However, besides being prohibitively invasive and time consuming, such an approach suffers from various other practical shortcomings.
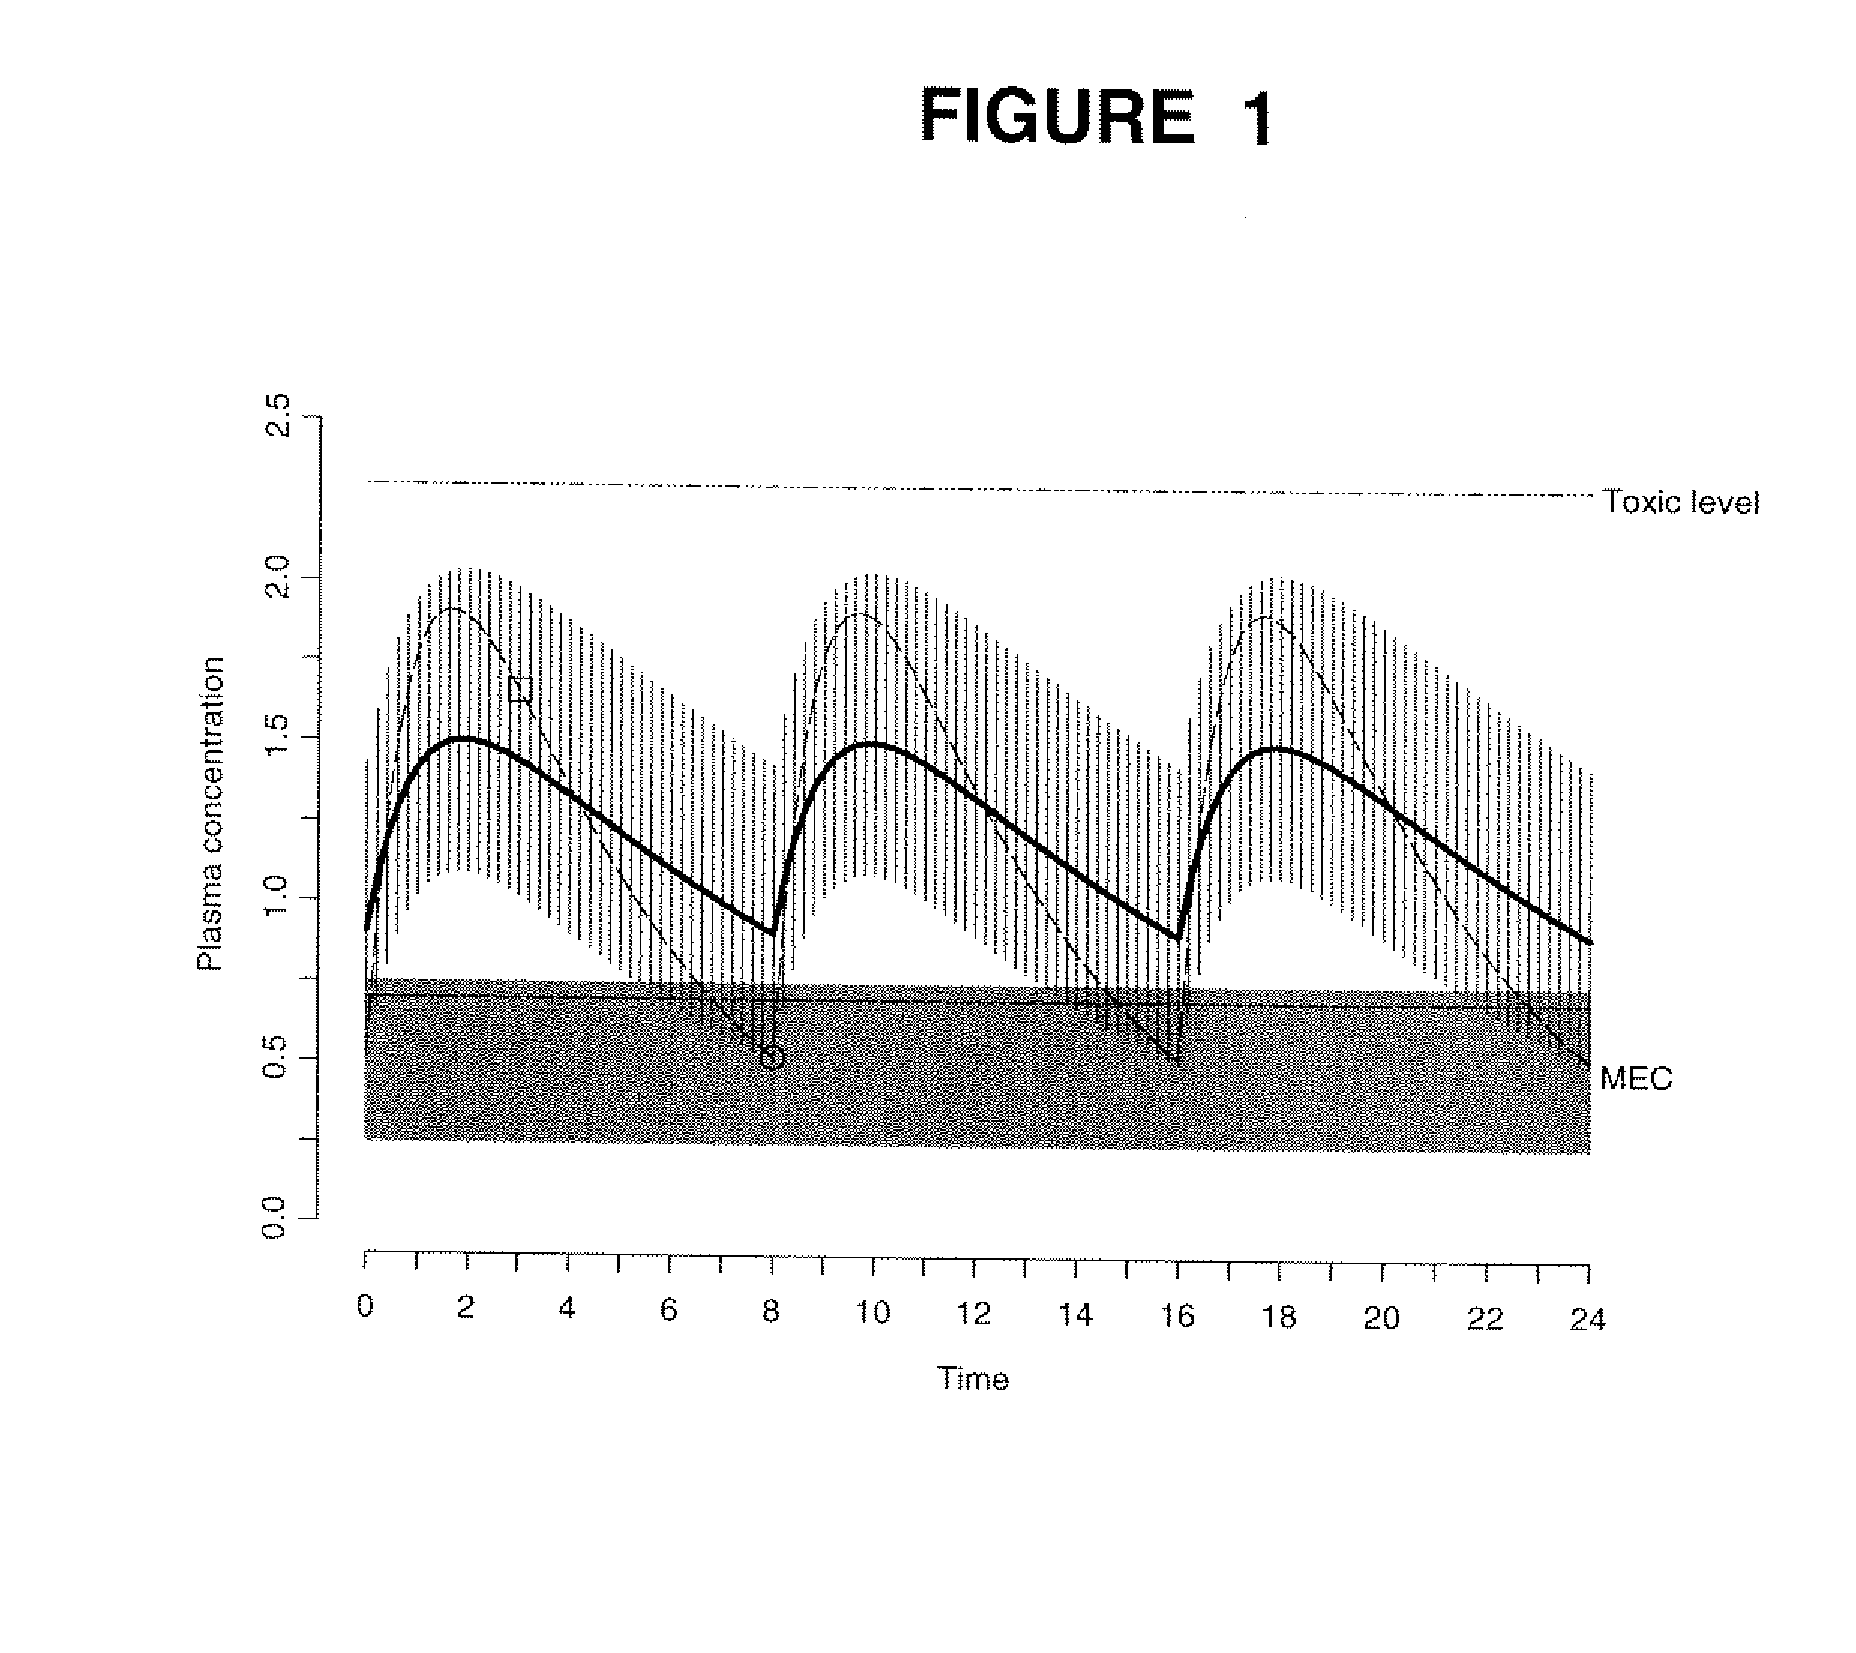
Since such actual, constant blood level monitoring of all administered drugs is nearly impossible, some interval between samplings is required; different drugs may be administered at different times post-administration, leading to irregular sampled drug disposition curves.
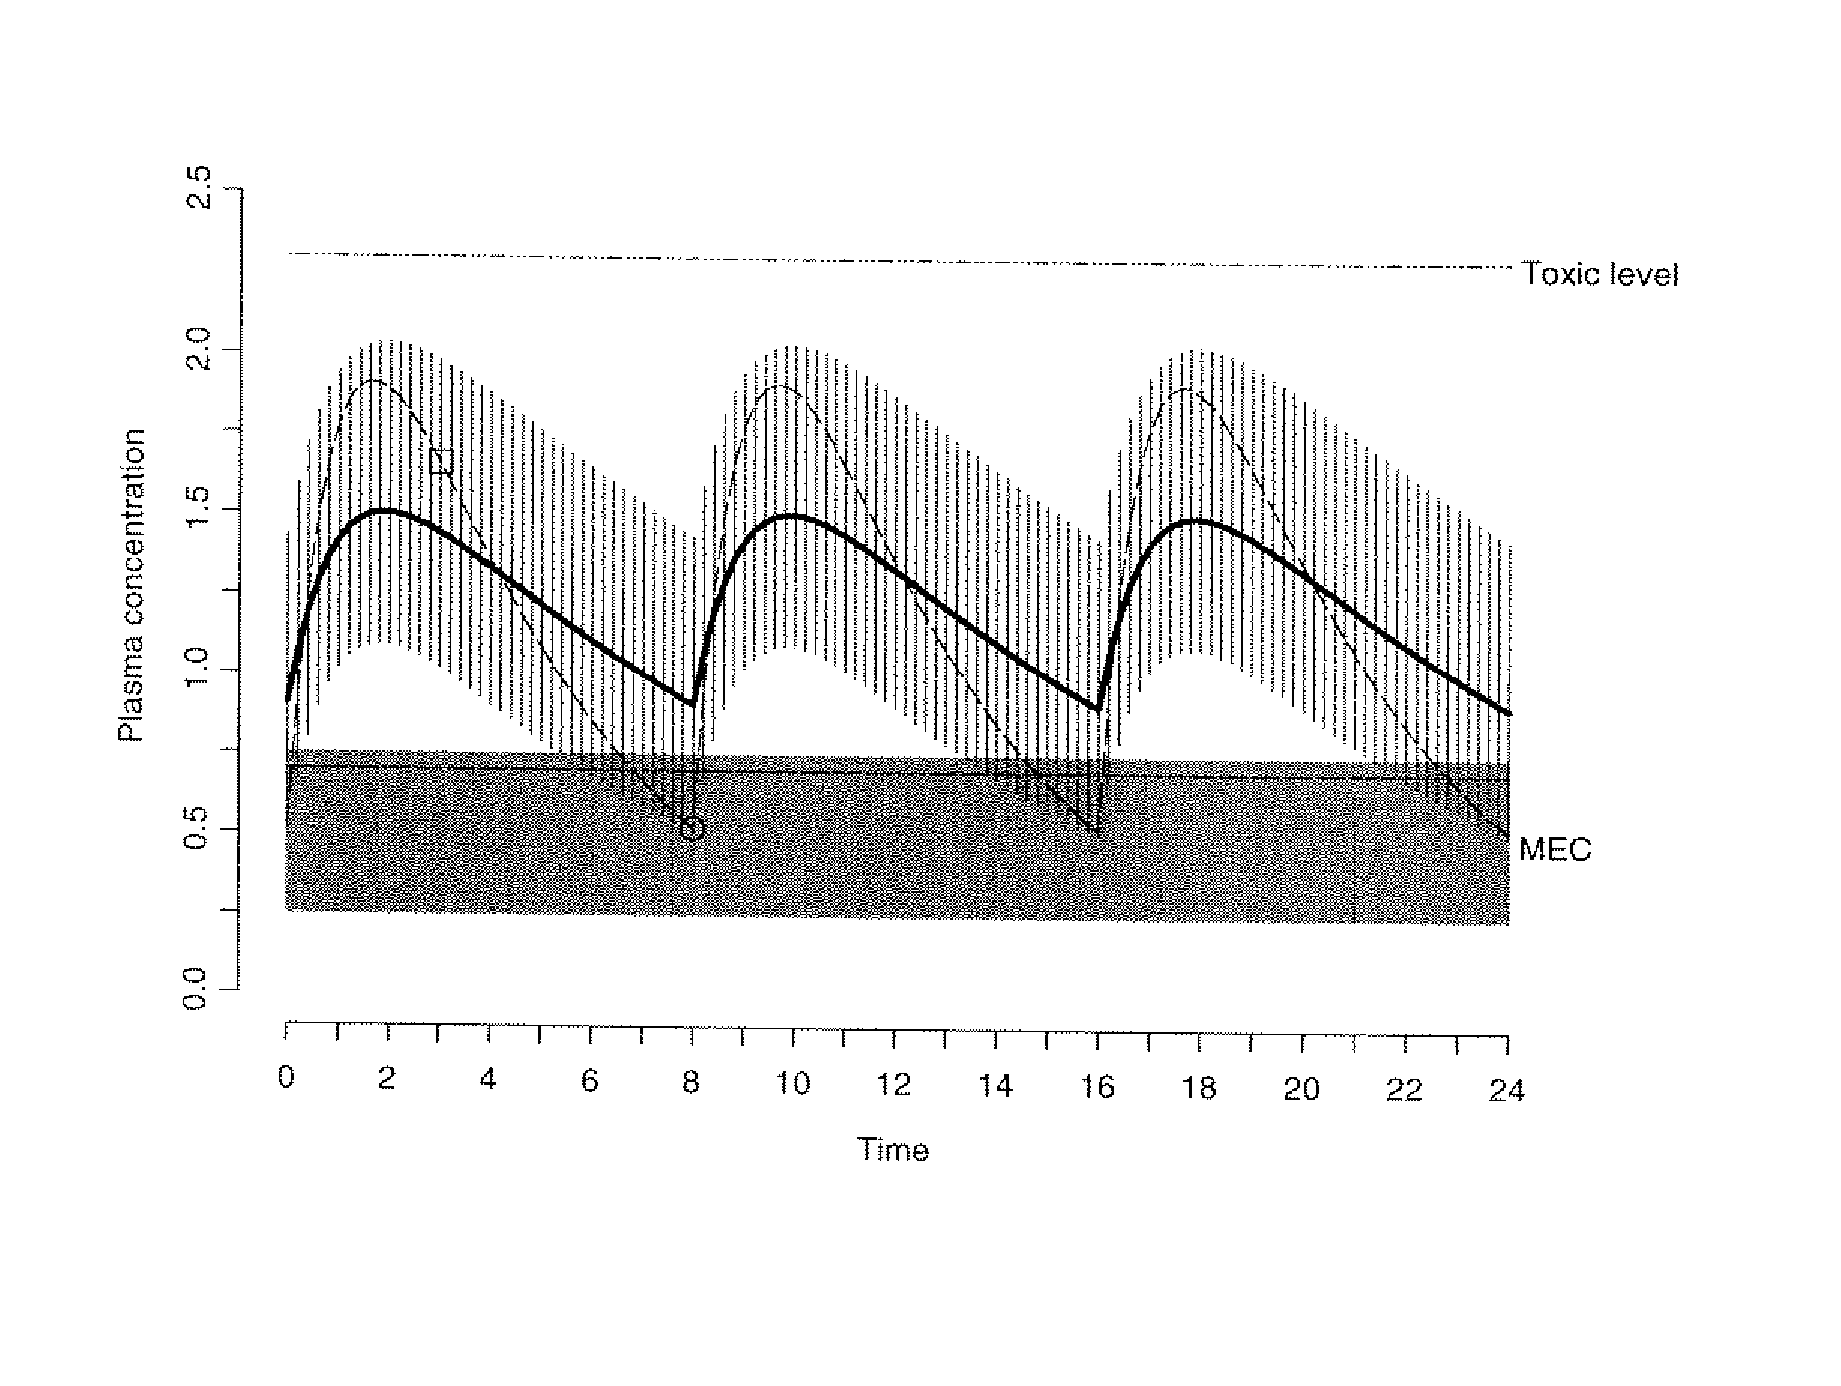
Often, for example, the higher the MEC of a particular drug in a particular patient, the lower the disease sensitivity is to that particular drug, resulting in lower likelihood of effective treatment.
Therefore current day therapeutic monitorning services based on the sole determination of the concentration of a drug in a sample of a patient may have limited value.
While the broad approach of population pharmacokinetics (loosely defined as the change in time of the concentration or nature of therapeutic agent(s) in groups of patients having similar characteristics) is a technique of long standing (see T. M. Ludden, J. Clin. Pharmacol. 28:1059-1062 (1988)), it fails to take into account a large amount of inter-, and even intra-, patient variability, ultimately contributing to therapy failure.
Another difficulty in the field of drug therapy is the development of drug resistance, which further stresses the need for individualized therapy.
Patients infected with such drug resistant strains are faced with ever narrowing therapeutic options.
HIV drug resistance is an ever increasing problem, with an estimated 10 to 20% of patients in developed countries failing to respond to drug therapy in the first year of treatment and developing resistance to at least one drug.
Mutations accumulate over time, resulting in malignancies recalcitrant to drug therapy.
Not only are tumor suppressor effects lost, but uncontrolled cell growth is promoted, leading to increased cell division frequency and concomitant increases in mutation rate, and thus further cancers.
Genotyping can be more rapid and less expensive than phenotyping, but may be more difficult to accurately interpret, due to the hundreds of mutations involved, for example, in HIV or p53 oncogenesis.
Although phenotypic testing is believed to be a more comprehensive and accurate assessment of therapy resistance than genotypic testing, phenotypic testing can take longer and may generally be more expensive than genotypic testing.
In addition, a therapy can be less effective or ineffective in an individual because of allelic variations at genes important for the action of a drug.
Though these methods provide information on either variable, the individual parameters allow limited managing patient treatment.
For instance, the drug level in the circulation will not provide evidence regarding the occurrence of resistance.
However, this group did neither use population based modeling, nor phenotypic data, nor the combination thereof to evaluate drug effectiveness.

Method used


Image

  • System and method for optimizing drug therapy for the treatment of diseases
  • System and method for optimizing drug therapy for the treatment of diseases
  • System and method for optimizing drug therapy for the treatment of diseases

Examples


example 1

Development of a Population Based Pharmacokinetic Method

General Outline of an Example Methodology

[0114] The data obtained from the quantitative analytical method, i.e., the actual drug circulatory concentration levels, were inputted into a mathematical model. This model was then used to predict the concentration of the drug in the circulation. This prediction, using the model, took into account the dosage, the time between intake and sampling, and other assumptions of the model, i.e., one compartment. Variables were introduced and / or adjusted to close the gap found between the predicted value and the value found through the quantitative analytical model. Validation of the model occurs by approximating these variables as closely as possible.

[0115] A classical population pharmacokinetic model may be used to predict an individual plasma concentration of a drug using a set of mathematical equations. One embodiment of the present invention utilized a one-compartment model with absorp...

example 2

Calculation of Inhibitory Quotient

[0123] Two studies demonstrate the use of the IQ or the NIQ for the protease inhibitors lopinavir and indinavir, respectively. In one study in 56 multiple PI-experienced, NNRTI-naïve patients treated with lopinavir plus efavirenz and 2 NRTIs, a correlation was found between the lopinavir IQ and the % of patients with viral load below 400 copies / mL at week 24. The % of patients with viral load below 400 copies / mL at week 24 was 70, 80, and 100% if the lopinavir IQ was 15, respectively. When using the lopinavir trough concentration alone, no correlation with virologic outcome was found.

[0124] In another study, a VIQ for indinavir >2 was the strongest predictor of virologic response over 48 weeks in patients who failed an indinavir-containing regimen.10. In this study, patients failing HAART (indinavir 800 mg tid plus 2 NRTIs) were switched to a ritonavir / indinavir 400 / 400 mg bid regimen, with continuation of the NRTIs during the first 3 weeks. There...

example 3

Normalized IQ

[0125] This example demonstrates how the normalized IQ may provide information regarding efficacy of a therapeutic agent. The first 2 columns of Table 2 represent the trough concentration and fold change of the virus for saquinavir. The next 2 columns represent what a pharmacokinetic model or resistance testing would advise based on these tests alone. The last 4 columns represent what a normalized IQ would advise based on 4 different scenarios for calculating normalized IQ: [0126] Method 1: threshold trough / mean fold change wild-type [0127] Method 2: threshold trough / cut-off fold change [0128] Method 3: mean trough in population / mean fold change wild-type

[0129] Method 4: mean trough in population / cut-off fold change

TABLE 2Trough inFoldPharmVirologicng / mLchangeModeladviceMethod 1Method 2Method 3Method 45002.0MaintainSensitive125%313%50%125%2001.0MaintainSensitive100%250%40%100%5005.0MaintainResistant 50%125%20% 50%10005.0MaintainResistant100%250%40%100%1000.5Increase...


PUM

PropertyMeasurementUnit
resistanceaaaaaaaaaa
concentrationaaaaaaaaaa
residual erroraaaaaaaaaa

Abstract

The present invention concerns the optimization of hiv-1 therapy using the combination of a bioanalytical method, population pharmacokinetic models and phenotypic resistance testing.

Description

CROSS REFERENCE TO RELATED APPLICATIONS [0001] This application claims priority of the benefits of the filing of U.S. application Ser. No. 10 / 380,413 filed Mar. 12, 2003, which is a National Stage Application under 35 U.S.C. § 371 of PCT / EP01 / 10971, filed Sep. 17, 2001; U.S. Provisional Application No. 60 / 279,674, filed Mar. 30, 2001; and European Patent Application No. 00 / 203200.1, filed on Sep. 15, 2000. The complete disclosures of the aforementioned related patent applications are hereby incorporated herein by reference for all purposes.FIELD OF THE INVENTION [0002] The present invention generally relates to the field of drug therapy, disease management, therapy monitoring and pharmacogenomics. In one embodiment, the present invention relates to systems and methods for designing or optimising a drug therapy for a patient in connection with the treatment of a disease. The present invention also provides an approach towards therapy design based on the integration of bio-analysis, p...

Claims


Application Information

Patent Timeline
Patent Type & Authority Applications(United States)
IPC IPC(8): C12Q1/70G01N33/50A61P31/18C12Q1/18G01N33/15G01N33/48G06F17/00G06F19/00
CPCG01N33/48A61P31/18G16H10/40G16H10/60G16H15/00G16H20/10G16H70/40G16H70/60G16H80/00
Inventor GROEN, KEESSTOFFELS, PAUL
Owner GROEN KEES
Learn More