Monitoring and mangement of distributing information systems

a distributed computer system and information system technology, applied in the field of distributed computer system management, can solve the problems of increasing complexity and difficulty in understanding and managing performance issues, affecting the performance of the system, and limiting the collection and monitoring of specific metrics on traditional management platforms, so as to avoid false association of performance degradation

Inactive Publication Date: 2008-01-24
REMASYS
View PDF5 Cites 65 Cited by
  • Summary
  • Abstract
  • Description
  • Claims
  • Application Information

AI Technical Summary

Benefits of technology

[0021] Accordingly, the present invention provides for the simultaneous measurement of the transaction performance of the system, along with monitoring of defined status and performance metrics, thereby enabling correlation between changes in performance and changes in the status of the system. Furthermore, the system model, and associated performance indicators, stored in the knowledge base may be specific to the system under management, and accordingly may define the most appropriate status data to be collected from the managed resources in order to monitor the status of the system, without imposing any generic object model or set of abstractions upon the managed resources. Additionally, the performance indicators may be adapted to the context of the system, so that they may be readily interpreted by non-experts as relating to particular aspects of system performance.
[0025] It is therefore particularly preferred that the transaction requests are generated from user terminals, for example through Remote Procedure Call (RPC) mechanisms or the like. Accordingly, factors affecting the overall performance of the system in response to the generated requests include those that are local to the user terminals. This enables the invention, in at least preferred embodiments, to avoid, for example, false indications of possible system problems when, in fact, a degradation in performance may be specific to a particular user terminal. It is also therefore possible for such problems to be correctly identified and localised.
[0030] In a particularly preferred embodiment, the knowledge base is hierarchically structured, having, for example, a tree structure, wherein the status data is represented at the lowest level of the hierarchy, and derived performance indicators are represented at higher levels, and with an increasing degree of abstraction. This capability of the knowledge base to provide free form abstraction of information allows users of the system to operate in terms that are familiar and meaningful to them, thereby reducing the time, effort and corresponding cost associated with traditional learning curves.
[0031] Accordingly, in preferred embodiments the method enables an operator to be provided with arbitrary subjective views of the system that are readily understood in relation to the user experience of system performance. No special expertise is therefore required to interpret the possibly esoteric status data provided by individual managed resources in order to assess how the system is performing.
[0036] Each performance indicator may also have its own associated resolution period that is appropriate to the nature of the particular performance indicator. For example, an accounting system having a monthly cycle of quiet and busy periods may have performance indicators with a one month resolution period. Accordingly, in preferred embodiments the method of the invention is able to account for cyclic variations in systems activity, so that predictable variations in status data, performance indicators and / or system performance will not be erroneously interpreted as being the result of system faults or other problems.
[0040] It is further preferred that normalised values of status data and performance indicators subsequently be determined, being the present values of the status data and performance indicators relative to the nominal values determined by the baseline measurement. Accordingly, a preferred embodiment of the invention has the advantage that non-expert operators will be able to see whether the status data and / or performance indicators are within normal operating ranges or not. It is also thereby possible to avoid falsely associating a performance degradation of the system with a relatively high (or relatively low) status data value or performance indicator, if the value is in fact within normal operating ranges.

Problems solved by technology

The performance issues become increasingly complex and difficult to understand and manage as the system and associated networks become larger and more complex.
For example, if an element of the system is not responding to service requests, or is responding slowly, it may be difficult to determine whether the fault is in the element itself, in a data communication link, or in another element of the system, such as an intermediate network device, shared service or memory object that may be affecting the ability of the system element to receive and / or respond to requests.
While known management platforms are useful in enabling networks and information systems to be monitored, and sources of possible problems to be identified, there are nonetheless a number of problems associated with their installation and operation.
Accordingly, traditional management platforms are limited to the collection and monitoring of a specific set of metrics of the managed resources, and constrained to managing the resources only of those elements within which suitable management agents have been installed.
It is therefore not usually possible for the management system to adapt to changes to the architecture of distributed system or to monitor components outside the system under the control of a system operator without the installation of further management agents.
This can be a significant limitation, since the system performance experienced by an end user may be affected by the performance of shared network services, such as Domain Name Services (DNS), that may be provided by servers that are located outside the control of the operator of a particular information service.
Known management platforms do not provide performance metrics that are specific to particular information services, and that are intuitively meaningful to users or non-expert operators of information systems.
In many cases, if an alert is generated by an event within the system, it may be difficult to relate the source of the alarm to any degradation in system performance that is experienced by end users.
Conversely, end users may experience degradation in system performance, resulting in complaints, or calls to a help desk, that may not be readily associated with any specific change in the available metrics, or any alerts that may have been raised.
Accordingly, previous attempts to automate the prediction, detection and correction of causes of performance degradation have been largely unsuccessful, resulting in erroneous outcomes including false identification of problems where no degradation in user performance is experienced, and / or failures to identify causes of performance degradation that is experienced by end users.
Furthermore, when users do report faults or degradation in system performance, there may be a delay between the time at which the performance problems are experienced, and the time at which they are ultimately reported to a system manager.
It may therefore be difficult to precisely pinpoint the time at which the performance problems occurred or commenced, and it may therefore be difficult to associate the performance problems with specific events, or changes in the metrics of the managed resources in the system.

Method used


Image

  • Monitoring and mangement of distributing information systems
  • Monitoring and mangement of distributing information systems
  • Monitoring and mangement of distributing information systems

Examples


Embodiment Construction

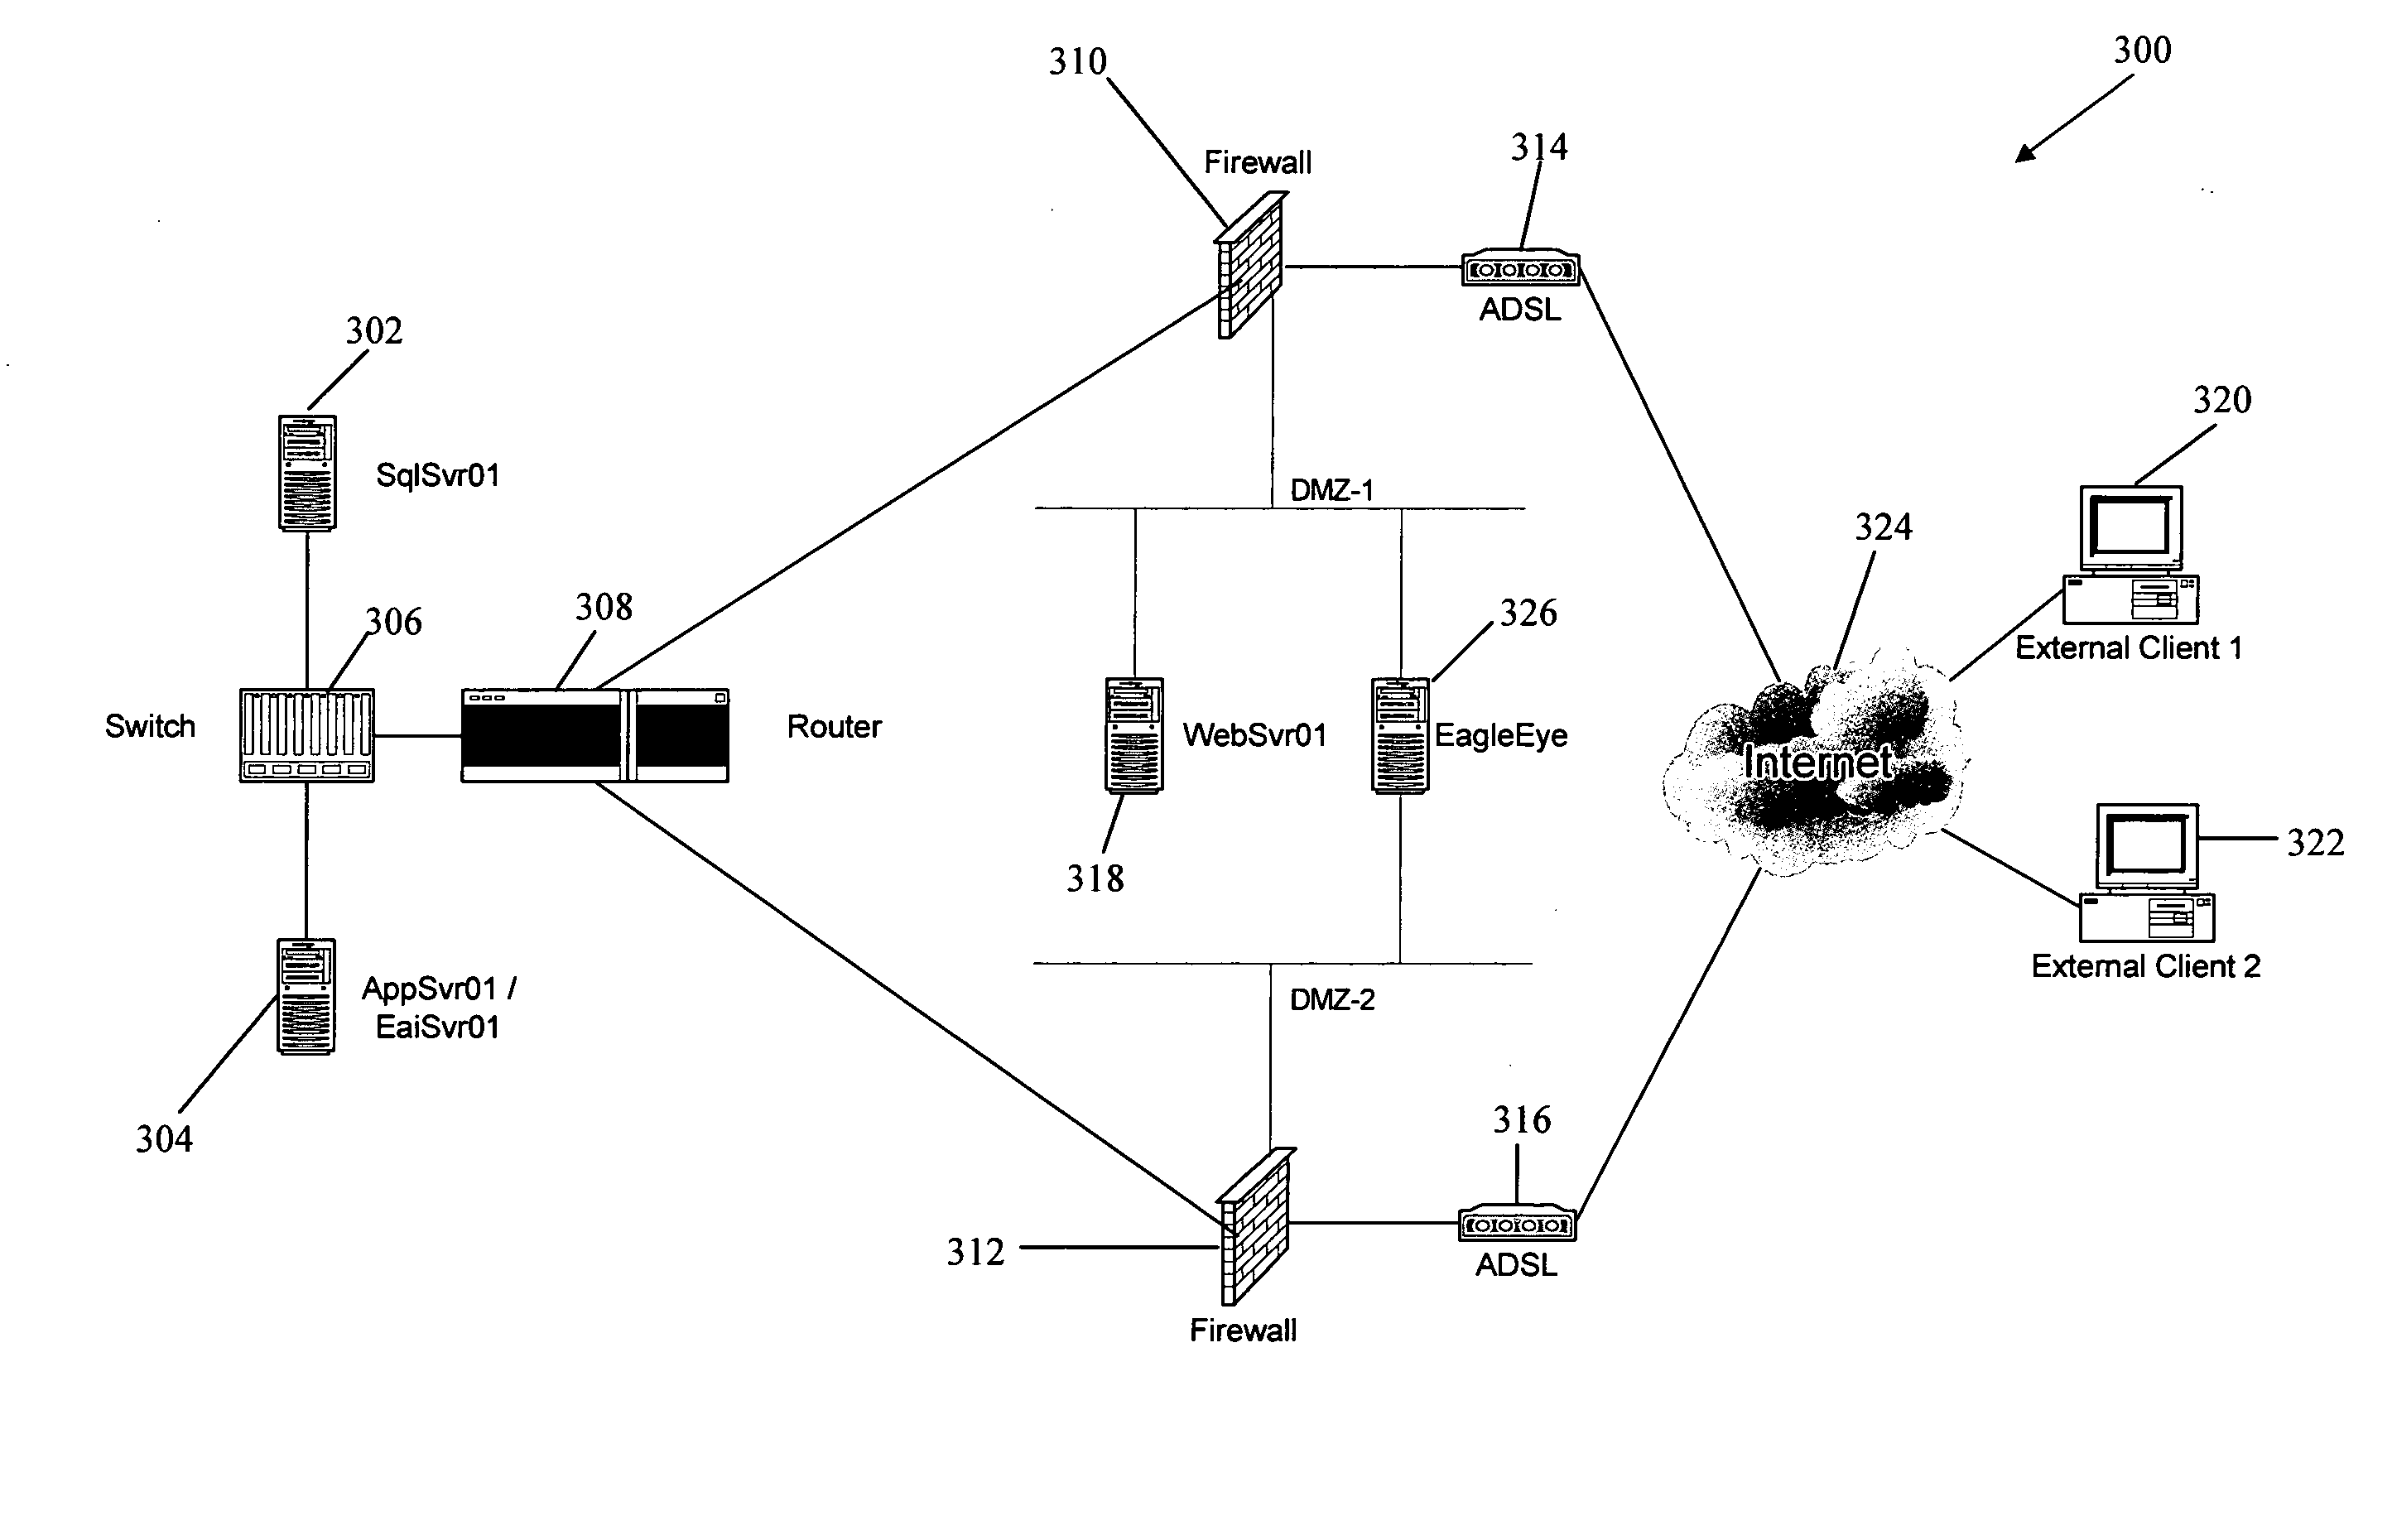
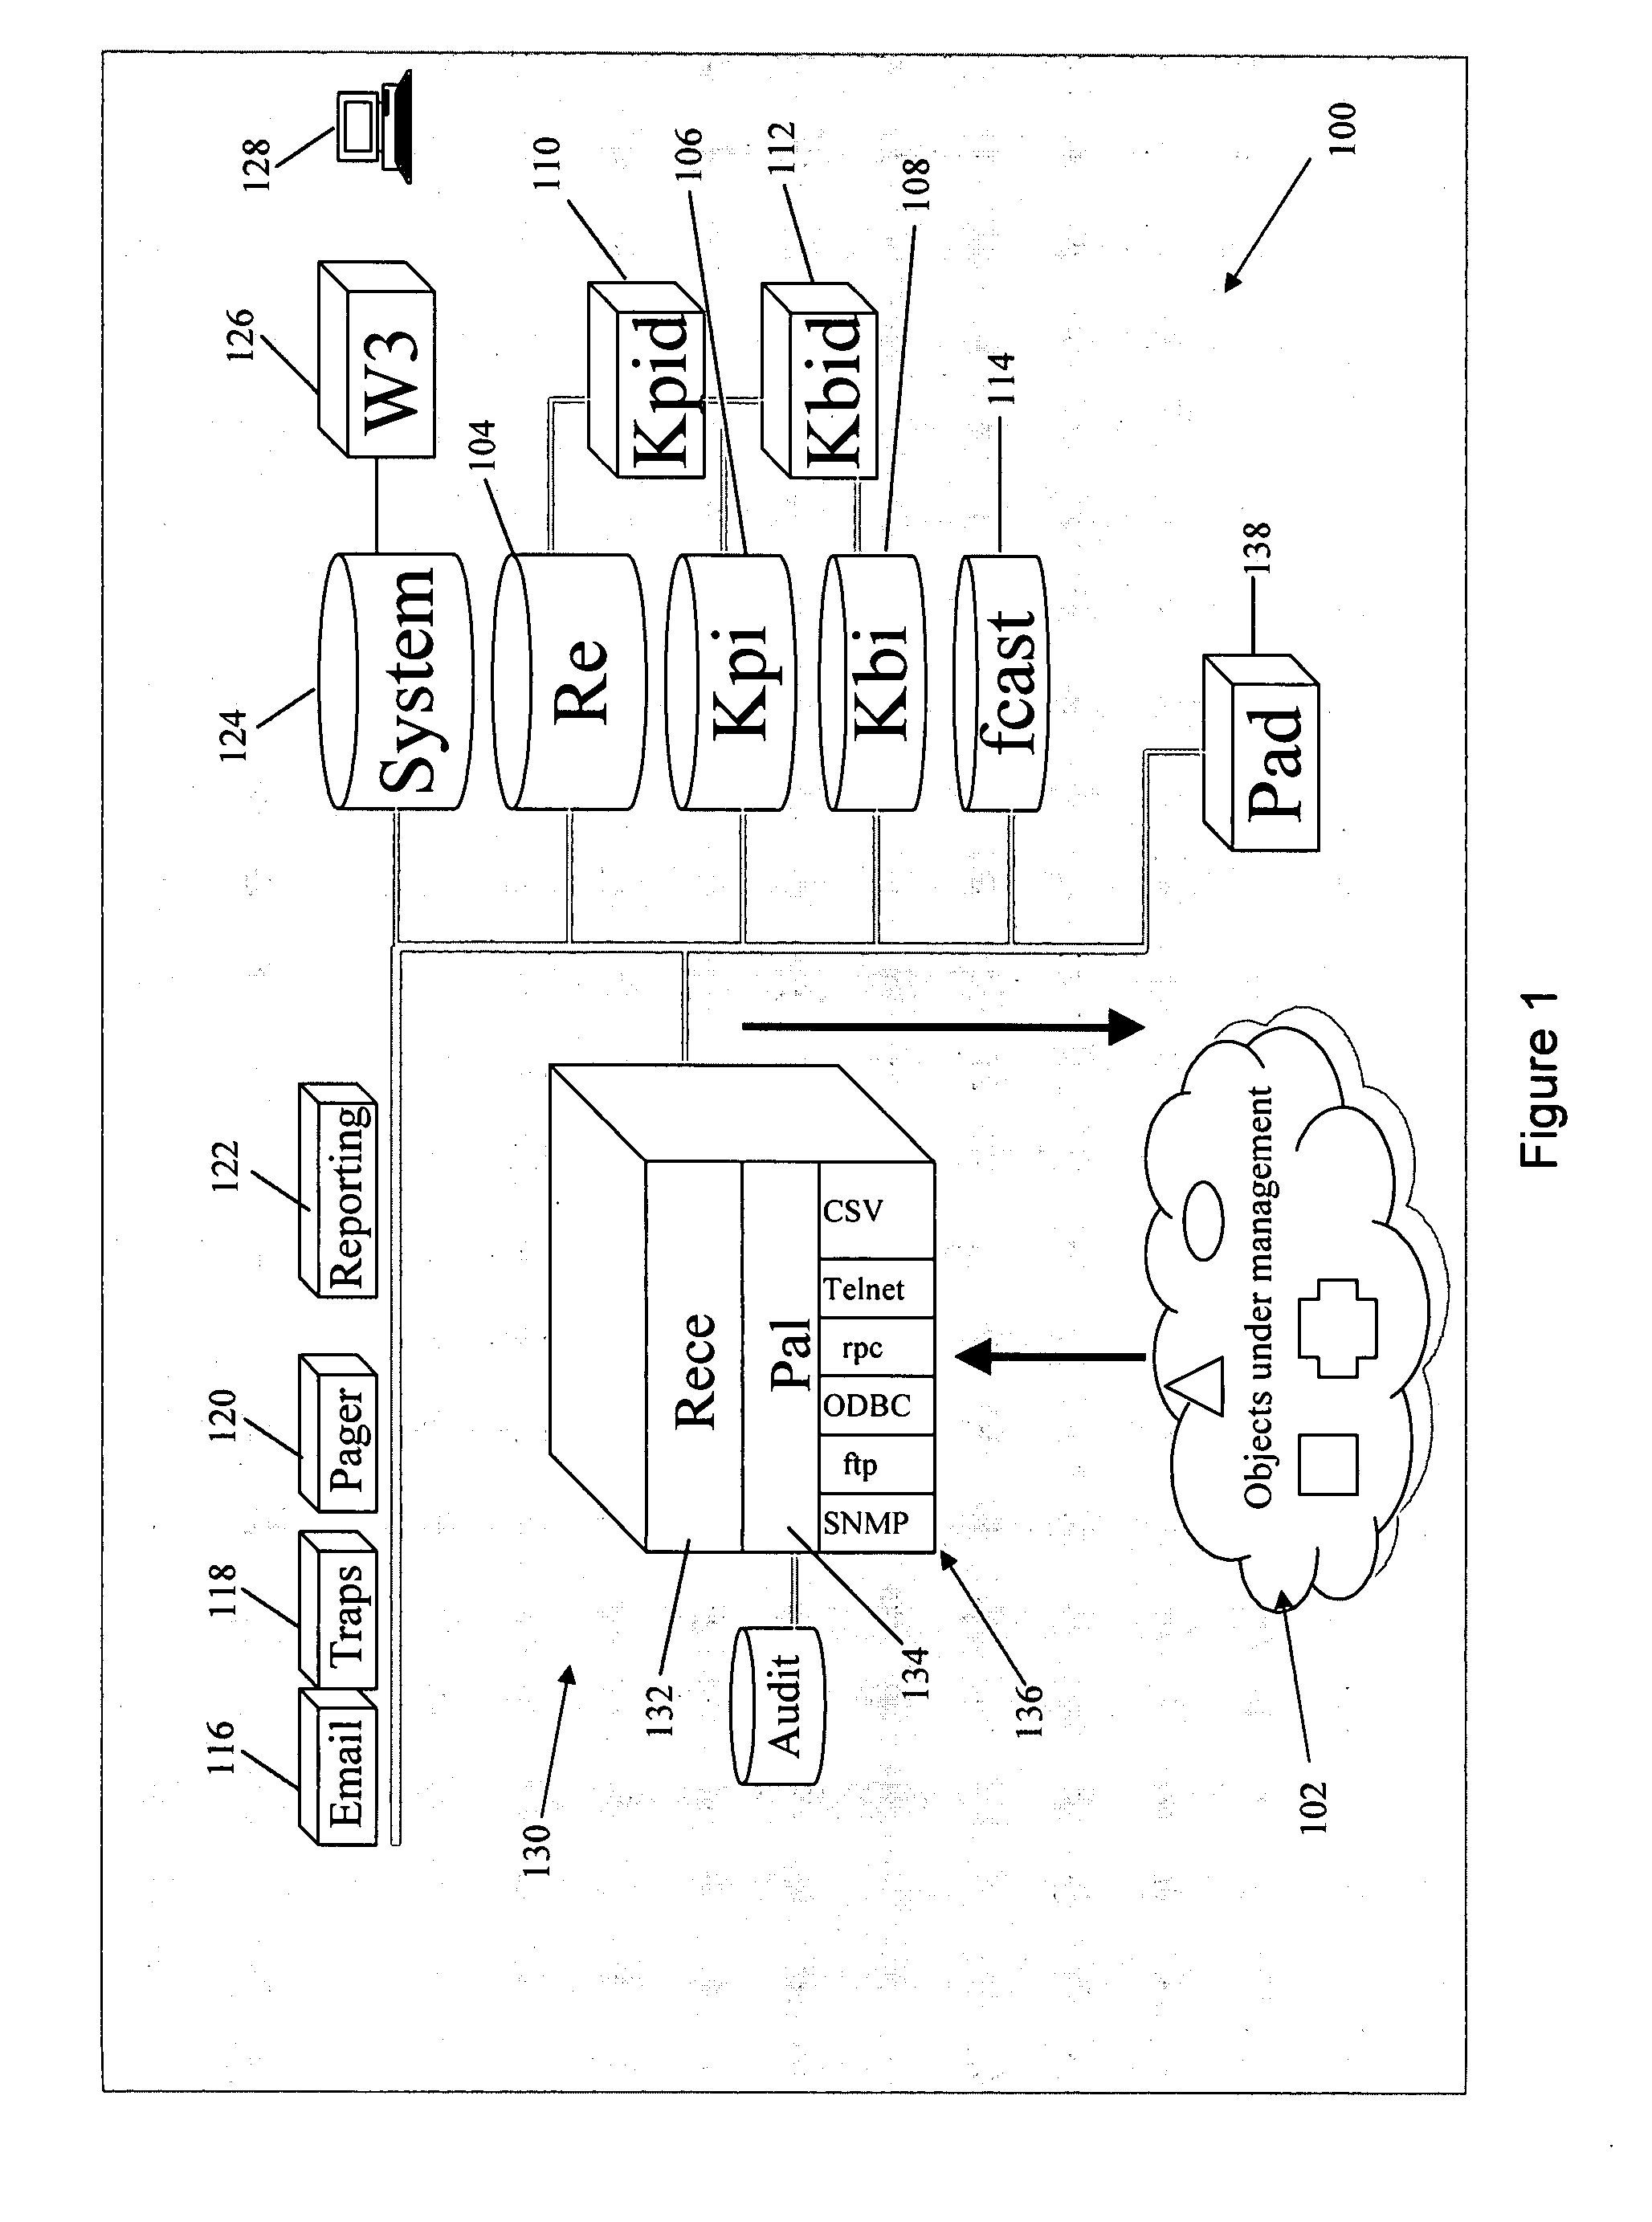
[0082]FIG. 1 shows a schematic diagram of the architecture 100 of a management system according to a preferred embodiment of the invention. The management system is managing a distributed computer system, represented in FIG. 1 by a collection of objects under management 102. The objects under management 102 typically include applications, computing resources, network resources, and encompass the software and hardware resources making up the system under management.

[0083] It is one function of the management system 100 to collect management information relevant to the performance of the information system from the objects under management 102. This management information typically consists of various performance metrics and other status data maintained by the resources in the system. In the preferred embodiment, the status data available from the objects under management 102 is referred to as Raw Element (RE) information, and is collected and stored in a Raw Elements database 104.

[...


PUM


Abstract

A method of managing a computing system (300) includes generating (1702) transaction requests in accordance with a transaction profile of the system (300). The transaction requests are provided for processing by the system (300). Status data of a set of managed resources (102) of the system (300) is collected (1704) in accordance with a system model stored in a knowledge base (204). Performance indicators of the system (300) are determined (1706) from the status data in accordance with the system model. The transaction performance of the system (300) is monitored (1710) by comparing the performance of the system (300) in processing the transaction requests with an expected performance. When a degradation in transaction performance is detected, a signal (1712) is generated to indicate that a degradation in performance has occurred, to enable the status data and / or performance indicators to be analysed at the time at which the performance degradation occurs. The method improves over prior art management methods by providing for the simultaneous measurement of the transaction performance of the system (300), along with monitoring of defined status and performance metrics, thereby enabling correlation between changes in performance and changes in the status of the system. A corresponding computer implemented means for managing a computer system, and computer program products, are also provided.

Description

[0001] The following application claims priority from PCT Patent Application No. PCT / AU 2005 / 001207 which was filed on Aug. 11, 2005 which claims priority from Australian Patent Application No. 2004904606 which was filed on Aug. 13, 2004 which are both incorporated herein. FIELD OF THE INVENTION [0002] The present invention relates to the management of distributed computer systems, and in particular to a system and apparatus for monitoring and managing the performance of such systems. BACKGROUND OF THE INVENTION [0003] Distributed computer systems are widely used to deliver computing and information services to users who access the system over computer networks. The services provided by such systems include, for example, web services, remote terminal services, online shopping, electronic business services, online database access, and enterprise computing and intranet services, amongst many other possibilities. [0004] The overall performance of any distributed computer system may dep...

Claims


Application Information

Patent Timeline
Patent Type & Authority Applications(United States)
IPC IPC(8): H04L12/26
CPCG06F11/3428G06F11/3495H04L41/0631H04L67/10H04L43/0805H04L43/16H04L41/16
Inventor GRELEWICZ, ROLANDFARRUGIA, PETER
Owner REMASYS
Why Eureka
Try Eureka