Methods and systems for optical performance monitoring

a technology of optical performance monitoring and wavelength division multiplexing, applied in the direction of transmission monitoring, instruments, 2d-image generation, etc., can solve the problems of limited functionality, inability to monitor quality by spectral methods, and inability to adjust to all effects, so as to achieve the effect of removing nois

Active Publication Date: 2008-03-27
NYTELL SOFTWARE LLC
View PDF25 Cites 14 Cited by
  • Summary
  • Abstract
  • Description
  • Claims
  • Application Information

AI Technical Summary

Benefits of technology

[0007]We have invented a method and system to economically monitor an optical OOK signal that can detect perceptible changes in signal quality and identify the type of optical impairment causing the change. Our invention requires a new and novel combination of known techniques to create an eye diagram of the transmitted pulse in a wavelength division multiplexing systems and then removing the noise from the eye diagram. The resulting “cleaner” eye diagram is then analyzed to identify any changes in performance. In our preferred embodiment, the analysis is conducted on histograms generated from eye diagram, the histograms are computed at a number of points across the optical signal pulse period.

Problems solved by technology

The problem is to develop Optical Performance Monitors (OPMs) that take measurements of an optical channel digital signal that uses On-Off Keying (OOK) and determine if its performance (e.g., bit error ratio at the receiving end) has changed perceptively from a known baseline, and if so identify the type of optical impairment that has caused the change.
Optical Performance Monitor (OPM) products exist today, but they have limited functionality that prevents them from identifying the cause of a network problem.
This means that quality monitoring by spectral methods will be insensitive to all of the effects due to [pulse] distortions.”
The current products are suitable for static point-point WDM systems, but are inadequate for dynamic WDM networks (in mesh, ring, or combined topologies).
Thus spectral techniques are not adequate.
The current OPM products use spectral techniques, which are incapable of identifying pulse distortion effects.
These reported techniques have limited ability to identify the type of impairment causing a change in performance (e.g., chromatic dispersion, polarization mode dispersion, cross-talk, etc.).
Prior published techniques have also not dealt with analyzing trends that may be precursors to fault conditions.
One example is polarization mode dispersion (PMD), which is known to vary over time and will occasionally reach a point that causes a system outage.

Method used


Image

  • Methods and systems for optical performance monitoring
  • Methods and systems for optical performance monitoring
  • Methods and systems for optical performance monitoring

Examples


Embodiment Construction

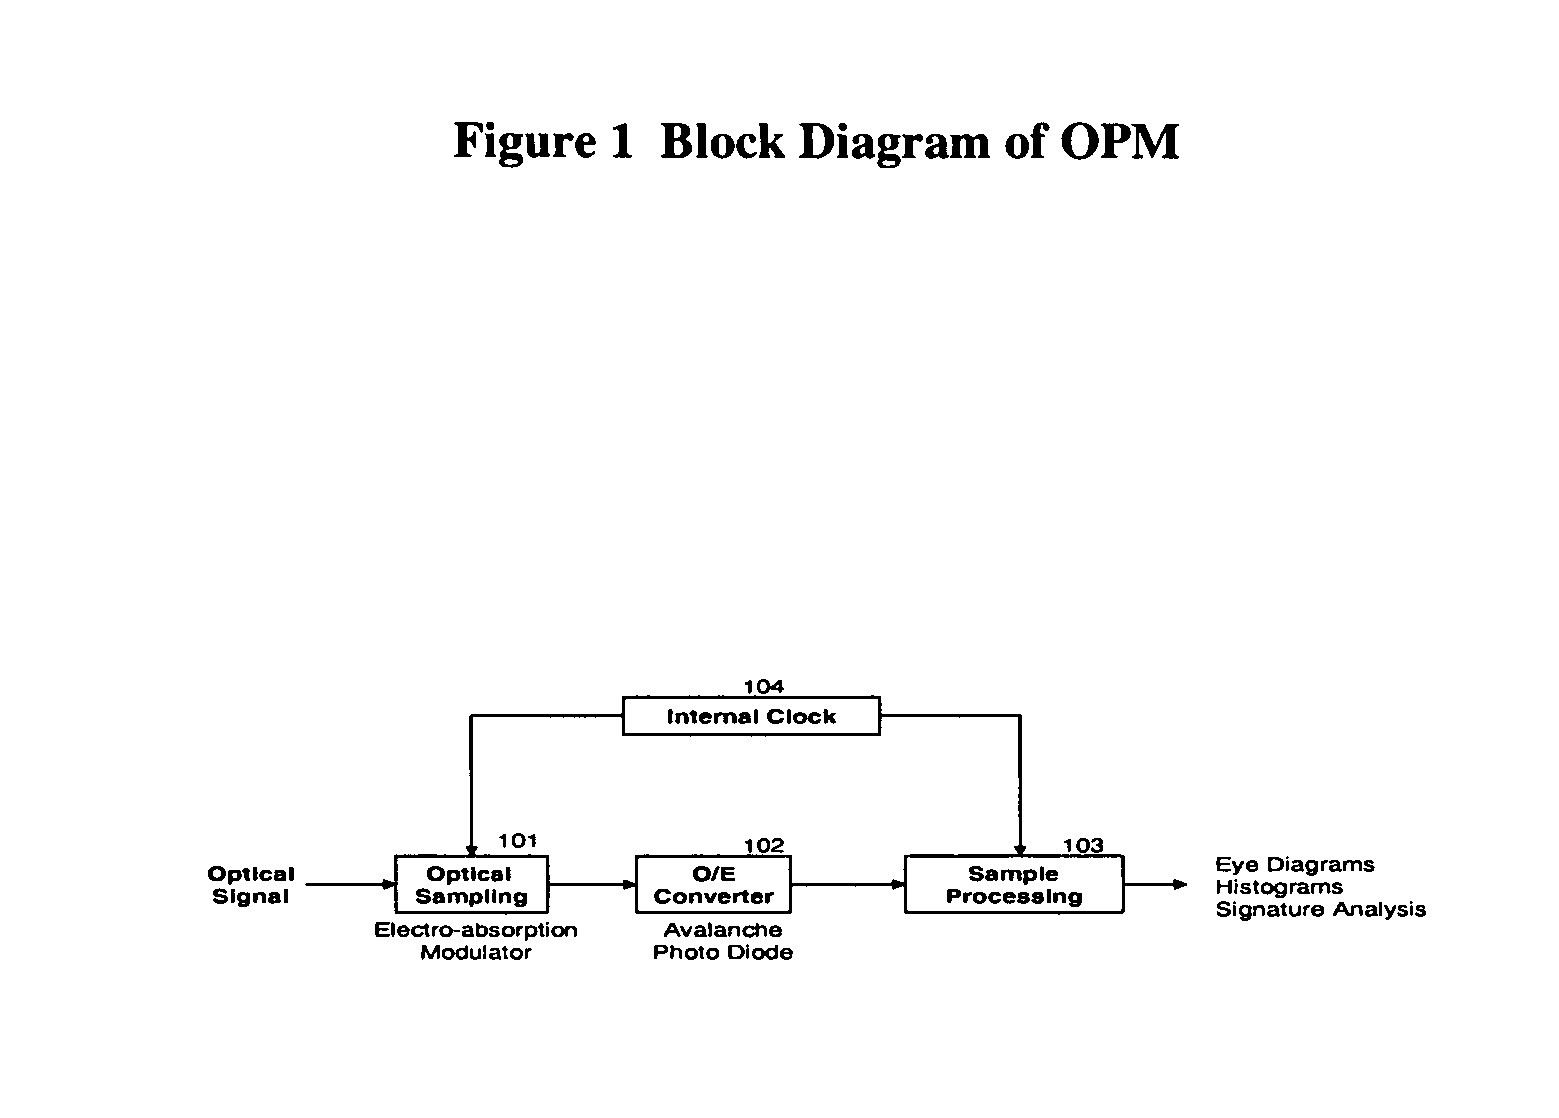
[0011]FIG. 1 shows the functional block diagram of the OPM system. An internal clock (Block 104) is used to trigger the sampling instants. Each sampling “instant” is a short sampling interval of duration around 1 / 100th the optical signal pulse period. The sampling pulse intervals from the internal clock are provided to an optical sampling device (Block 101) and the Sample Processing function (Block 103). The optical sampling function is an electro-absorption modulator that has high absorption (low output signal) outside a sampling pulse, and low absorption (measurable output signal) during a sampling pulse from the internal clock. During each sampling pulse, the output signal from the optical sampling function is sent to an Optical / Electrical (O / E) converter (an avalanche photo diode) to produce an electrical current proportional to the optical signal level during the sampling interval. The sample processing function (Block 103) records the value of each sample and its sample time. ...


PUM


Abstract

A method and system to economically monitor an optical OOK signal that can detect perceptible changes in signal quality and identify the type of optical impairment causing the change. The invention requires a new and novel combination of known techniques to create an eye diagram of the transmitted pulse in a wavelength division multiplexing systems and then removing the noise from the eye diagram. Economy of operation is achieve by using asynchronous sampling techniques for generating the eye diagram. The resulting “cleaner” eye diagram is then analyzed to identify any changes in performance. In the preferred embodiment, the analysis is conducted on histograms generated from eye diagram, the histograms are computed at a number of points across the optical signal pulse period.

Description

FIELD OF THE INVENTION[0001]The present invention relates generally to performance monitoring systems for wavelength division multiplexing transmission systems.BACKGROUND OF THE INVENTION[0002]The problem is to develop Optical Performance Monitors (OPMs) that take measurements of an optical channel digital signal that uses On-Off Keying (OOK) and determine if its performance (e.g., bit error ratio at the receiving end) has changed perceptively from a known baseline, and if so identify the type of optical impairment that has caused the change. The objective is to not only identify fault conditions and their cause, but to also identify small changes / trends (and their cause) that are precursors to fault conditions (thus allowing remedial action to be taken before a fault condition materializes). It is envisioned that OPMs would be used at multiple locations in order to localize the cause of faults, and precursors to faults. Such OPMs must be very low cost so that it is economic to depl...

Claims


Application Information

Patent Timeline
Patent Type & Authority Applications(United States)
IPC IPC(8): H04B10/08
CPCH04B10/0795
Inventor SKOOG, RONALD A.BANWELL, THOMASKOBRINSKI, HAIMHABIBY, SARRYGANNETT, JOEL W.FISCHER, RUSSELL
Owner NYTELL SOFTWARE LLC
Why Eureka
Try Eureka