Statistical signatures used with multivariate analysis for steady-state detection in a process

a statistical signature and steady-state detection technology, applied in the field of process plant diagnostics, can solve problems such as logic elements, broken or malfunctioning devices, and frequently occurring in the process plant environment, and achieve the effect of facilitating the detection of steady-sta

Active Publication Date: 2008-04-03
FISHER-ROSEMOUNT SYST INC
View PDF99 Cites 92 Cited by
  • Summary
  • Abstract
  • Description
  • Claims
  • Application Information

AI Technical Summary

Benefits of technology

[0018] In accordance with certain aspects of the disclosure, a number of techniques are disclosed to facilitate the detection of a steady-state of a process and any elements thereof. Collected process data is generated from a plurality of process variables of the process. A multivariate statistical model of the operation of the process is generated using a set of the process data. The multivariate statistical model may be generated from principal component analysis (PCA). The model is executed to generate one or more outputs each corresponding to the most significant variations in the process. Statistical measures of the output(s) are generated and used to determine whether a steady-state or unsteady-state is related to the process.

Problems solved by technology

As is known, problems frequently arise within a process plant environment, especially a process plant having a large number of field devices and supporting equipment.
These problems may take the form of broken or malfunctioning devices, logic elements, such as software routines, residing in improper modes, process control loops being improperly tuned, one or more failures in communications between devices within the process plant, etc.
These and other problems, while numerous in nature, generally result in the process operating in an abnormal state (i.e., the process plant being in an abnormal situation) which is usually associated with suboptimal performance of the process plant.
Such optimization applications typically use complex algorithms and / or models of the process plant to predict how inputs may be changed to optimize operation of the process plant with respect to some desired optimization variable such as, for example, profit.
Unfortunately, an abnormal situation may exist for some time before it is detected, identified and corrected using these tools, resulting in the suboptimal performance of the process plant for the period of time during which the problem is detected, identified and corrected.
In many cases, a control operator will first detect that some problem exists based on alarms, alerts or poor performance of the process plant.
The maintenance personnel may or may not detect an actual problem and may need further prompting before actually running tests or other diagnostic applications, or performing other activities needed to identify the actual problem.
Once the problem is identified, the maintenance personnel may need to order parts and schedule a maintenance procedure, all of which may result in a significant period of time between the occurrence of a problem and the correction of that problem, during which time the process plant runs in an abnormal situation generally associated with the sub-optimal operation of the plant.
Additionally, many process plants can experience an abnormal situation which results in significant costs or damage within the plant in a relatively short amount of time.
For example, some abnormal situations can cause significant damage to equipment, the loss of raw materials, or significant unexpected downtime within the process plant if these abnormal situations exist for even a short amount of time.
Thus, merely detecting a problem within the plant after the problem has occurred, no matter how quickly the problem is corrected, may still result in significant loss or damage within the process plant.
This is useful for an after-the-fact analysis of an abnormal situation in the process data, such as historical data or stored multidimensional data files, but it cannot be used to detect the abnormal situation in real time (e.g., on-line, at-line or in-line data analysis).
As a result, plant personnel would unfortunately have the burden of maintaining a software package separate from the control system, including supporting its access to, and interface with, the control system.
Traditional PCA techniques also may fail to easily convey information indicative of process dynamics.
Regardless of the manner in which score data is recorded or interpreted in the scatter plots, there will generally be a small uncertainty associated with data being characterized incorrectly.
As described below, without more information, a process operator often cannot be certain that a given score is normal or abnormal.
For these reasons, traditional PCA techniques have exhibited unreliable performance in the detection of abnormal situations.

Method used


Image

  • Statistical signatures used with multivariate analysis for steady-state detection in a process
  • Statistical signatures used with multivariate analysis for steady-state detection in a process
  • Statistical signatures used with multivariate analysis for steady-state detection in a process

Examples


Embodiment Construction

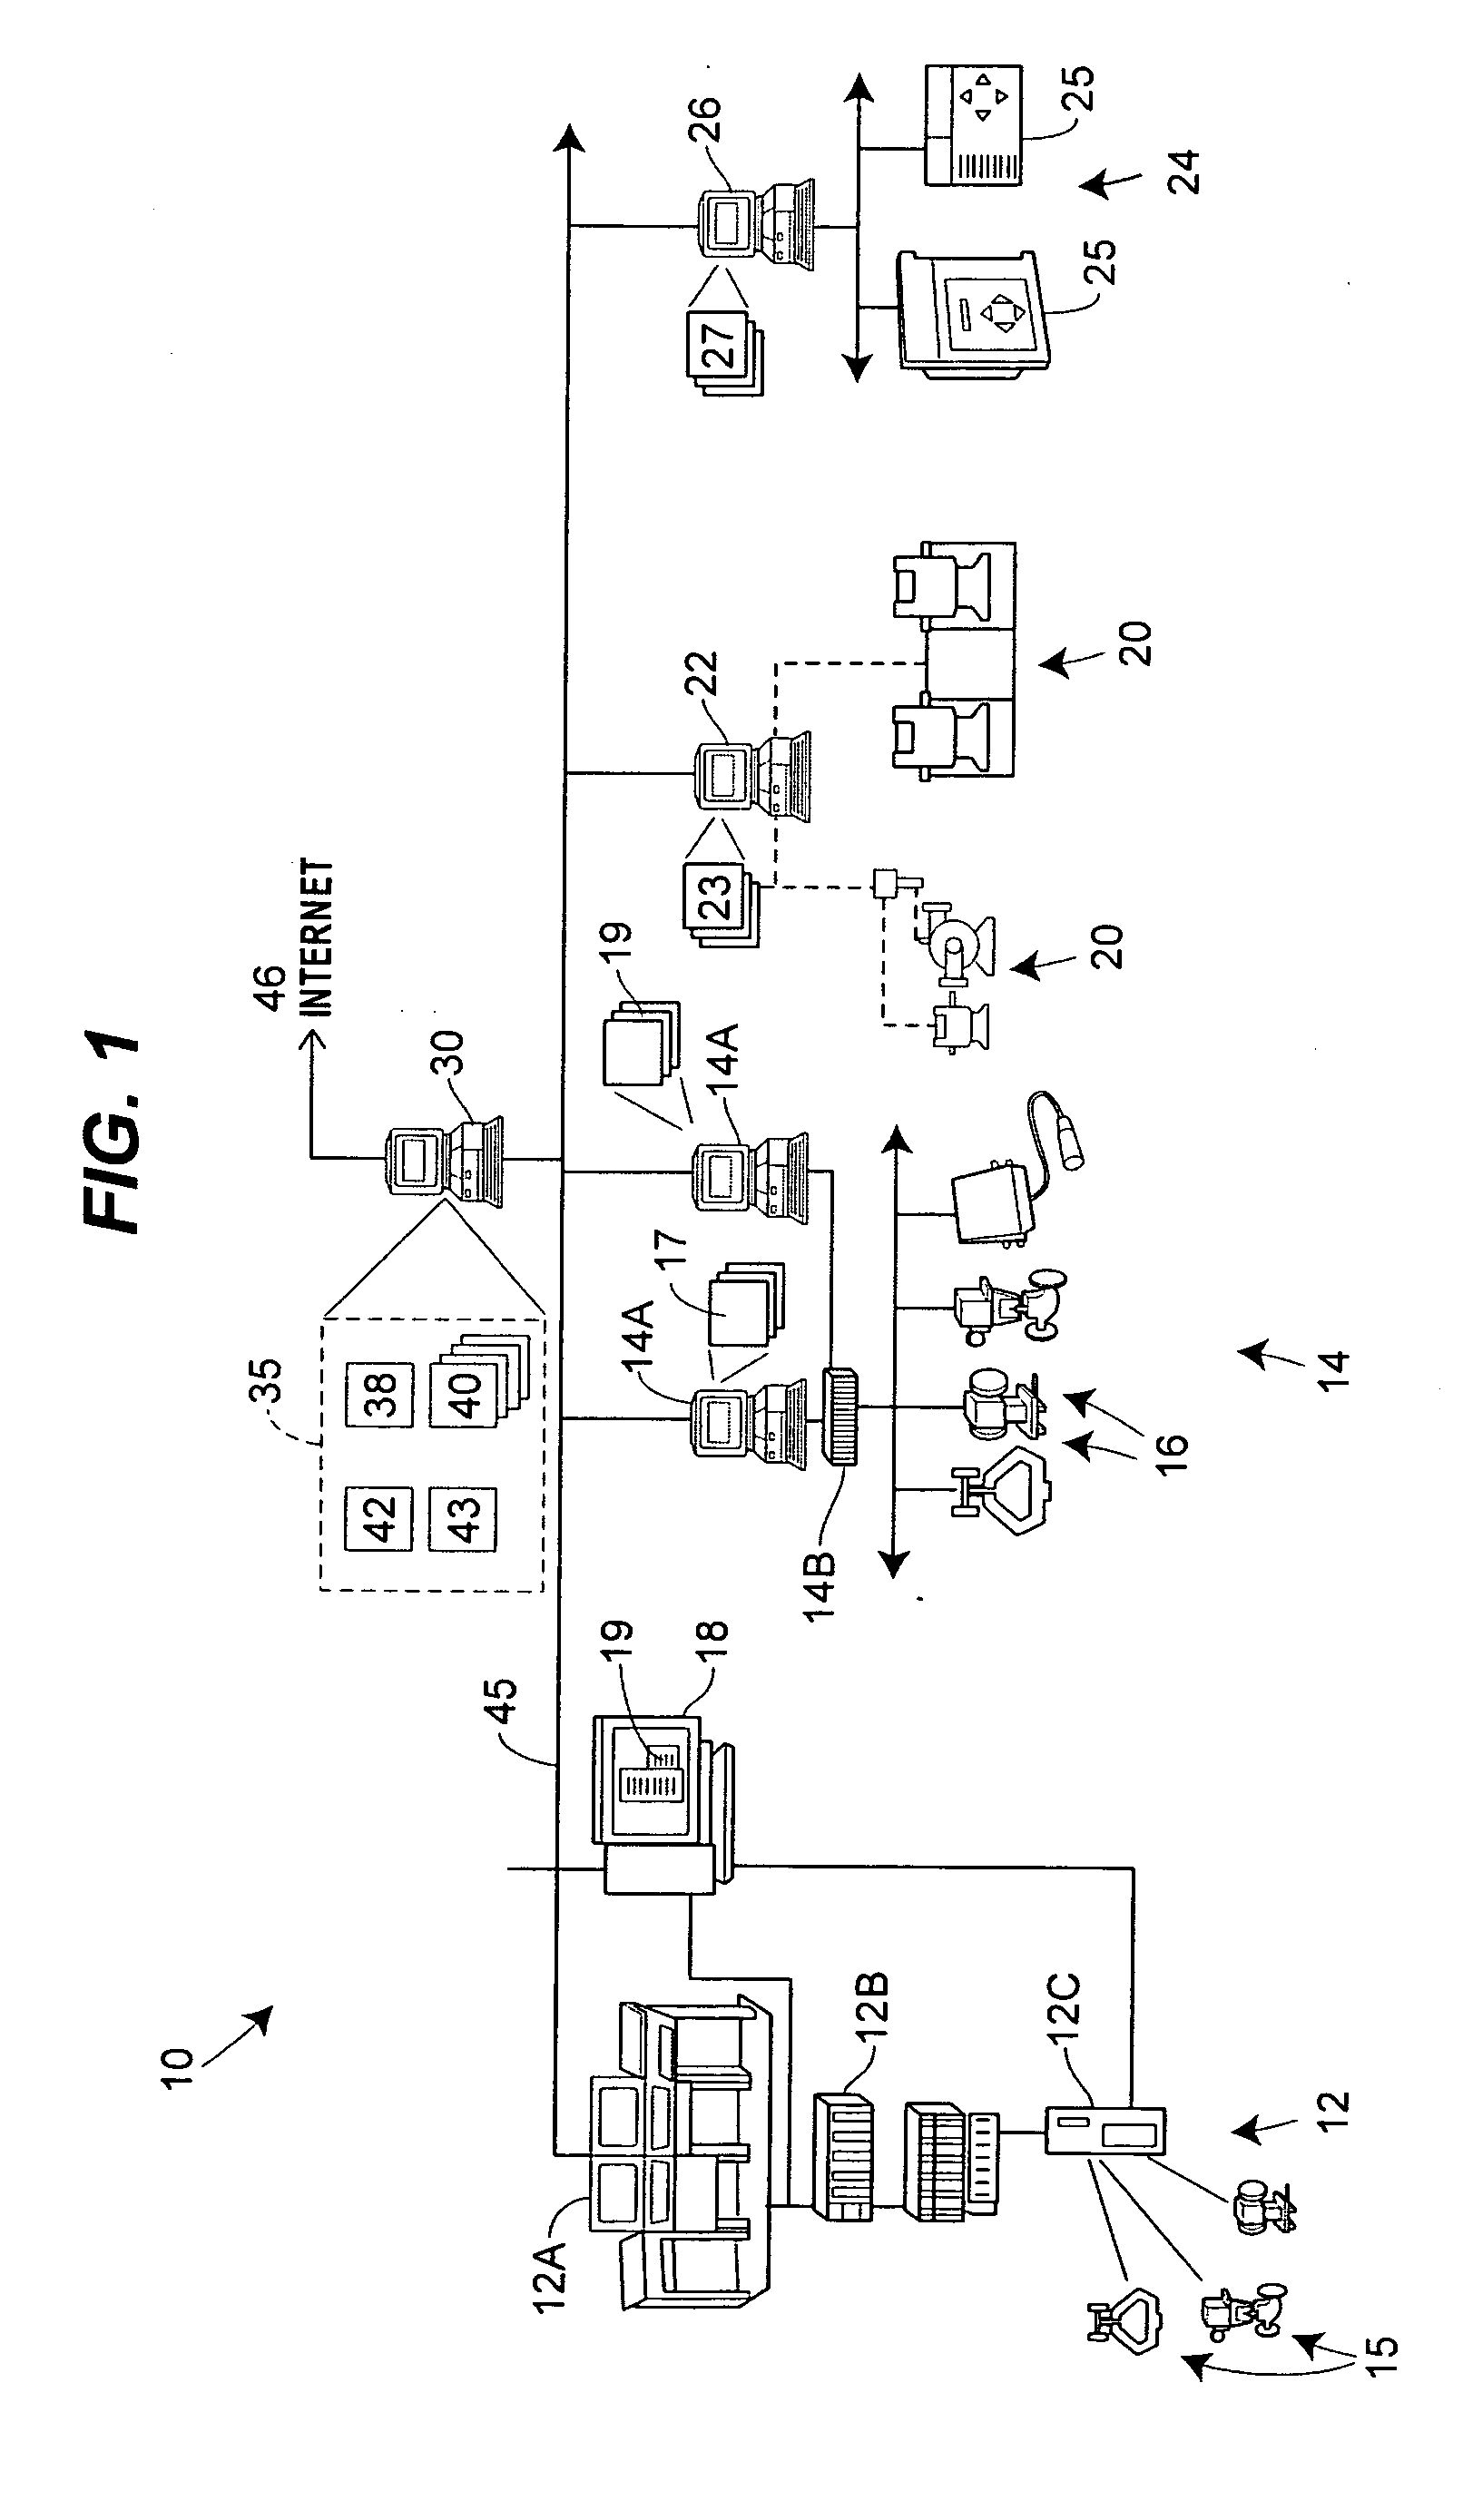
[0045] Referring now to FIG. 1, an exemplary process plant 10 in which an abnormal situation prevention system may be implemented includes a number of control and maintenance systems interconnected together with supporting equipment via one or more communication networks. In particular, the process plant 10 of FIG. 1 includes one or more process control systems 12 and 14. The process control system 12 may be a traditional process control system such as a PROVOX or RS3 system or any other control system which includes an operator interface 12A coupled to a controller 12B and to input / output (I / O) cards 12C which, in turn, are coupled to various field devices such as analog and Highway Addressable Remote Transmitter (HART)® field devices 15. The process control system 14, which may be a distributed process control system, includes one or more operator interfaces 14A coupled to one or more distributed controllers 14B via a bus, such as an Ethernet bus. The controllers 14B may be, for e...


PUM


Abstract

Methods and systems to detect steady-state operations in a process of a process plant include collecting process data. The collected process data is generated from a plurality of process variables of the process. A multivariate statistical model of the operation of the process is generated using the process data. The multivariate statistical model may be generated from a principal component analysis. The model is executed to generate outputs corresponding to the most significant variations in the process. Statistical measures of the outputs are generated and used to determine whether a steady-state or unsteady-state is related to the process.

Description

CROSS-REFERENCES TO RELATED APPLICATIONS [0001] This application claims priority from U.S. Provisional Application Ser. No. 60 / 827,631, which was filed on Sep. 29, 2006, entitled “ON-LINE PRINCIPAL COMPONENT ANALYSIS IN A DISTRIBUTED CONTROL SYSTEM.” The above-referenced provisional patent application is hereby incorporated by reference herein, in its entirety.TECHNICAL FIELD [0002] This disclosure relates generally to process plant diagnostics and, more particularly, to monitoring and diagnostic systems involving multivariate statistical techniques. DESCRIPTION OF THE RELATED ART [0003] Process control systems, like those used in chemical, petroleum or other processes, typically include one or more centralized or decentralized process controllers communicatively coupled to at least one host or operator workstation and to one or more process control and instrumentation devices such as, for example, field devices, via analog, digital or combined analog / digital buses. Field devices, w...

Claims


Application Information

Patent Timeline
Patent Type & Authority Applications(United States)
IPC IPC(8): G05B13/02
CPCG05B23/021Y10S715/965G05B23/0245G05B23/024
Inventor MILLER, JOHN P.LUNDEBERG, MARCUS R.
Owner FISHER-ROSEMOUNT SYST INC
Why Eureka
Try Eureka