Model selection for cluster data analysis

a cluster data and model selection technology, applied in the field of learning machines, can solve the problems of increasing difficulty in facilitating human comprehension of the information in this data, unapproachable problems, and a large amount of data, and achieve the effect of facilitating the clustering task and low noise level

Inactive Publication Date: 2008-06-12
HEALTH DISCOVERY CORP +1
View PDF14 Cites 10 Cited by
  • Summary
  • Abstract
  • Description
  • Claims
  • Application Information

AI Technical Summary

Benefits of technology

[0012]In one embodiment, the inventive method provides means for extraction of information from gene expression profiles, in particular, extraction of the most relevant clusters of temporal expression profiles from tens of thousands of measured profiles. In one variation of the present embodiment, the clustering algorithm is the k-means algorithm. Other embodiments include all pairwise clustering methods (e.g., hierarchical clustering) and support vector clustering (i.e., a support vector machine (SVM)). In one variation, the fit involves affine transformations such as translation, rotation, and scale. Other transformations could be included, such as elastic transformations. In the case of k-means, the algorithm is applied in a hierarchical manner by sub-sampling the data and clustering the sub-samples. The resulting cluster centers for all the runs are then clustered again. The resulting cluster centers are considered to be the most significant profiles. To facilitate the clustering task, a ranking of the genes is first performed according to a given quality criterion combining saliency (significant difference in expression in the profile), smoothness, and reliability (low noise level). Other criteria for ranking include the local density of examples.

Problems solved by technology

Recent advancements in database technology have lead to an explosive growth in systems and methods for generating, collecting and storing vast amounts of data.
While database technology enables efficient collection and storage of large data sets, the challenge of facilitating human comprehension of the information in this data is growing ever more difficult.
With many existing techniques the problem has become unapproachable.
Currently, there are no methods, systems or devices for adequately analyzing the data generated by such biological investigations into the genome and proteome.
Clustering analysis is unsupervised learning—it is done without suggestion from an external supervisor; classes and training examples are not given a priori.
However, most clustering algorithms do not address this problem.
The question remains, however, of how to set the input parameter, or how to determine which level of the tree representation of the data to look at: Clustering algorithms are unsophisticated in that they provide no insight into the level of granularity at which the “meaningful” clusters might be found.
This is seen as the problem of finding the optimal number of clusters in the data, relative to some clustering algorithm.
Other model selection techniques have difficulty detecting the absence of structure in the data, i.e., that there is a single cluster.
Further, many of algorithms make assumptions as to cluster shape, and do not perform well on real data, where the cluster shape is generally not known.

Method used


Image

  • Model selection for cluster data analysis
  • Model selection for cluster data analysis
  • Model selection for cluster data analysis

Examples


example 2

DNA Microarray Data

[0058]The next dataset considered was the yeast DNA microarray data of M. Eisen et. al. (“Genetics cluster analysis and display of genome-wide expression patterns”, Proc. Natl. Acad. Sci. USA, 95: 14863-14868, December 1998.). The data is a matrix which represents the mRNA expression levels of n genes across a number of experiments. Some of the genes in the data have known labels according to a functional class. Five functional classes were selected along with genes that belong uniquely to these five functional classes. This yielded a dataset with 208 genes, with 79 features (experiments). Data was normalized by subtracting the mean and dividing by the standard deviation for each column. This was also performed for the rows, and repeated for the columns. At this stage the first three principal components were extracted. The distribution and histogram of scores is give in FIG. 2a for k over the range of 2 to 7. The same behavior is observed as seen in the mixture o...

example 3

Uniformly Distributed Data

[0059]The results of a test run on data uniformly distributed on the unit cube is shown in FIGS. 3a and 3b. The distributions are quite similar to each other, with no change that can be interpreted as a transformation from a stable set of solutions to unstable solutions

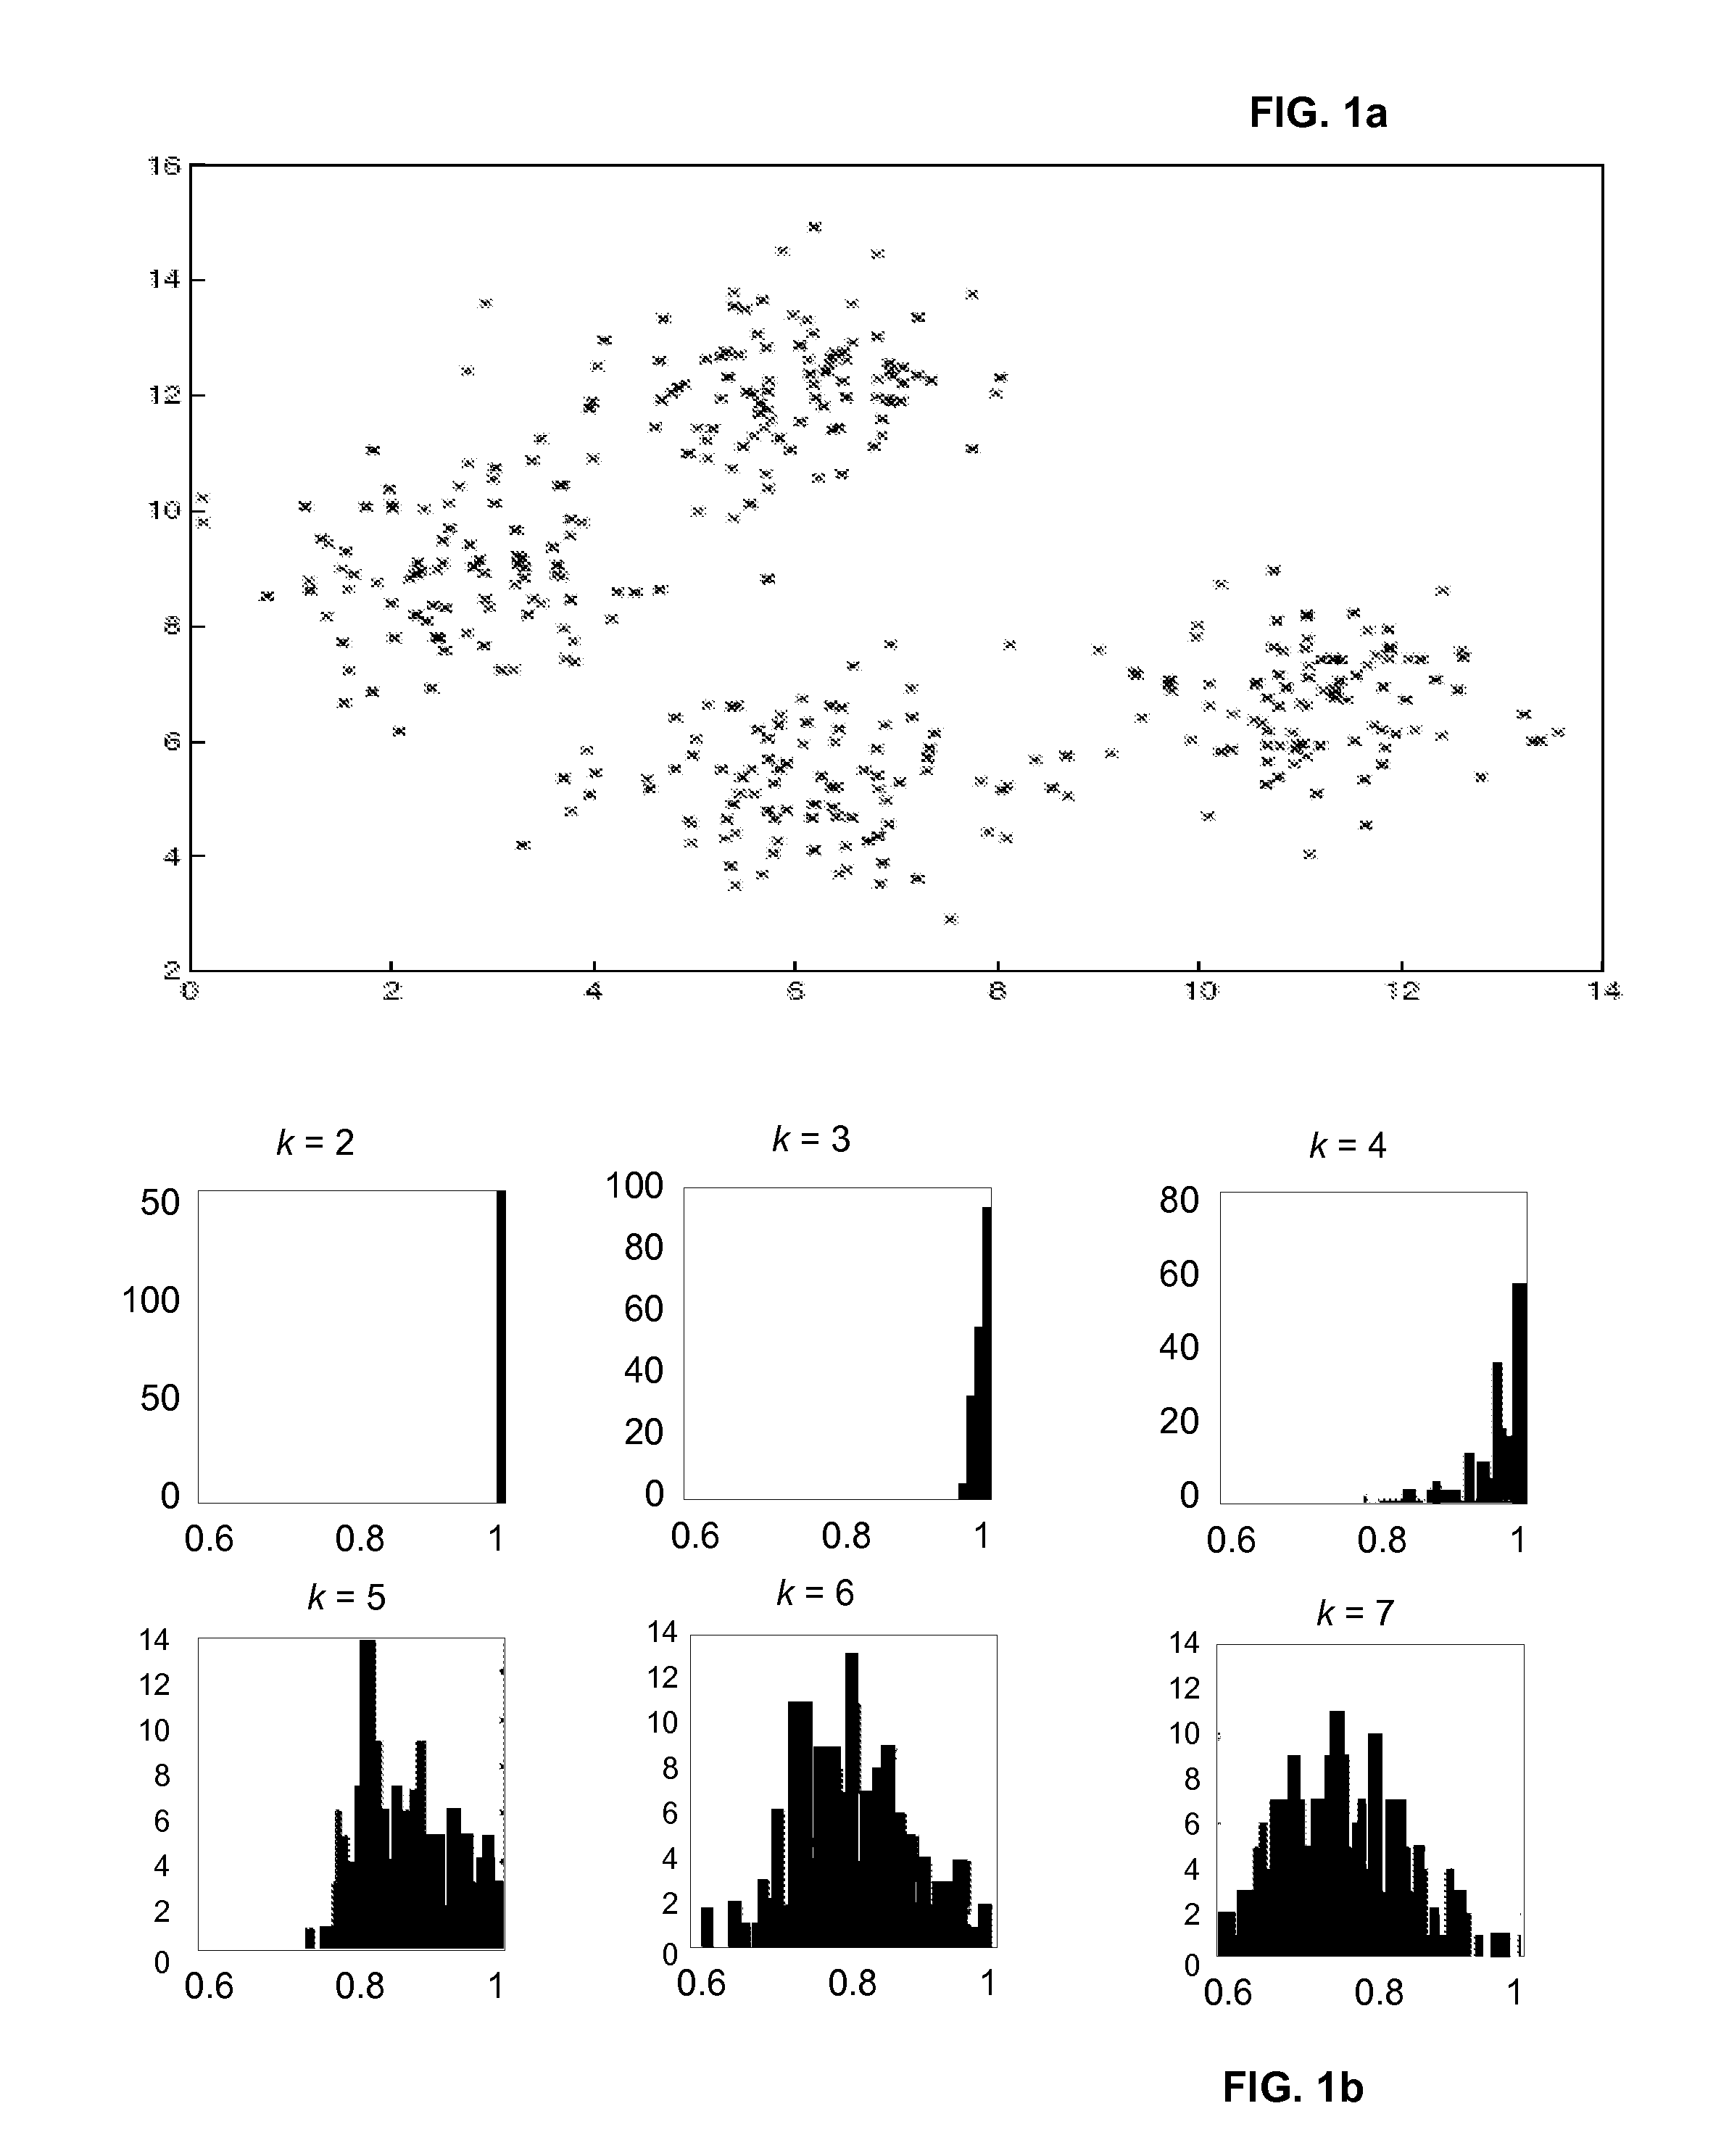
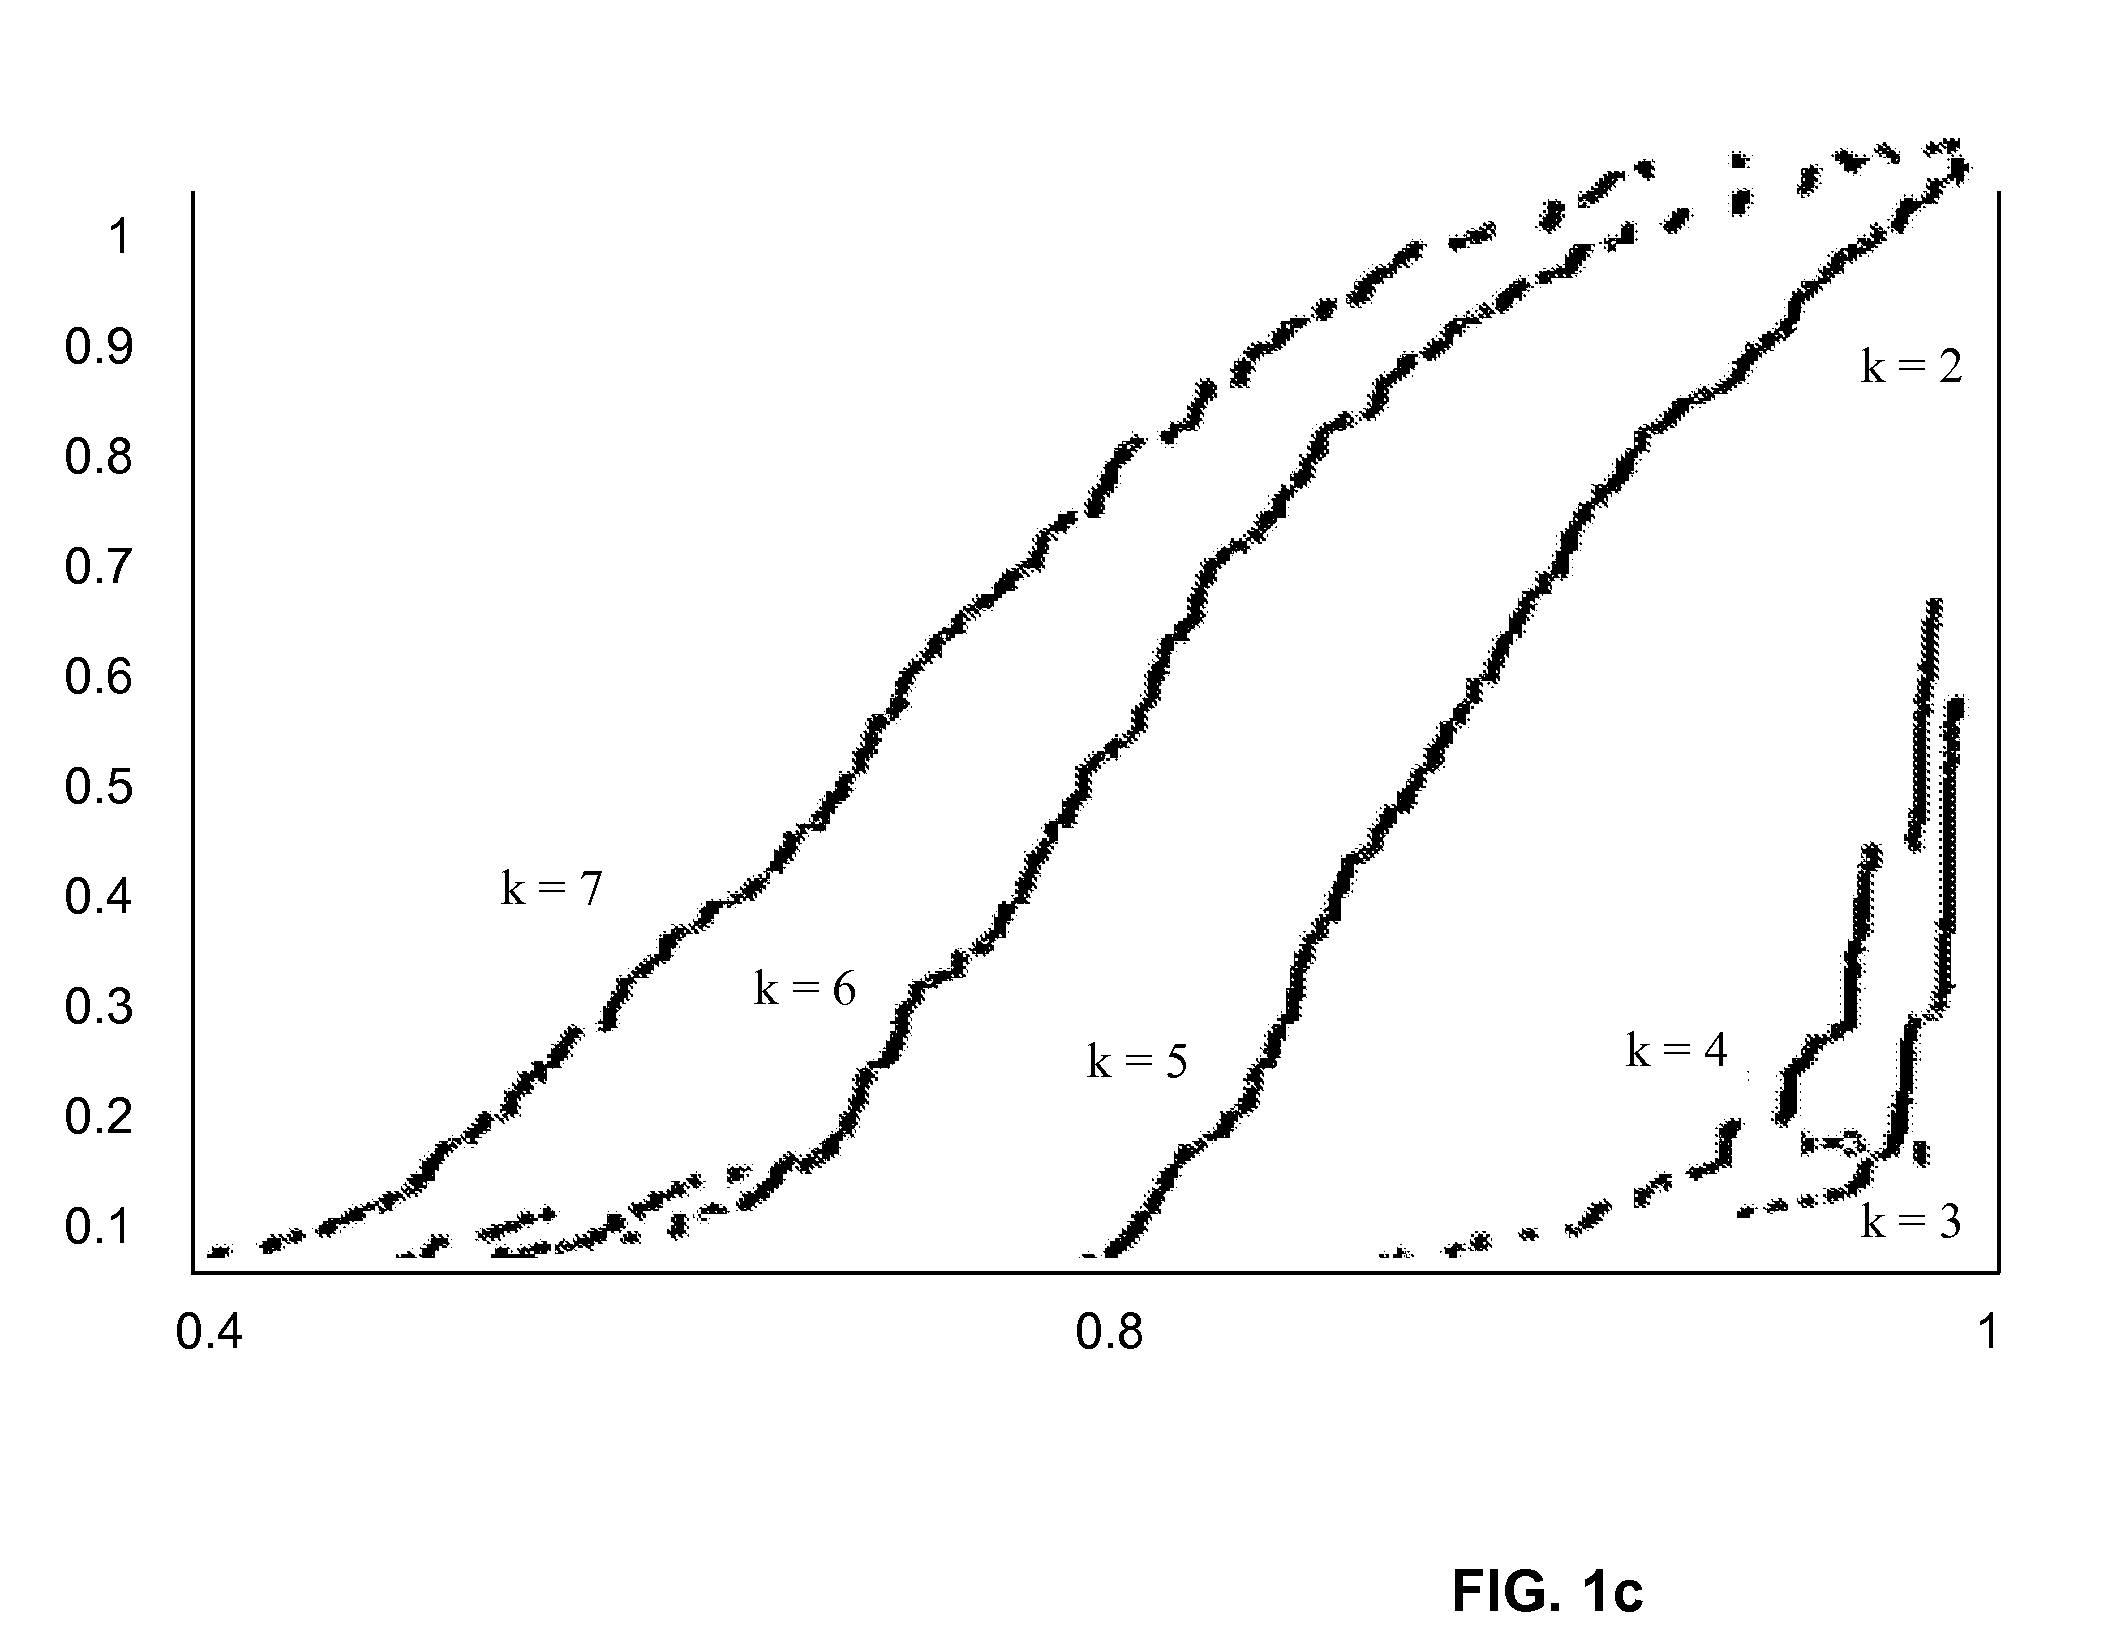
[0060]The preceding examples indicate a simple way for choosing k as the value where there is a transition from a score distribution that is concentrated near 1 to a wider distribution. This can be quantified, e.g., by an increase in the area under the cumulative distribution function or by an increase in

S(K)=P(s>0.90).

The value of 0.9 is arbitrary, but any value close to 1 would work on the set of examples considered here.

example 4

Isolet Letter Pronunciation

[0061]The next test was run on a portion of the ISOLET (Isolated Letter Speech Recognition) database created by Ron Cole and Mark Fanty of the Department of Computer Science and Engineering, Oregon Graduate Institute, Beaverton, Oreg. and available from the UCI (University of California at Irvine) Repository of Machine Learning Databases. (This data set was generated by having 150 subjects speak the name of each letter of the alphabet twice, generating 52 training examples from each speaker.) This test provides an example of what occurs with there is cluster overlap.

[0062]One thousand points of the original dataset, representing the letters “a”, “c”, “d”, “e”, “f” were used. The columns of the data were “whitened”, then the first three principle components were extracted. FIG. 4a is a plot of the distribution of the first two principle components for each of the selected letters. FIG. 4b provides histograms of the correlation score for each kin the range o...


PUM


Abstract

A model selection method is provided for choosing the number of clusters, or more generally the parameters of a clustering algorithm. The algorithm is based on comparing the similarity between pairs of clustering runs on sub-samples or other perturbations of the data. High pairwise similarities show that the clustering represents a stable pattern in the data. The method is applicable to any clustering algorithm, and can also detect lack of structure. We show results on artificial and real data using a hierarchical clustering algorithm.

Description

FIELD OF THE INVENTION[0001]The present invention relates to the use of learning machines to identify relevant patterns in datasets containing large quantities of diverse data, and more particularly to a method and system for unsupervised learning for determining an optimal number of data clusters into which data can be divided to best enable identification of relevant patterns.BACKGROUND OF THE INVENTION[0002]Knowledge discovery is the most desirable end product of data collection. Recent advancements in database technology have lead to an explosive growth in systems and methods for generating, collecting and storing vast amounts of data. While database technology enables efficient collection and storage of large data sets, the challenge of facilitating human comprehension of the information in this data is growing ever more difficult. With many existing techniques the problem has become unapproachable. Thus, there remains a need for a new generation of automated knowledge discover...

Claims


Application Information

Patent Timeline
Patent Type & Authority Applications(United States)
IPC IPC(8): G06F15/18G06G7/48G06G7/58G06K9/62G16B25/10G16B40/20G16B40/30
CPCG06F19/20G06F17/30705G06K9/6218G06F19/24G06F16/35G16B25/00G16B40/00G16B40/30G16B40/20G16B25/10G06F18/23
Inventor BEN-HUR, ASAELISSEEFF, ANDREGUYON, ISABELLE
Owner HEALTH DISCOVERY CORP
Why Eureka
Try Eureka