Biocontrol of Varroa Mites

Inactive Publication Date: 2009-03-05
US SEC AGRI
3 Cites 24 Cited by

AI-Extracted Technical Summary

Problems solved by technology

However, chemical pesticides can pose risks to human health and cause environmental damage due to adverse effects on non-target insects and other animals.
Chemical pesticides can kill pollinating insects, adversely affecting pl...

Benefits of technology

[0009]It is therefore an object of the present invention to provide an entomopathogenic f...

Abstract

A biopesticide formulation using isolates of the fungus Beauveria bassiana has been developed, which can be used to control arachnid infestations of honeybee hives. The formulation is particularly useful for controlling infestations of Varroa destructor in honey bee hives.

Application Domain

BiocideFungi +4

Technology Topic

Varroa destructorBeehive +6

Image

  • Biocontrol of Varroa Mites
  • Biocontrol of Varroa Mites
  • Biocontrol of Varroa Mites

Examples

  • Experimental program(7)

Example

EXAMPLE 1
[0057]Apiaries were visited at several locations. At each apiary, a metal tray was placed under each hive, the hives were opened and approximately 150 grams of powdered sugar was poured into the brood box, making an effort to divide it among all the between-frame spaces. Powdered sugar has been shown to be effective in knocking down V. destructor on adult honey bees (Fakhimzadeh, Apidologie, Volume 32, pages 139-148, 2001). The hives were then closed and about 20 minutes later all the material that had collected on the tray was poured into a sealed plastic box. The boxes were transported to the laboratory and all Varroa mites were placed on water agar (about 6 grams/liter) with chloramphenicol (about 0.4 grams/liter) to reduce bacterial growth, incubated for about two weeks at about 23° C. and observed for at least three weeks for sporulation. Any entomopathogenic fungi collected were used to inoculate two types of media: Sabouraud dextrose agar with yeast (SDAY) (Goettel and Inglis, 1997, supra) and semi-synthetic INRA media (Meikle et al. Journal of applied Entomology, Volume 129, pages 315-322, 2005), both with chloramphenicol (about 0.4 grams/liter), in plastic petri dishes (about 3.5 cm diameter). The most vigorous cultures were purified through a series of two to three isolations on average, and grown as pure cultures.
[0058]A total of 8 B. bassiana isolates were recovered from the exploration. Two of these were selected for bioassay evaluation.

Example

EXAMPLE 2
[0059]Isolates from Example 1 were evaluated, as well as several Metarhizium anisopliae (Metschnikoff) Sorokin (Deuteromycota: Hyphomycetes) isolates from the collection of entomopathogenic fungi at the European Biological Control Laboratory (EBCL) in bioassays using Varroa mites kept on bee pupae. Cultures of candidate fungal isolates were grown on SDAY with chloramphenicol and harvested after about 12-14 days. For each experiment, the viability of the conidia was assessed by plating a sample of the suspension onto SDAY, incubating the plates at about 23° C. for about 24 hours, and examining about 200 conidia for germ tubes under a light microscope. Prior to the bioassay, bee pupae were collected from hives by cutting sections of brood comb from the frame, placing the pieces in a sterile plastic box and, in the lab, carefully extracting the pupae and placing them individually in small (about 2×2×1 cm) plastic boxers with screen covers. Any Varroa mites found on the pupae upon their removal from the comb were destroyed. A suspension containing about 107 conidia/ml was prepared by suspending a quantity of conidia in about 10 ml of about a 0.1% aqueous solution of TWEEN 80 poured into 50 ml bottles filled with glass beads and agitated for about two minutes using a Vortex Genie 2 (Scientific Industries, Bohemia, N.Y., USA). Thirty Varroa mites were placed in a petri dish (about 9 cm diameter) lined with moist filter paper, placed in a spray tower (Burkard Manufacturing Ltd., Herts., England) and sprayed with either an aqueous TWEEN 80 solution (no conidia) or the conidial suspension. The spray tower had an air pressure of about 0.74 kg/cm2 and delivered an average of about 714 conidia/mm using suspensions of about 5×10⁷ conidia/ml (Meikle et al., 2005, supra). After exposure, Varroa mites were placed on the bee pupae at the density of two mites per pupa. All the small boxes containing the mites and bee pupae were placed in a large plastic box kept at about 85% relative humidity using a saturated KCl solution, and the box was placed in an incubator at approximately 30 degrees C. Each cell was inspected about every 2-3 days until all mites in both treatments were dead, and bee pupae were replaced twice a week. Dead mites were immediately placed on water agar containing chloramphenicol, kept at about 23 degrees C. and examined after two weeks for signs of sporulation.
[0060]Of the 8 total isolates examined in the bioassay, 7 were found to significantly lower mite survivorship relative to the control. Median survivorship of mite treated with B05002 was about 5 days in the first bioassay and 8 days in the second (See Table 1 below) and this isolate was selected for use in the field experiments.
TABLE 1 Bioassay results. MEDIAN SURVIVORSHIP WILCOXON PROBA- ISOLATE ORIGIN (DAYS) CHI SQUARE BILITY Bb05002 Varroa mite 5 26.96 <0.0001 (1st) Bb05002 Varroa mite 8 20.62 <0.0001 (2nd) Bb05005 Varroa mite 6 13.745 0.0002 Meta Termite 3.5 23.54 <0.0001 03015 Meta Termite 3.5 22.63 <0.0001 03019 Meta Soil 5 26.51 <0.0001 92204 Meta Soil 3 3.90 0.048 92206 Meta Soil 13 0.36 0.548 92209 The Wilcoxon Chi square statistic was used to compare survivorship of mites treated with conidia to control mites. The median survivorship of mites in the control group ranged from about 15.5 days to about 26 days (from Meikle et al., 2006, supra).

Example

EXAMPLE 3
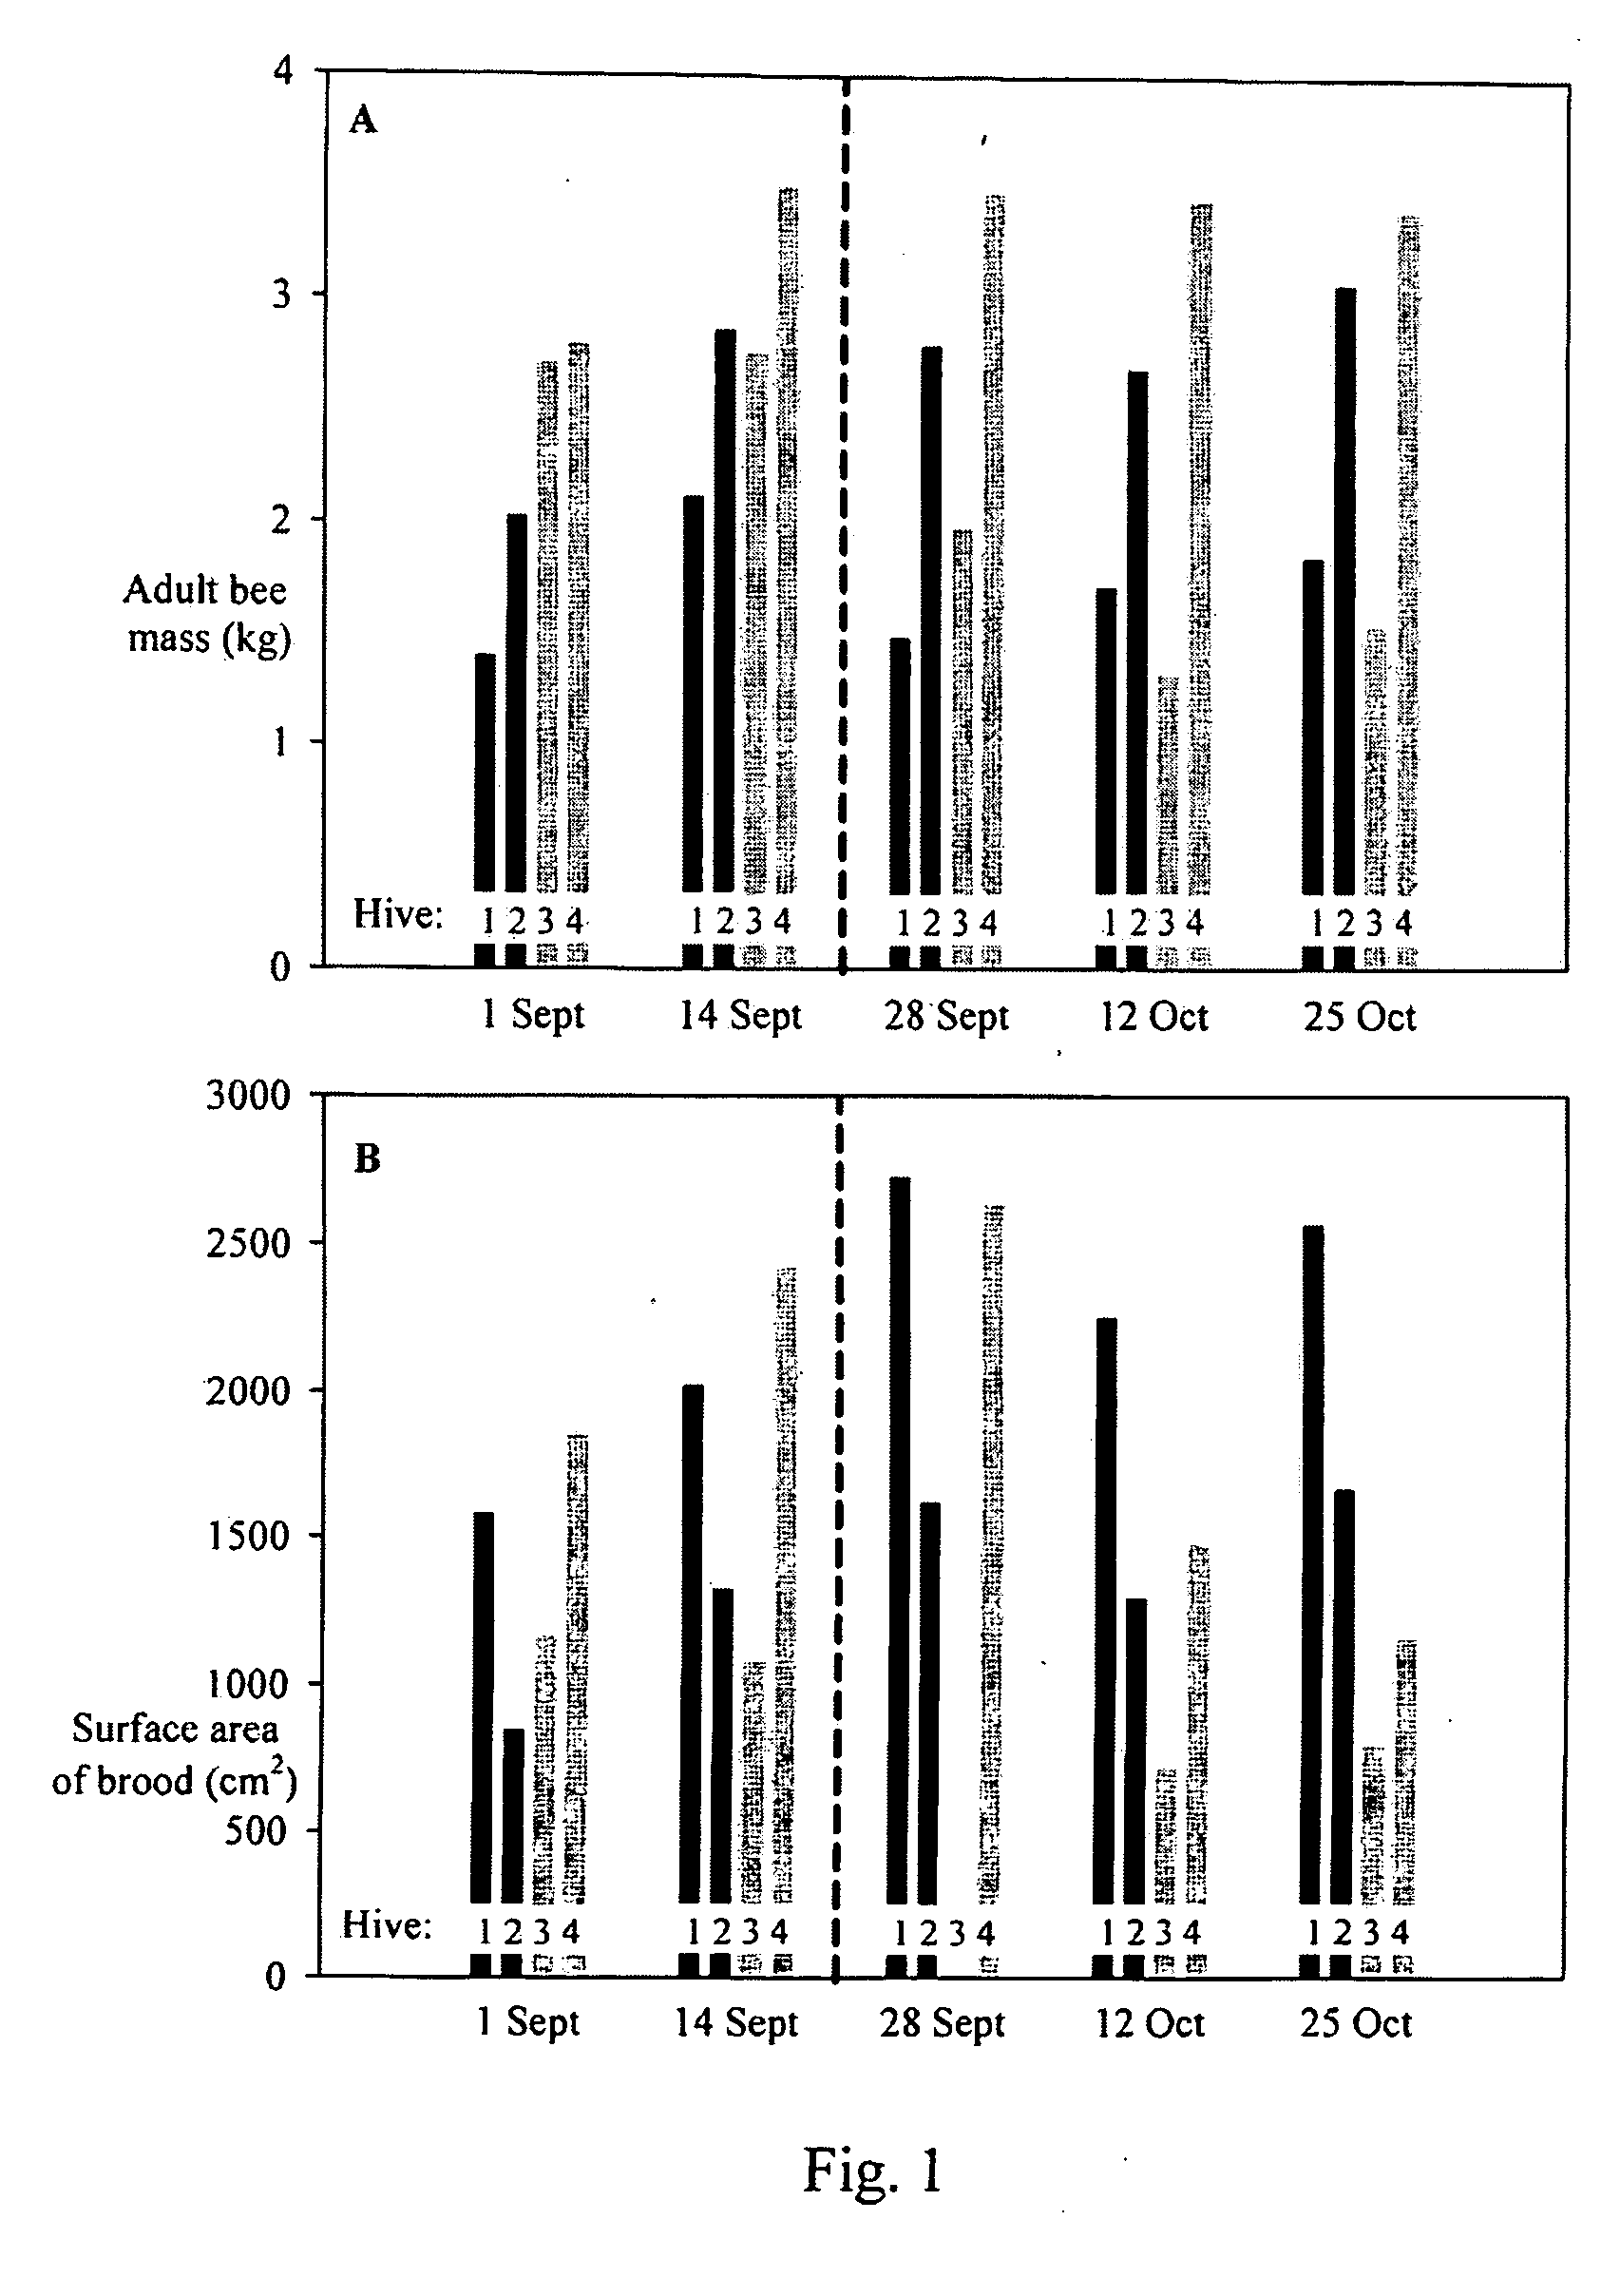
[0061]Eight bee colonies, four established one year and one month before the other, were maintained in painted, 10-frame wooden Dadant brood boxed (56 1 capacity) (Ickowicz, Bollene, France). The hives were covered with telescoping lids with a weight placed on top to stabilize the hive in wind. The hives were arranged in two groups of four hives each, about 4 meters apart. Within each group, hives were kept about 50 cm apart. Permanent water sources existed less than about 1 km away. In order to monitor changes in hive weight during the course of the experiment, four of the hives, two in each hive group, were placed on top of two short wooden planks resting on stainless steel electronic balances (TEKFA® model B-2418, Galten, Denmark). The balances had about a 100 kg maximum capacity, a precision of about 10 grams, and an operating temperature range of about −30 degrees C. to about 70 degrees C. The balances were linked to 12-bit dataloggers (Hobo® U-12 External Channel datalogger, Bourne Mass., USA) and powered by a solar panel (BP Solar model 1230, Mimeure, France). The weighing system had an overall precision of about 30 g. The adult bee mass for the hives kept on the scales was estimated every two weeks, starting about three weeks before treatment, by weighing each brood box frame and the super separately with a portable electronic balance (Kern and Sohn model 12K 1N, Balingen, Germany), after shaking them free of bees, and subtracting the combined weight of the frames containing brood, honey, and pollen and non-colony components from the total hive weight.
[0062]Cultures of Beauveria bassiana (Balsamo) Vuillemin (Deuteromycota:Hyphomycetes( ) isolates Bb05002, NRRL 30976 isolated from Varroa mites, were grown on Sabouraud dextrose with yeast (SDAY) as in Example 1 for about 15 days. Conidia were harvested by scraping the tops of the cultures onto glass Petri dishes with a metal spatula, and the Petri dishes placed in a crystallizing dish containing silica gel for drying. The viability of the conidia was assessed by plating a suspension sample onto SDAY, incubating the plates at about 23 degrees C. for about 24 hours and examining about 200 conidia for germ tubes under a light microscope.
[0063]Conidia were formulated as follows: Approximately 0.77 grams of conidia of the Bb05002 strain were mixed with about 20.0 grams of ENTOSTAT® powder, a highly refined and electrostatic-charged carnauba wax (Exosect, Southampton, UK) and about 0.10 grams hydrated silica (Hi-Sil-233, Pittsburgh Plate Glass, Pittsburgh, Pa., USA) using a food processor (Valentin Mini Chopper, SEB, Dijon, France). The density of viable conidia per gram formulation was determined by plating onto potato-dextrose agar (PDA) three 0.1 ml sub-samples of the formulation diluted in distilled water to a concentration of approximately 1000 spores/ml, and counting the number of colonies about ninety-six hours after plating. Varroa sticky boards (Mann Lake Ltd., Hackensack, Minn., USA) were placed under eight hives in an apiary. About six days later, the sticky boards were collected from beneath each hive and replaced. Two hives on balances were selected for treatment, one hive approximately 2 years old and the other approximately six months old. For each treated hive, a plastic laboratory squirt bottle was filled with about 10.0 grams of the Bb05002 conidia formulation and the formulation was blown between all the frames in the brood box. As a blank control, the other two hives on balances were treated in a similar fashion using about 10.0 grams ENTOSTAT® powder and about 0.05 grams silica per hive. The density of conidia in this experiment was approximately 7.95×10⁹ conidia per gram of formulation. Conidia viability was approximately 91%. The remaining hives in the apiary were not treated.
[0064]Sticky boards were removed and replaced approximately every two days after treatment, to reduce contamination due to formulation on the boards. For the following about 15 days, each hive had two sets of boards, with a given board being used on alternate days. All the mites falling on each board were counted daily, removed from the board, and those mites plated on water agar with chloramphenicol. After 15 days, sticky boards were replaced twice a week, all mites counted, and 40-mite samples were plated. After plating, all mite samples were incubated at about 23 degrees C. and examined for sporulation after about 15 days. The day before treatment, and at about 1, 3, 8, 16, and 24 days after treatment, samples of approximately 20 bees per hive were collected in small plastic bags and immediately placed in a freezer. About three weeks later, three 5 bee subsamples from each hive were removed from the bags and vortexed separately of about 3 minutes in approximately 50 ml of about a 0.1% aqueous solution of TWEEN 80. Aliquots of about 20 μl and 100 μl of the resulting suspension of each subsample were spread onto each of three Petri dishes containing SDAY with chloramphenicol, thus 9 plates for each sampling session. The dishes were incubated for about 10 days at about 23 degrees C. and the number of B. bassiana colonies were counted in the plates with about 20 μl; when conidia densities became low, the colonies were counted on the 100 μl plates.
[0065]Mites were not surface sterilized prior to plating for two reasons: many mites, when removed from the sticky boards, were damaged, and the sterilization procedure may have killed an incipient infection; and because sticky boards were replaced within 2 to 3 days after treatment, thus removing from the system the formulation that fell through the hive during that period, it was seen as unlikely that the boards would be a major source of contamination of the mites.
[0066]Data were analyzed using SAS and JMP (SAS Institute, Inc., Cary N.C., USA) software. Multiple regression analyses (α=0.05) were analyzed with a linear mixed model using PROC MIXED of SAS (Littell et al., SAS Institute, Cary, N.C., USA, 1996) with either daily mite fall (square root-transformed), proportion infected mites (arcsine-square root-transformed) or cfu density per bee (log {x+1}-transformed) as response variable and with 3 fixed effects: treatment, date and their interaction. Hive number was incorporated in the analysis as a random effect. The degrees of freedom were calculated using the Satterthwaite method. For each variable, the covariance matrix of the response variable was inspected for patterns and residual plots were assessed visually to check variance homogeneity. Insignificant main effects were excluded from the model but if the interaction was significant both main factors were retained. Because excess formulation on sticky boards immediately after treatment may cause spurious infection data, the first sample after treatment was excluded from each of the analysis of proportion infected mites. Conidia density was 7.95×10⁹ conidia per g formulation.
[0067]Adult bee masses were never significantly different between the powder only treatment and the conidia+powder treatment (t test within sampling occasion, α=0.05) (FIG. 1). One hive treated with powder only lost its queen in the first half of September; although the queen was replaced before the start of the experiment, a visual inspection of the frame photos for that one hive (hive 3) showed an absence of brood at the first sampling after treatment. Because of the importance of brood to Varroa dynamics, mite fall data for hive 3 were excluded from statistical analyses, although data on percentage infected mites for hive 3 were retained. Only one other hive (hive 4) was treated with powder alone, so the powder treatment was removed from the mite fall analyses.
[0068]The average daily mite fall per hive was calculated for the first 17 days after treatment (FIG. 2). Mixed-model analysis of mite fall showed that while treatment was not significant (F1,4=1.60, p=0.274), both date (F13,52=2.45, p=0.0113) and their interaction (F13,52=4.38, p<0.0001) were, indicating that mite fall did exhibit significant change over time and that the relationship between the treated and control hives varied over time. Post hoc contrasts showed that hives treated with conidia had significantly higher mite fall than control hives on 26 (F1,5=8.13, p=0.0333) and 6 and 8 days after treatment (F1,5=7.33, p=0.0398), which was when maximum treatment effect was expected based on laboratory bioassays. Treatment caused widespread infection of mites in the treated hives in both experiments, with some infection in untreated hives as well due to movement of bees from treated hives to untreated hives, and the effect lasted over a month after treatment.
[0069]The daily data up to 17 days after treatment were pooled to generate semi-weekly data and combined with later data collected twice per week (FIG. 3). A mixed-model analysis of this semi-weekly data was conducted for both percentage infection and for mite fall. In the percentage infection analysis, both treatment and date were significant (F2,5=60.78, p=0.0003 for treatment and F12,60=11.96, p<0.0001 for date) but interaction was not (F24,60=3.16, p=0.089), indicating that treatment caused a significant increase in the incidence of infection and that the percentages varied over time. The non-significant interaction means that the treatment effects on the transformed scale were approximately constant. After removing the interaction term and re-analyzing the data using treatment contrasts with the Bonferroni adjustment, the conidia+powder treatment was shown significantly different from both the powder only treatment (t7=6.06, p=0.0015) and from the control (t7=6.61, p=0.0009). After treatment, infected mites were found in substantial numbers also in untreated hives in both experiments. In the mite fall analysis, none of the factors was significant (F1,4=0.22, p=0.665 for treatment; F12,48=1.95, p=0.052 for date; F12,48=1.02, p=0.444 for interaction). After removing the interaction term and re-analyzing the data, date was significant (F12,60=2.65, p=0.0065) but treatment was not (F1,4=0.22, p=0.665).
[0070]Analysis of the cfu density per bee showed that treatment (F2,5=43.68, p=0.0007), date (F4,20=30.40, p<0.0001) and their interaction (F8,20=20.24, p<0.0001) were significant. Low numbers of B. bassiana cfu, averaging about 1 cfu per bee, were found the day before treatment (FIG. 4). The day after treatment the number of cfu peaked at an average of about 1.1×10⁴ cfu per bee in the treated hives, and declined rapidly thereafter. Elevated cfu levels were also observed in bees from control hives and those treated only with powder. However, the average levels never exceeded 10 cfu per bee in the powder-only treatment and 3 cfu per bee in the control. After 24 days, cfu densities on bees were very similar among treatments, and were similar to the pre-treatment level. The response of percentage infected mites to cfu density on bees was sigmoid (FIG. 5).

PUM

no PUM

Description & Claims & Application Information

We can also present the details of the Description, Claims and Application information to help users get a comprehensive understanding of the technical details of the patent, such as background art, summary of invention, brief description of drawings, description of embodiments, and other original content. On the other hand, users can also determine the specific scope of protection of the technology through the list of claims; as well as understand the changes in the life cycle of the technology with the presentation of the patent timeline. Login to view more.
Why Eureka
Try Eureka