Methods to correct gene set expression profiles to drug sensitivity

a gene set and gene expression technology, applied in the field of gene set expression profiles to correct drug sensitivity, can solve the problems of high cost of current approach, poor fit of one-size-fits-all treatment, and inability to achieve meaningful improvement in mortality

Inactive Publication Date: 2009-09-03
THE JOHN HOPKINS UNIV SCHOOL OF MEDICINE
View PDF3 Cites 9 Cited by
  • Summary
  • Abstract
  • Description
  • Claims
  • Application Information

AI Technical Summary

Benefits of technology

[0008]In one embodiment, the present invention provides a method for selecting a candidate therapeutic agent, comprising: (a) determining a gene set expression profile for two or more genes in a target cell; (b) comparing the gene set expression profile of the target cell to one or more gene set expression profiles of a panel of reference cells, wherein the panel comprises cells from more than two different cell types; (c) identifying a reference cell from the panel that has the most similar gene set expression profile to the target cell according to the comparison in step (b); and (d) selecting a therapeutic agent known for treating a condition in the reference cell identified in step c).

Problems solved by technology

As each individual patient poses a different genetic aberrant background in his / her cancer, the one-size-fits-all treatment is usually a poor fit.
Indeed, cancer is the only top-five disease where no meaningful improvements in mortality have been observed in the last 30 years.
Moreover, the current approach is very expensive.
Because many patients only have time for one or two lines of therapy, the current non-selective strategy deprives the patients of sufficient opportunities to explore other therapies.
Her2 is over-expressed in 20-30% of breast cancers and is associated with lower responsiveness to standard treatments and poorer outcome.
This has been called “chemotherapy sensitivity and resistance assays.” However, these methods have not yet shown to be predictive of anticancer drug efficacy in the clinic.
In addition, substantial pitfalls remain for these tailor-made approaches, as they are restricted to: 1) patients undergoing surgical resection of their cancers with availability of excess tumor tissue; and / or 2) successful propagation of the tumor cells in in vitro or in vivo conditions.
This approach seems promising but may not represent the true pathway signatures in tumors in vivo.

Method used


Image

  • Methods to correct gene set expression profiles to drug sensitivity
  • Methods to correct gene set expression profiles to drug sensitivity
  • Methods to correct gene set expression profiles to drug sensitivity

Examples


example 1

Gene Expression and Gene Set Enrichment Analysis

1. Microarray Analysis

[0159]Tumor cell lines and baseline tumors from xenografts and direct patient samples were profiled using Affymetrix U133 Plus 2.0 gene arrays. This gene array has about 54,000 probes comprising about 20,000 genes. Sample preparation and processing procedure was performed as described in the Affymetrix GeneChip® Expression Analysis Manual (Affymetrix Inc., Santa Clara, Calif.). Gene expression levels were converted to a rank-based matrix and standardized (mean=0, standard deviation=1) for each microarray. Probes from Affymetrix HG-U133 Plus2.0 gene array were mapped to the HG-U133A and HG-U133B probes based on the probe set identifiers.

2. Gene Set Enrichment Analysis

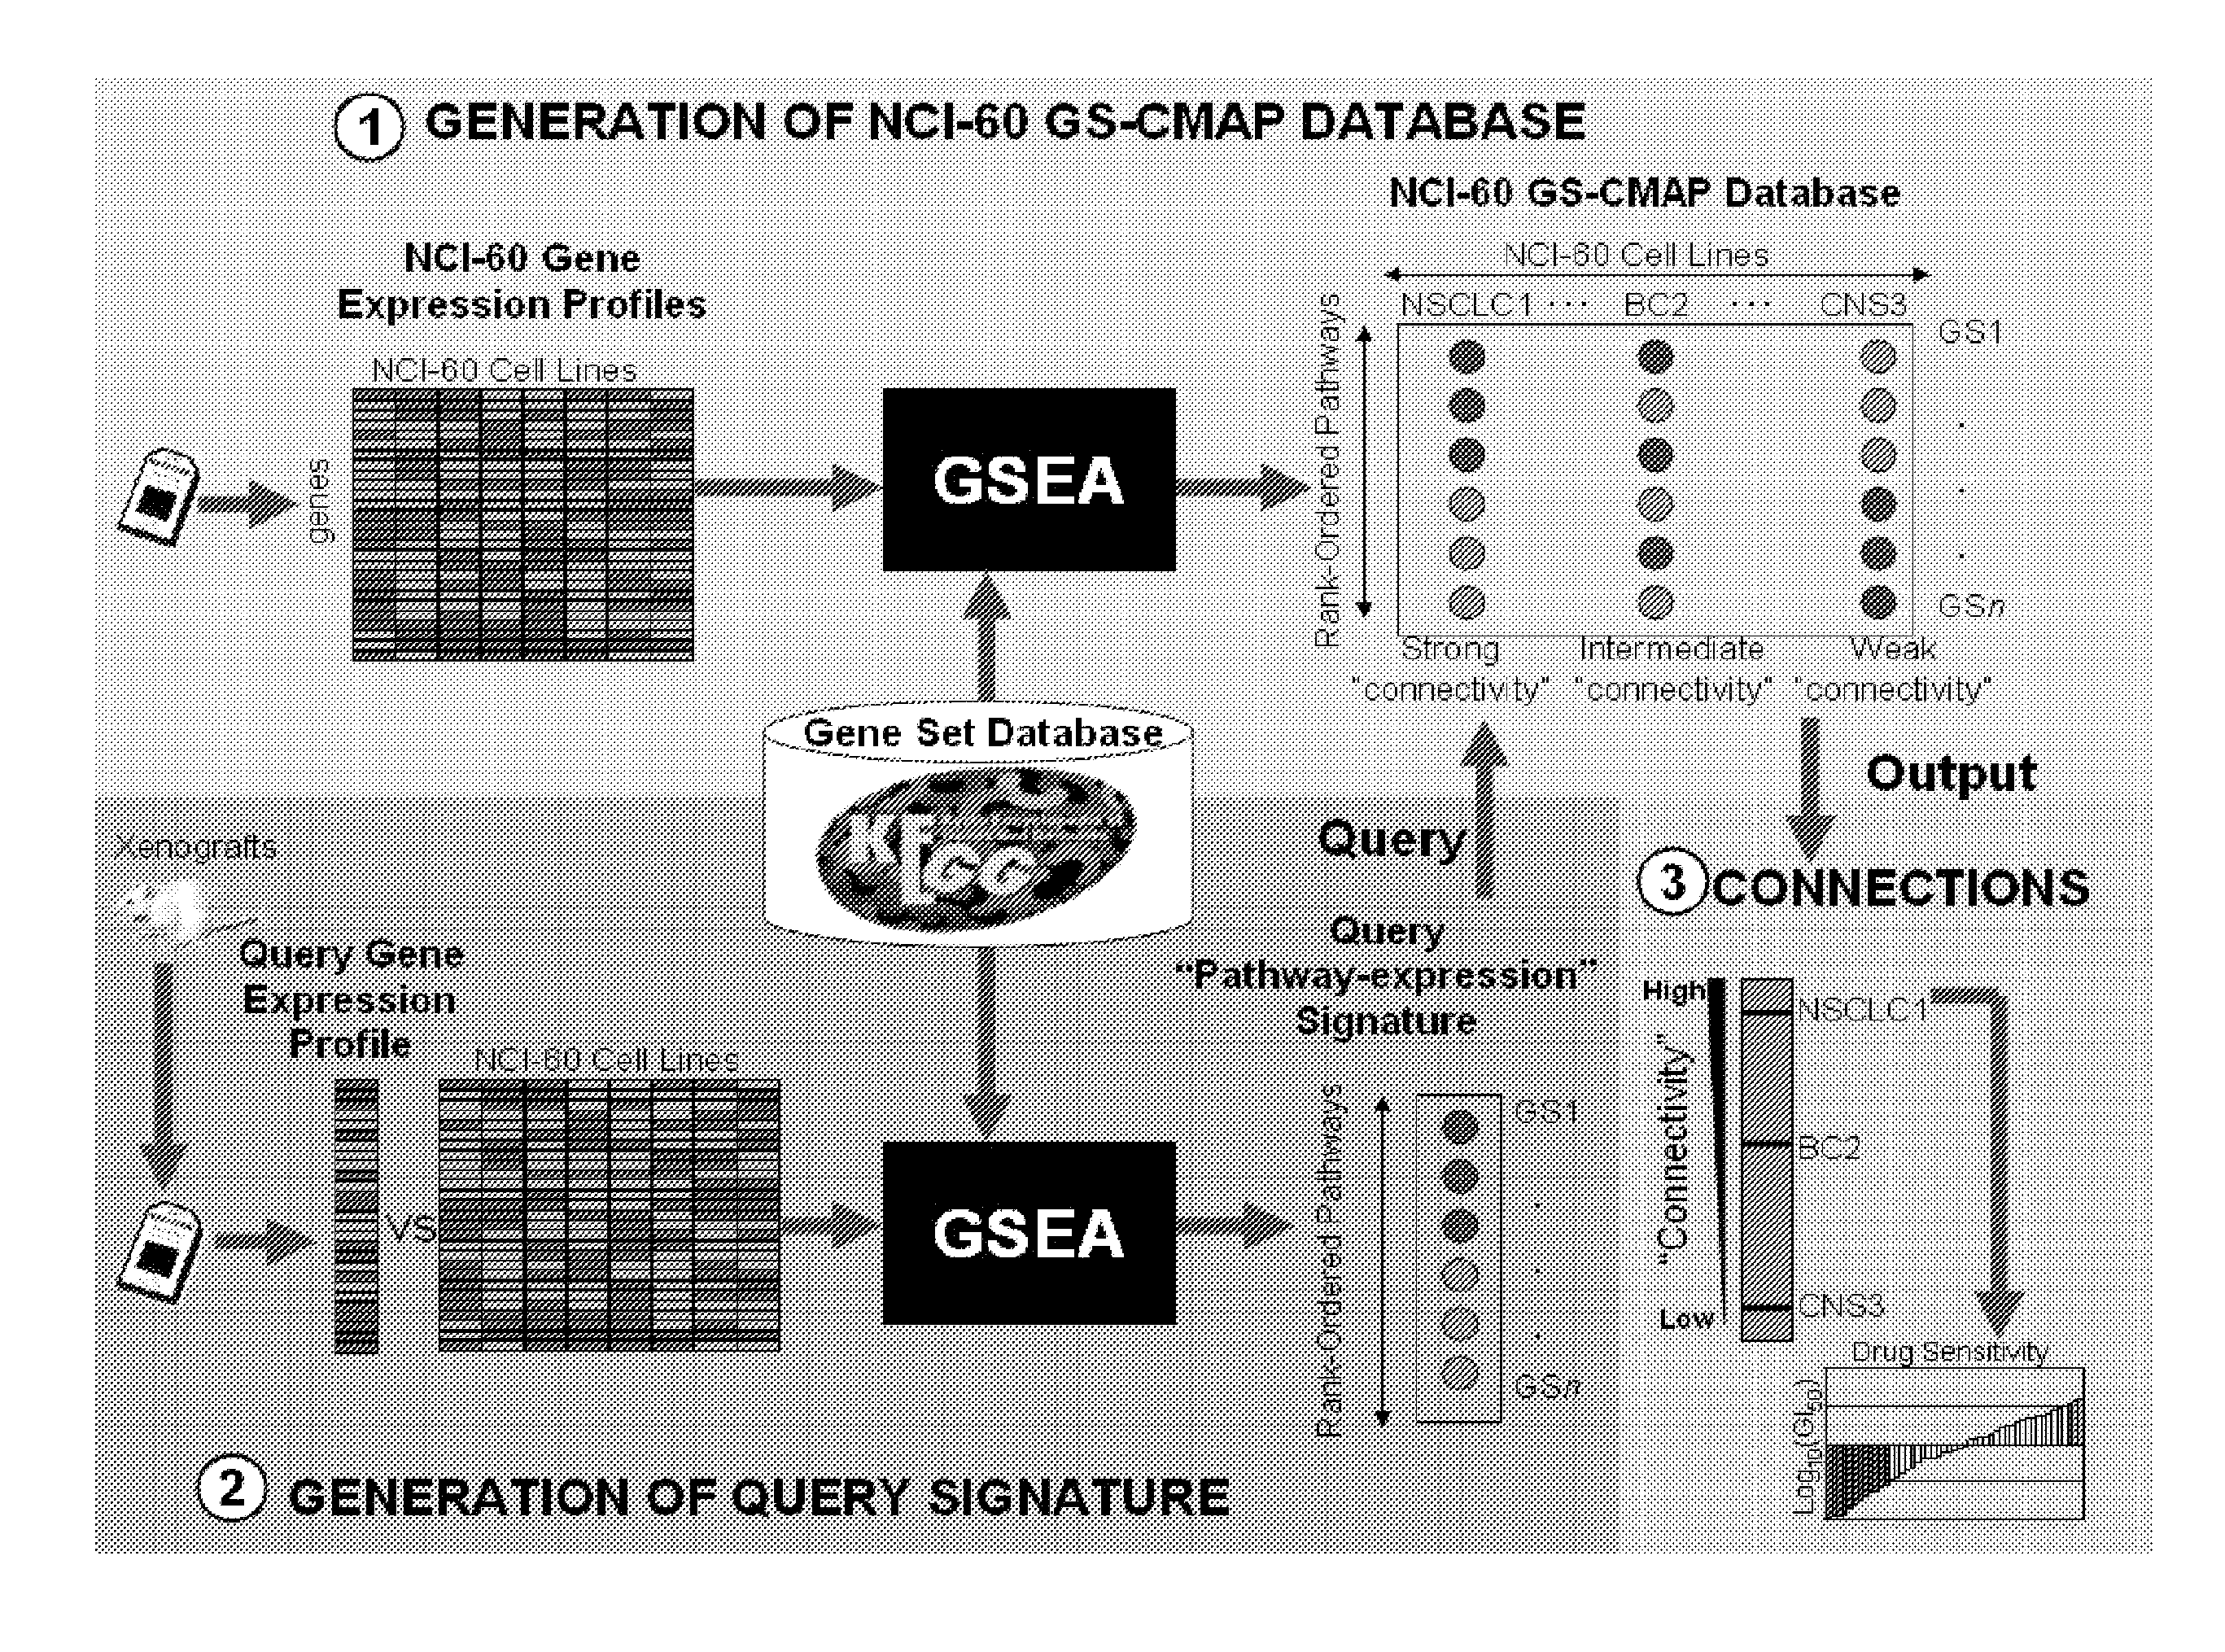
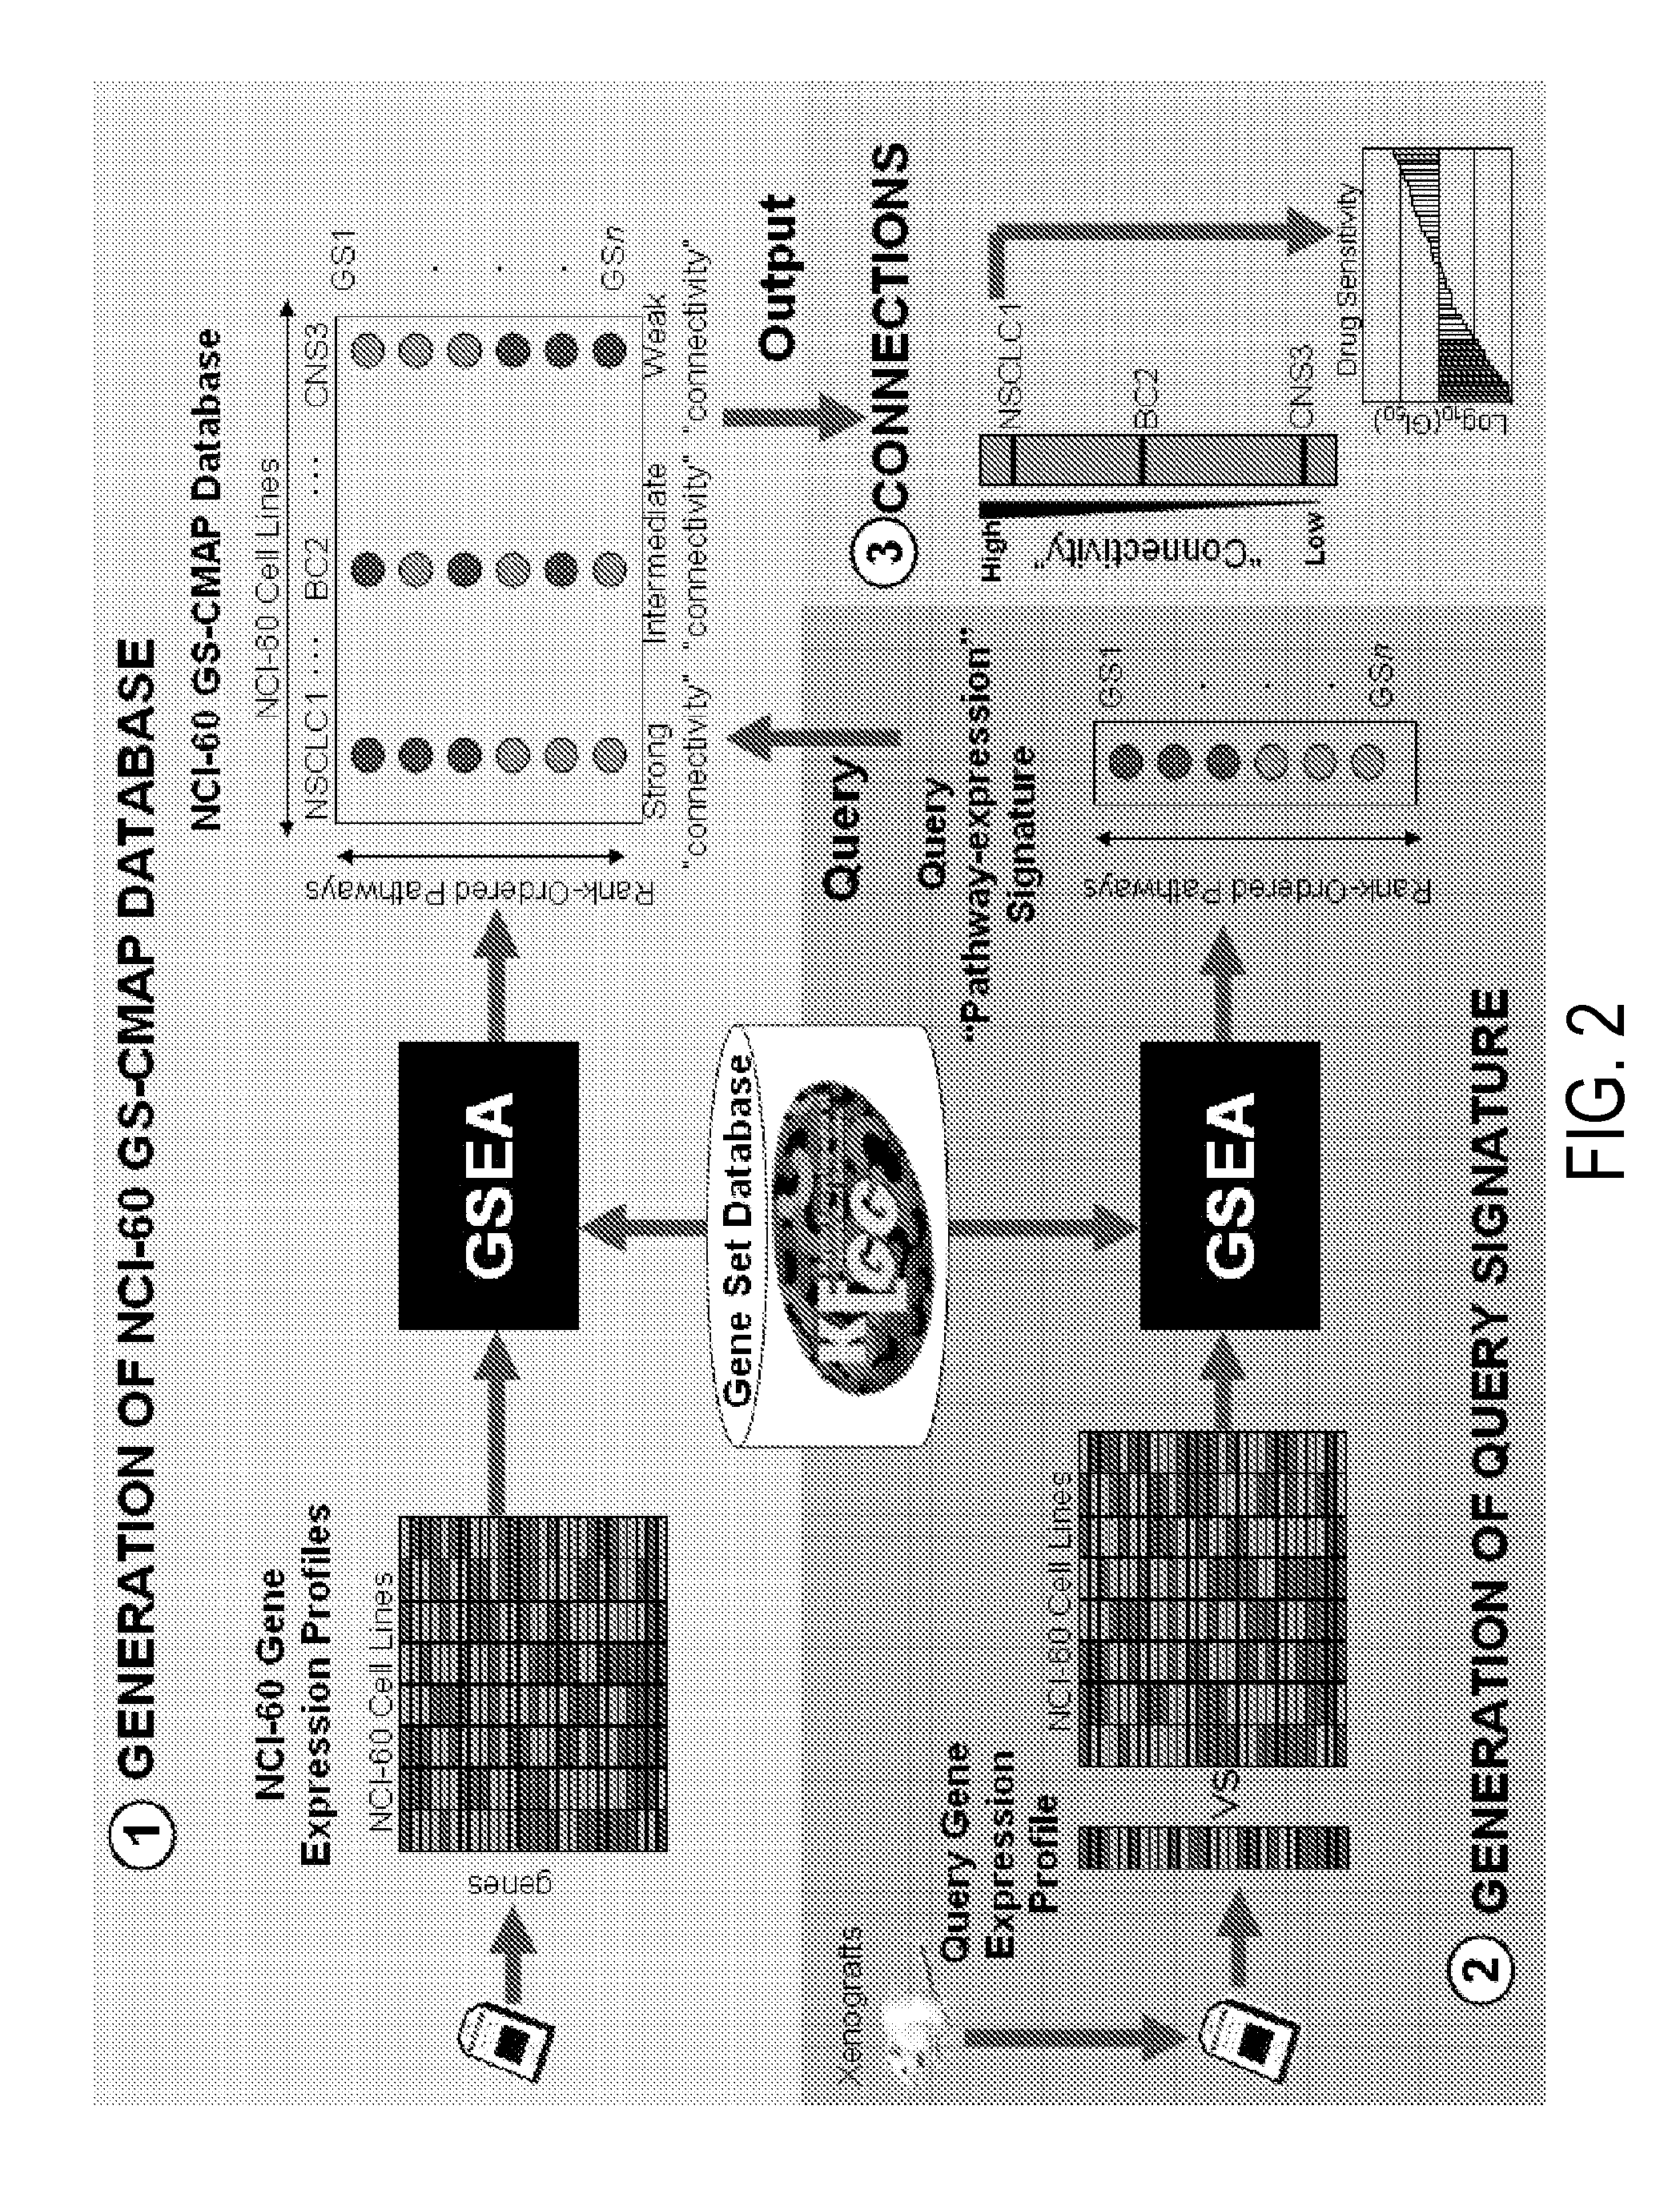
[0160]Gene Set analysis was performed using the Gene Set Enrichment Analysis (GSEA) software Version 2.0.1 obtained from the Broad Institute (http: / / www.broad.mit.edu / gsea). GSEA methodology is described in Subramanian A, Tamayo P, Mootha V K, et al: G...

example 2

Xenograft Treatment

1. Establishment of Xenografts

[0161]Four- to six-week-old female athymic (nu / nu) mice were purchased from Harlan (Harlan Laboratories, Washington, D.C.). The research protocol was approved by the Johns Hopkins University Animal Use and Care Committee and animals were maintained in accordance to guidelines of the American Association of Laboratory Animal Care. Xenografts obtained from F1 mice were excised and cut into small ˜3×3×3 mm fragments and then implanted subcutaneously in a group of five to six mice for each patient, with two small fragments in each mouse (F2) as described above for the original carcinoma. Half of the rest of the carcinoma was cryopreserved in liquid nitrogen and the other half is processed for biological studies. When the carcinoma reached a size of 1,500 mm3, they were excised, cut into ˜3×3×3 mm fragments, and transplanted to the final cohort of mice to be treated with the drugs (F3 and successive passages). Further details of the establ...

example 3

GS-CMAP for TP53 Mutational Status

[0166]In one example, pathway-expression signatures were used to compare oncogene TP53 mutants versus TP53 wild-type in the NCI-60 panel. The TP53 mutational status of the NCI-60 panel was obtained from the Cancer Genome Project of human cancer cell lines database. See Ikediobi O N, Davies H, Bignell G, et al. Mutation analysis of 24 known cancer genes in the NCI-60 cell line set. Mol Cancer Ther 5:2606-12 (2006). 44 of the 60 cell lines have at least one mutation as recorded in the database and were considered mutants. The remaining 16 cell lines have no TP53 mutations and were considered wild-type. TABLE 4 lists the TP53 mutational status for the NCI60 cell lines.

TABLE 4TP53 mutational status of the NCI-60 cell lines.TP53 wild-typeTP53 mutantsNSCLC3NSCLC1BC6RC8NSCLC5NSCLC2BC7ME3NSCLC7NSCLC4BC8ME5CCSNSCLC6OC1ME6BC1NSCLC8OC2PC1OC3NSCLC9OC4PC2LE6CC1OC5CNS1RC1CC2OC6CNS2RC3CC4LE1CNS3RC4CC5LE2CNS4RC7CC6LE3CNS5ME1CC7LE4CNS6ME2BC2LE5ME4BC3RC2ME7BC4RC5ME8B...


PUM

PropertyMeasurementUnit
sizeaaaaaaaaaa
real-timeaaaaaaaaaa
timeaaaaaaaaaa

Abstract

The present invention comprises a treatment approach based on gene set-expression signatures that systematically connects a sample to a profile from a reference database to extrapolate the most effective therapeutic agent. Further disclosed are methods to optimize combination treatments.

Description

CROSS-REFERENCE[0001]This application claims the benefit of U.S. Provisional Application 61 / 065,667, filed Feb. 14, 2008 and titled “Gene Expression-based Perturbability Assay to Identify Novel Targets and to Personalize Anticancer Therapy”; U.S. Provisional Application 61 / 035,503, filed Mar. 11, 2008 and titled “Method of Using Molecular Mimicry to Connect Pathway-based Gene Expression Profiles to Drug Sensitivity”; and U.S. Provisional Application 61 / 118,740, filed Dec. 1, 2008 and titled “Method of Using Molecular Mimicry to Connect Pathway-based Gene Expression Profiles to Drug Sensitivity”; which applications are incorporated herein by reference. This application claims the benefit of PCT Patent Application PCT / US09 / 34056, filed Feb. 13, 2009 and titled “Methods to Connect Gene Set Expression Profiles to Drug Sensitivity,” which application is incorporated herein by reference.STATEMENT AS TO FEDERALLY SPONSORED RESEARCH[0002]This invention was made with the support of the Unite...

Claims


Application Information

Patent Timeline
Patent Type & Authority Applications(United States)
IPC IPC(8): A61K31/7068C12Q1/68C40B30/00A61K31/337A61K31/4353A61P35/00
CPCC12Q1/6809A61P35/00
Inventor HIDALGO, MANUELJIMENO, ANTONIOTAN, AIK CHOON
Owner THE JOHN HOPKINS UNIV SCHOOL OF MEDICINE
Why Eureka
Try Eureka