

Quality control of agricultural products based on gene expression
a technology of gene expression and quality control, applied in the direction of microbiological testing/measurement, sugar derivatives, biochemistry apparatus and processes, etc., can solve the problems of no prediction of future quality, only marginal determination of batch differences in quality, and consequently hardly exploited
- Summary
- Abstract
- Description
- Claims
- Application Information
AI Technical Summary
Benefits of technology
Problems solved by technology
Method used
Image

Examples
example 1
Quality Assay for Determining Cold Tolerance in Fagaceae, Exemplified by Fagus sylvatica L. Seedlings (Beech)
1.1 Indicator Genes
[0233]A set of 29 indicator genes (SEQ ID NO: 1-29) have been selected whose expression profile can be used as measurement for cold tolerance level of beech seedlings.
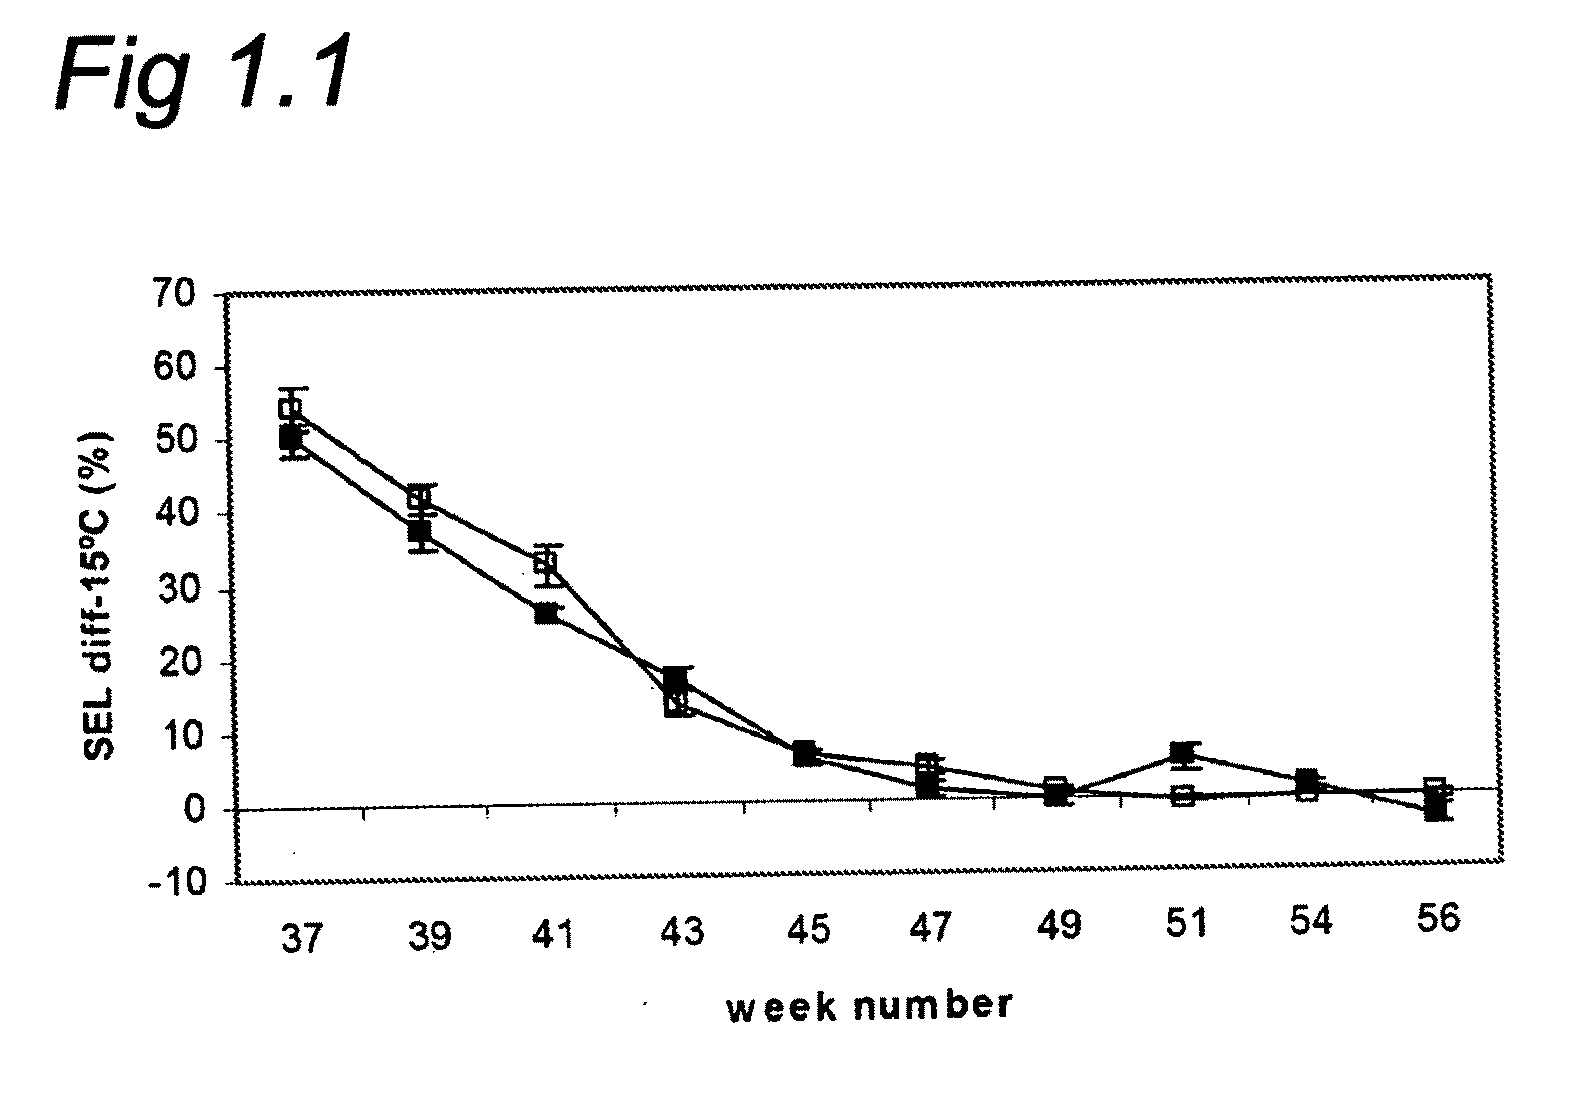
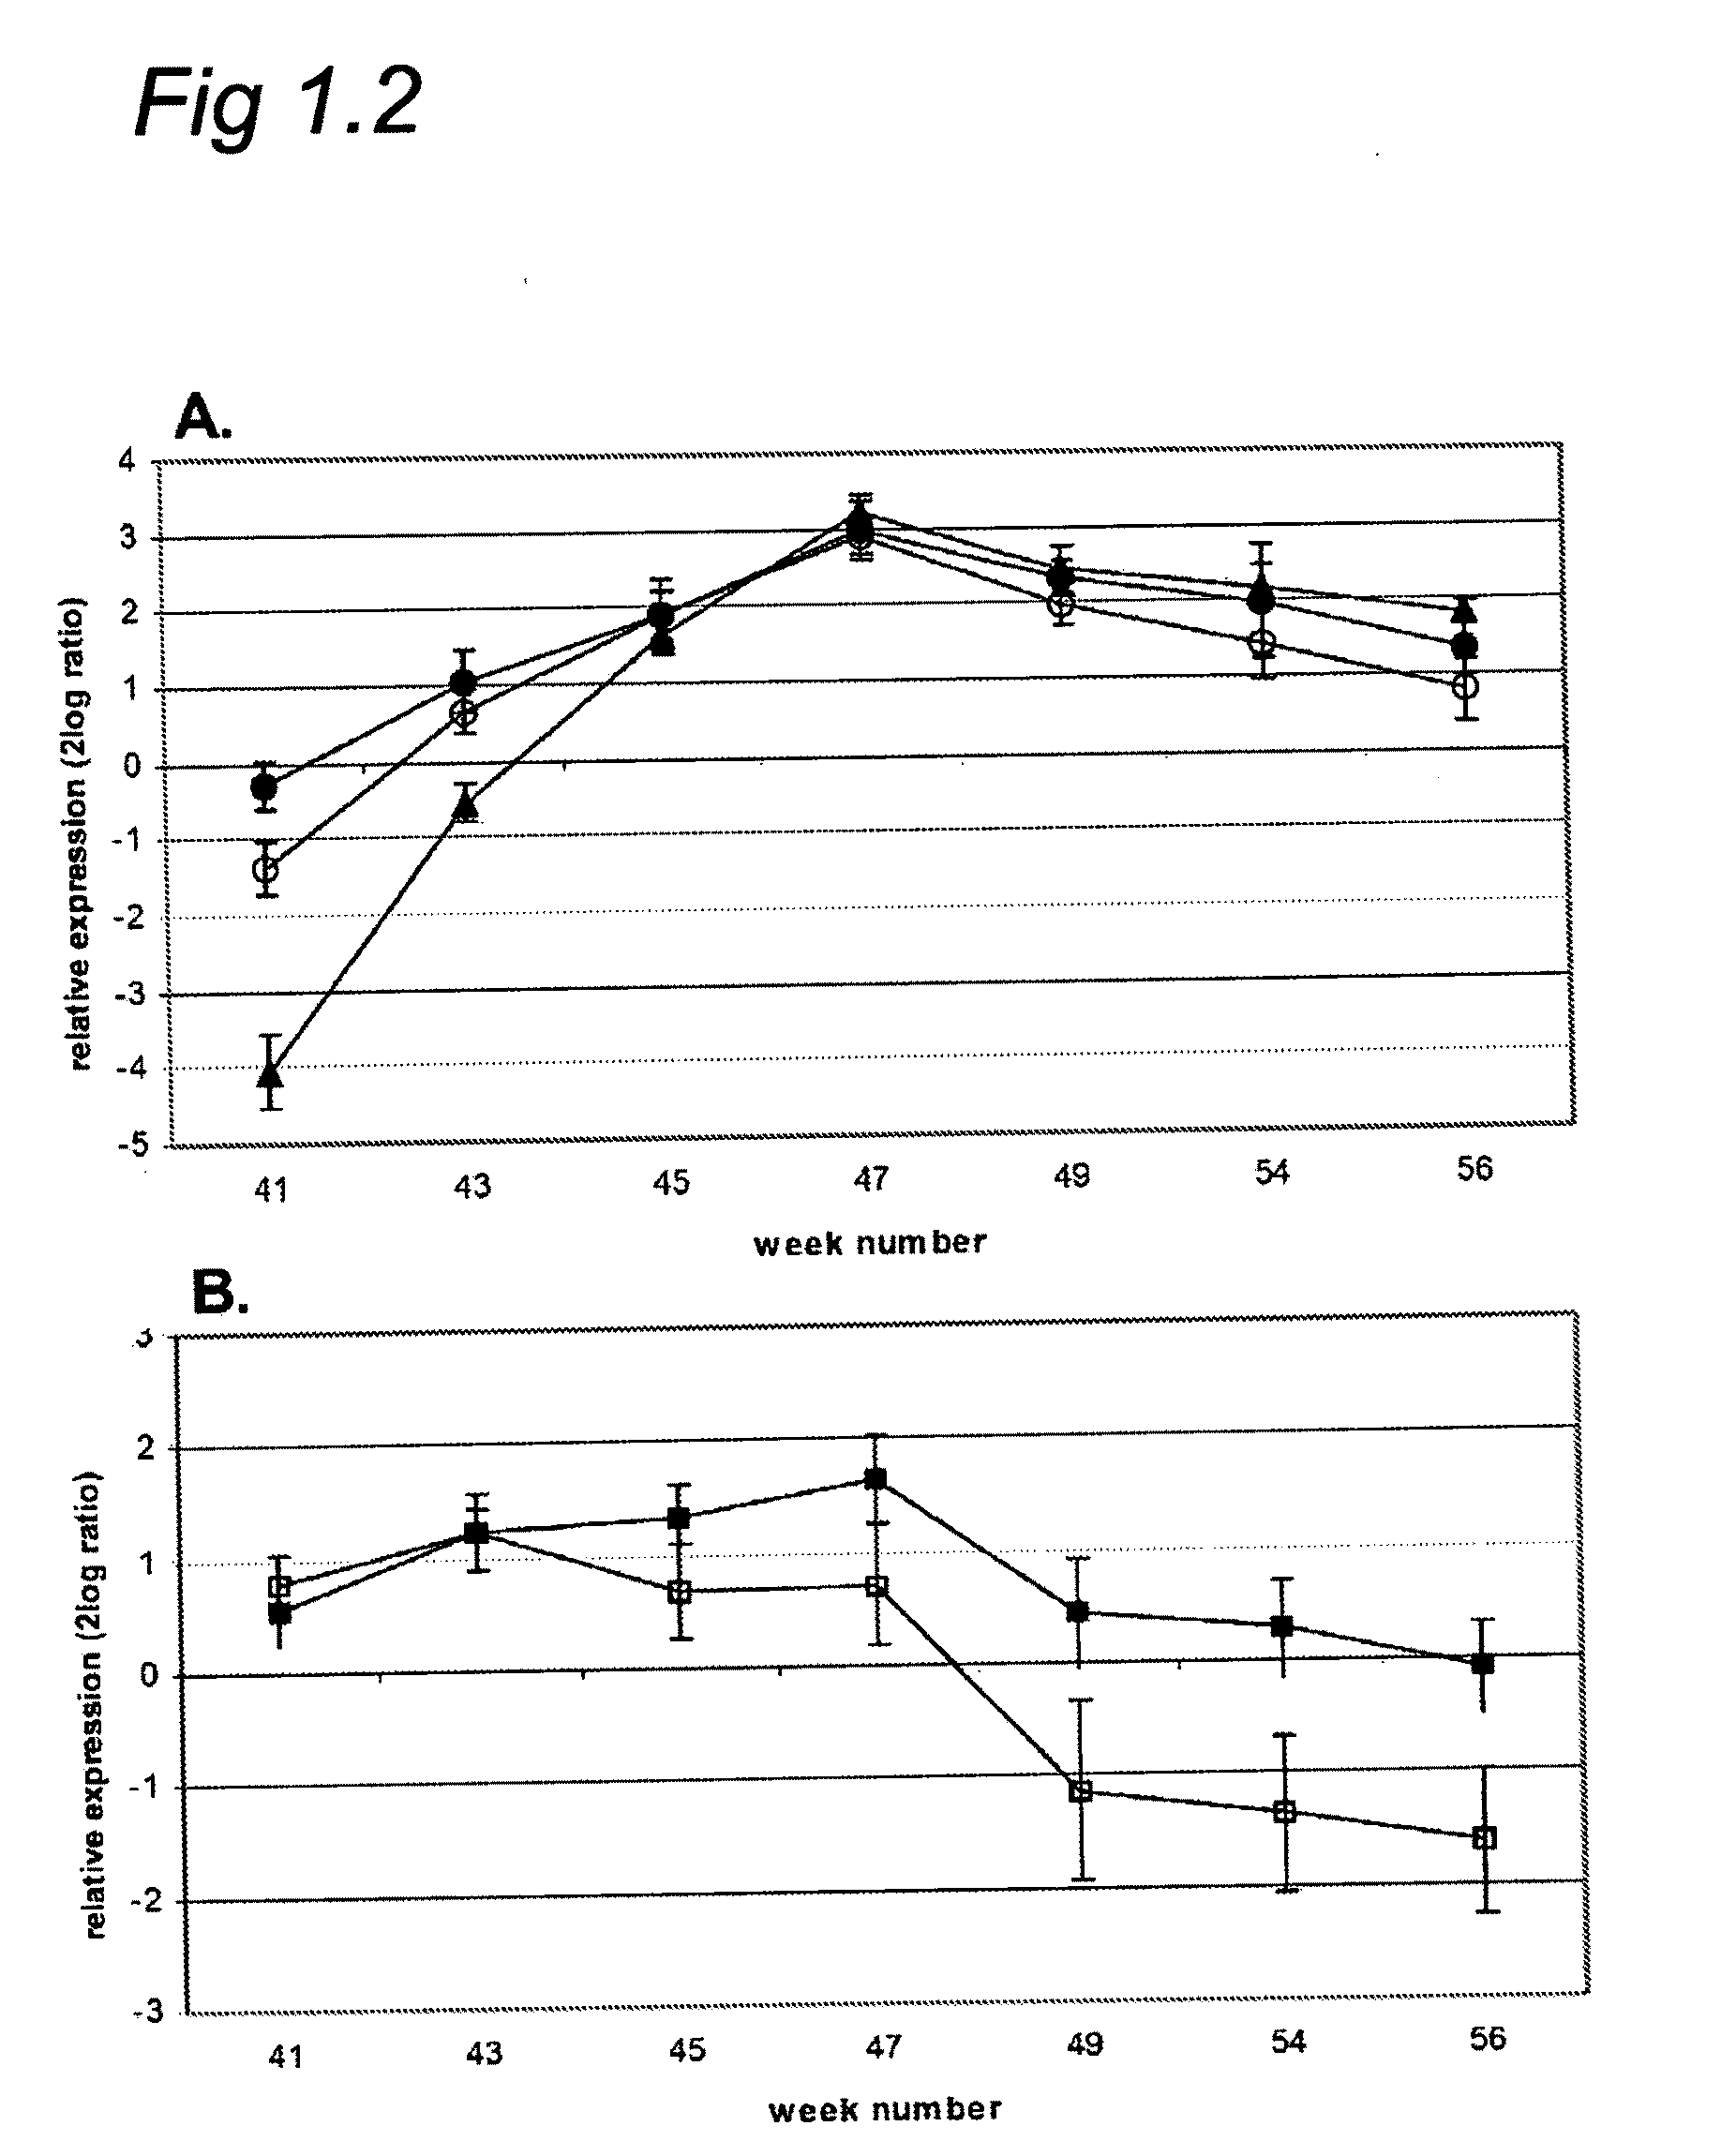
[0234]Based on the expression level of the described genes conclusions can be drawn about the level of frost tolerance that is reached in beech seedlings. As soon as the expression of the frost tolerance related genes stabilises at high levels, frost tolerance has reached the maximal level (FIGS. 1.1 and 1.2).
[0235]FIG. 1.1. shows typical frost tolerance pattern of two batches of one-year-old beech seedlings, planted at two different locations (Scotland, black squares and Denmark, open squares), season 2001 / 2002. Tolerance is defined as percentage of electrolyte leakage (SEL) as a result of freezing until −15° C. When SEL diff-values fall below 10%, seedlings are considered to be completely fr...
example 2
A Method for Determining the Ripening Stage of Pears, Exemplified by Pyrus communis L. cv Conference
2.1 Indicator Genes
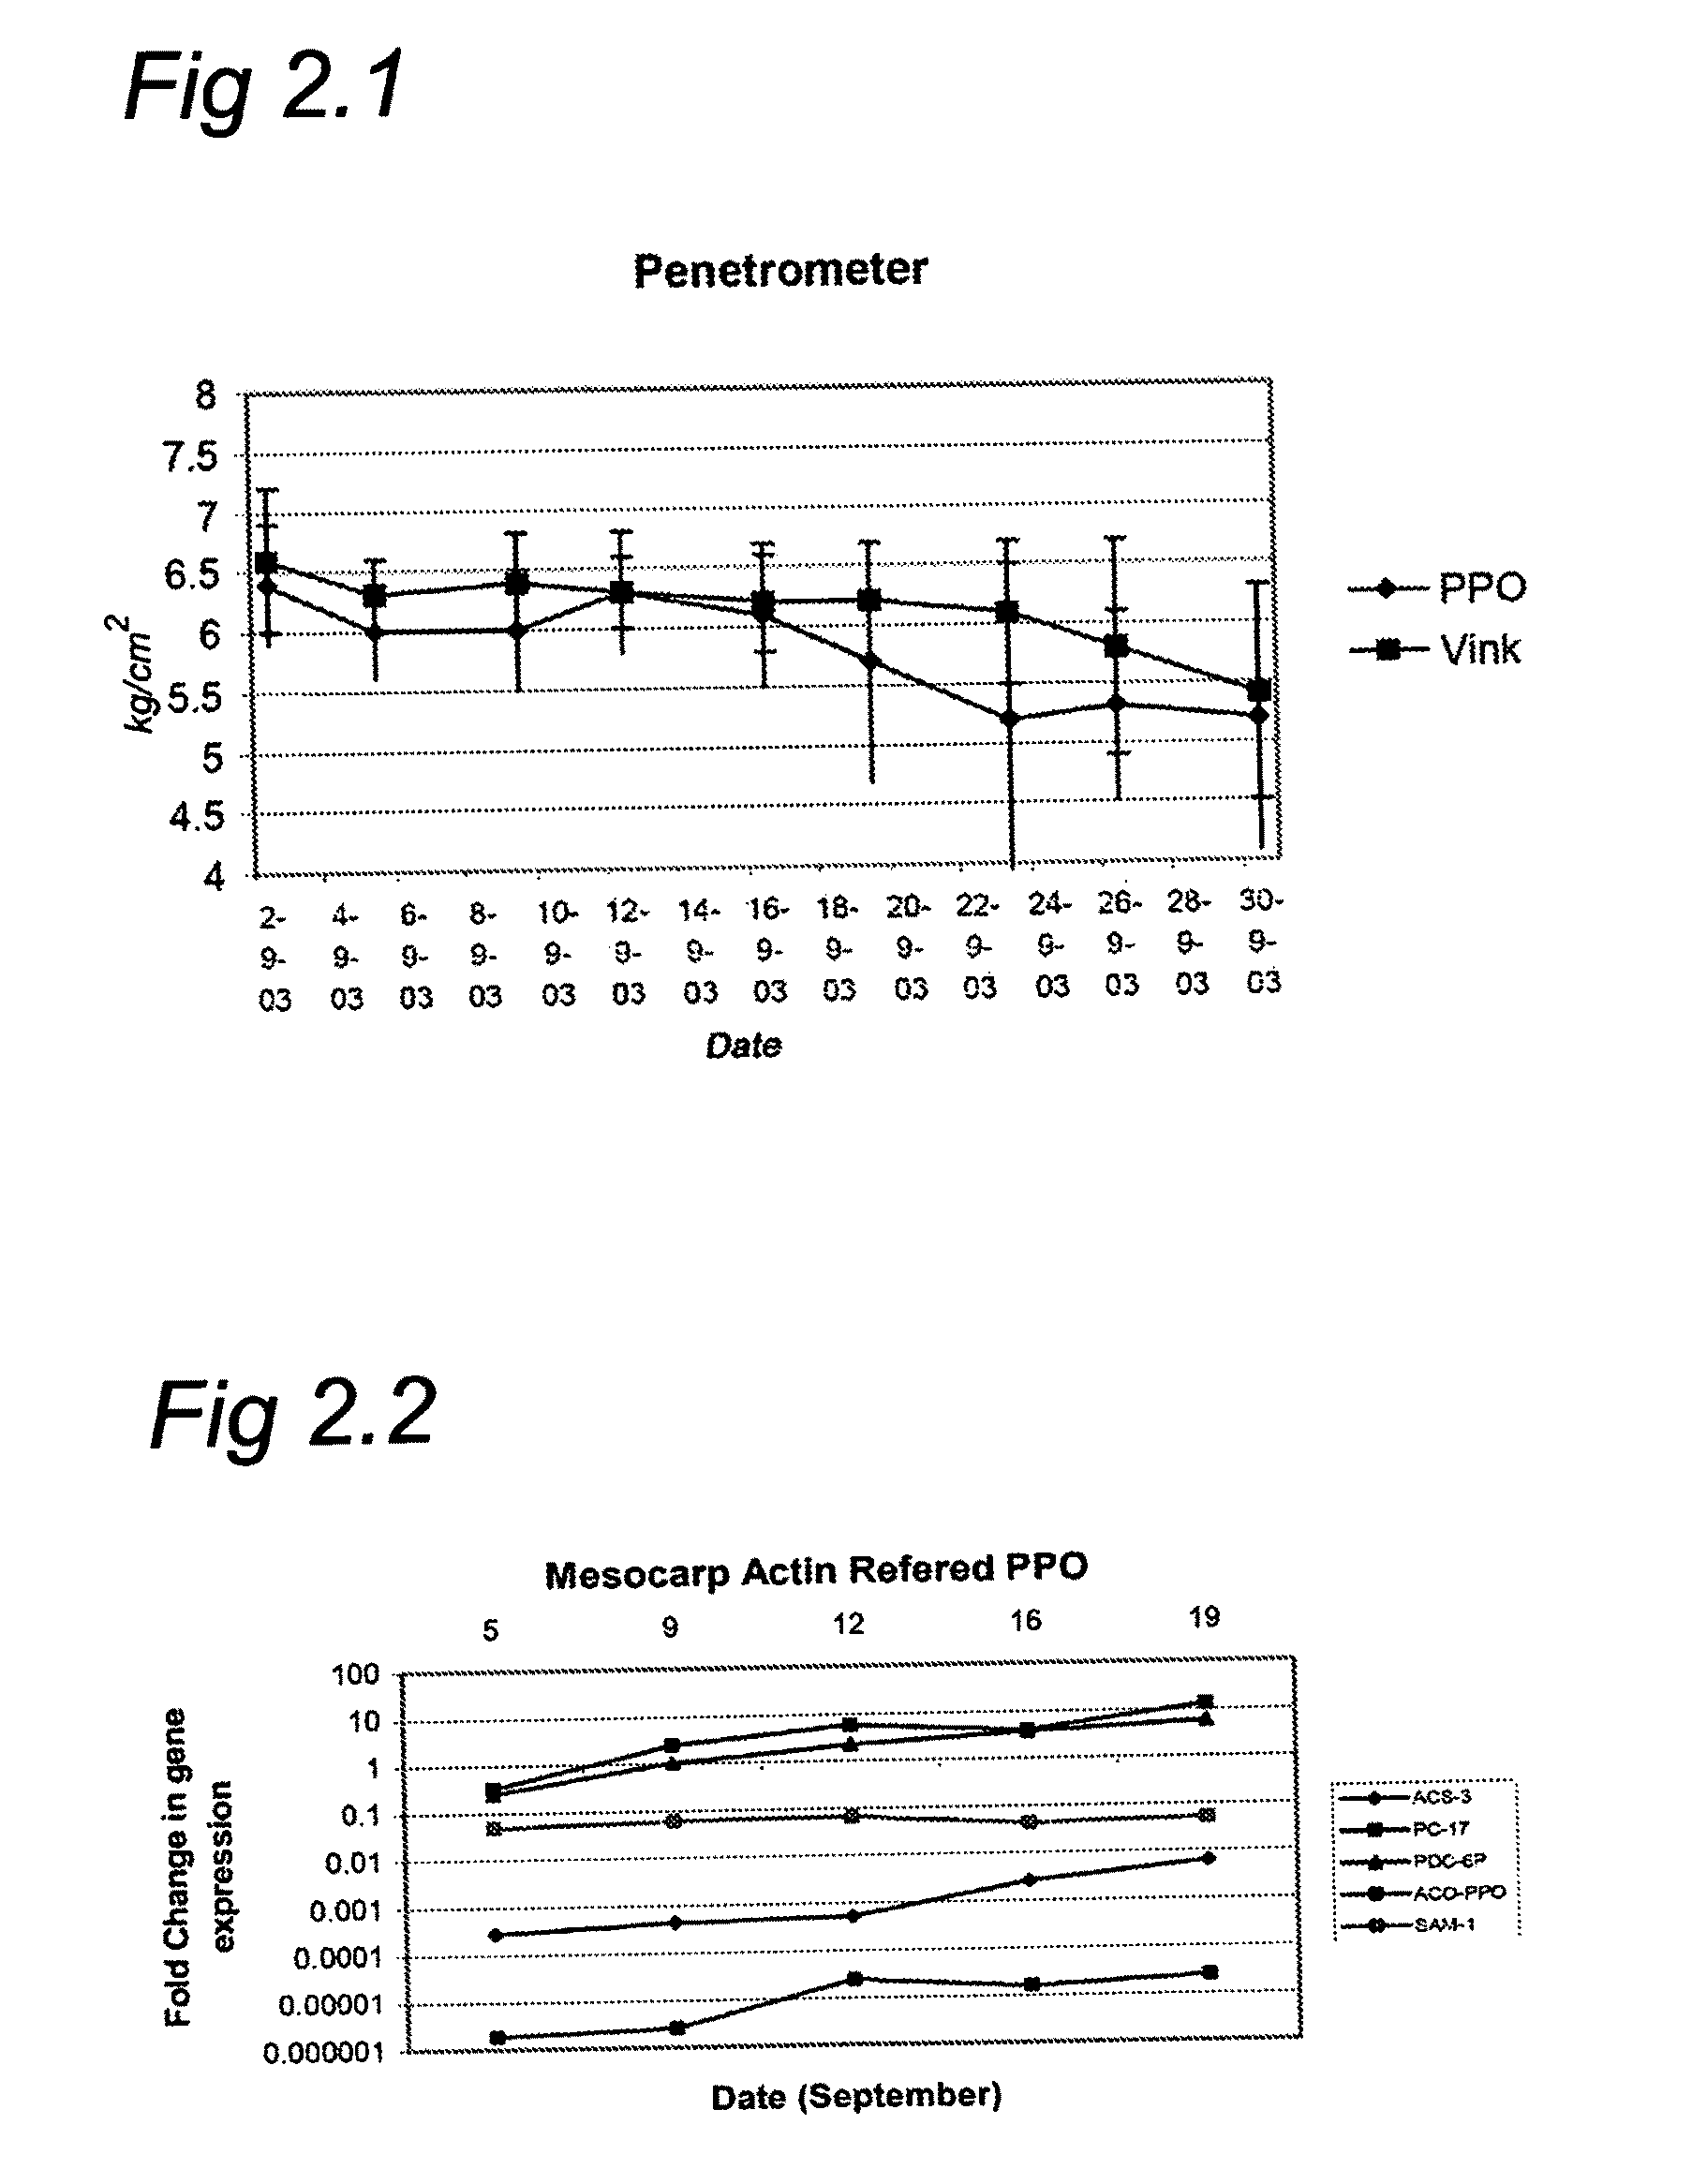
[0246]Comparison of expression levels of a set of 5 genes, SEQ ID NO: 42-46, in various batches of pears gives information about relative ripening stages. This method is much more informative than firmness measurements (FIGS. 2.1 and 2.2). Discrimination between batches is possible in cases where firmness measurements fail. The data in FIGS. 2.1 and 2.2 show that during the test period the firmness hardly changes but expression of all genes, except SAM-1, increased 10 to 100 fold. The test can also be used to check the effect of storage conditions on the produce.
[0247]FIG. 2.3. shows a result of the validation of the test in practice. Based on the expression data of the indicated genes, ripening phases can be defined. This typical example shows two orchards, from two different growers, which exhibit clear differences in ripening up until 11th of September. These dif...
example 3
A Sensitive Method for Measuring Sensory Decay of Fruit, Exemplified by Apples
3.1 Indicator Genes
[0257]In an experimental approach in which transcriptional profiling (using microarrays) was combined with sensory analysis and physiological measurements a set of 20 genes was selected (SEQ ID NO: 57-76) that can be used for early warning of quality decay. In the experiments quality loss was induced by storage at a temperature of 18° C., whereas normal storage temperature is 4° C.
[0258]Relative expression levels of the selected genes can be used to determine whether a batch of apples is approaching a status of quality loss. Analyzing the genes provides better insight in quality loss than sensory analysis or firmness measurements. Two batches of apples were tested with the three different methods mentioned. FIG. 3.1 shows the result of the sensory analysis. From this plot it becomes clear that after one week storage at suboptimal temperature (18° C.) differences with apples stored at opt...
PUM
| Property | Measurement | Unit |
|---|---|---|
| Fraction | aaaaa | aaaaa |
| Molar density | aaaaa | aaaaa |
| Molar density | aaaaa | aaaaa |
Abstract
Description
Claims
Application Information