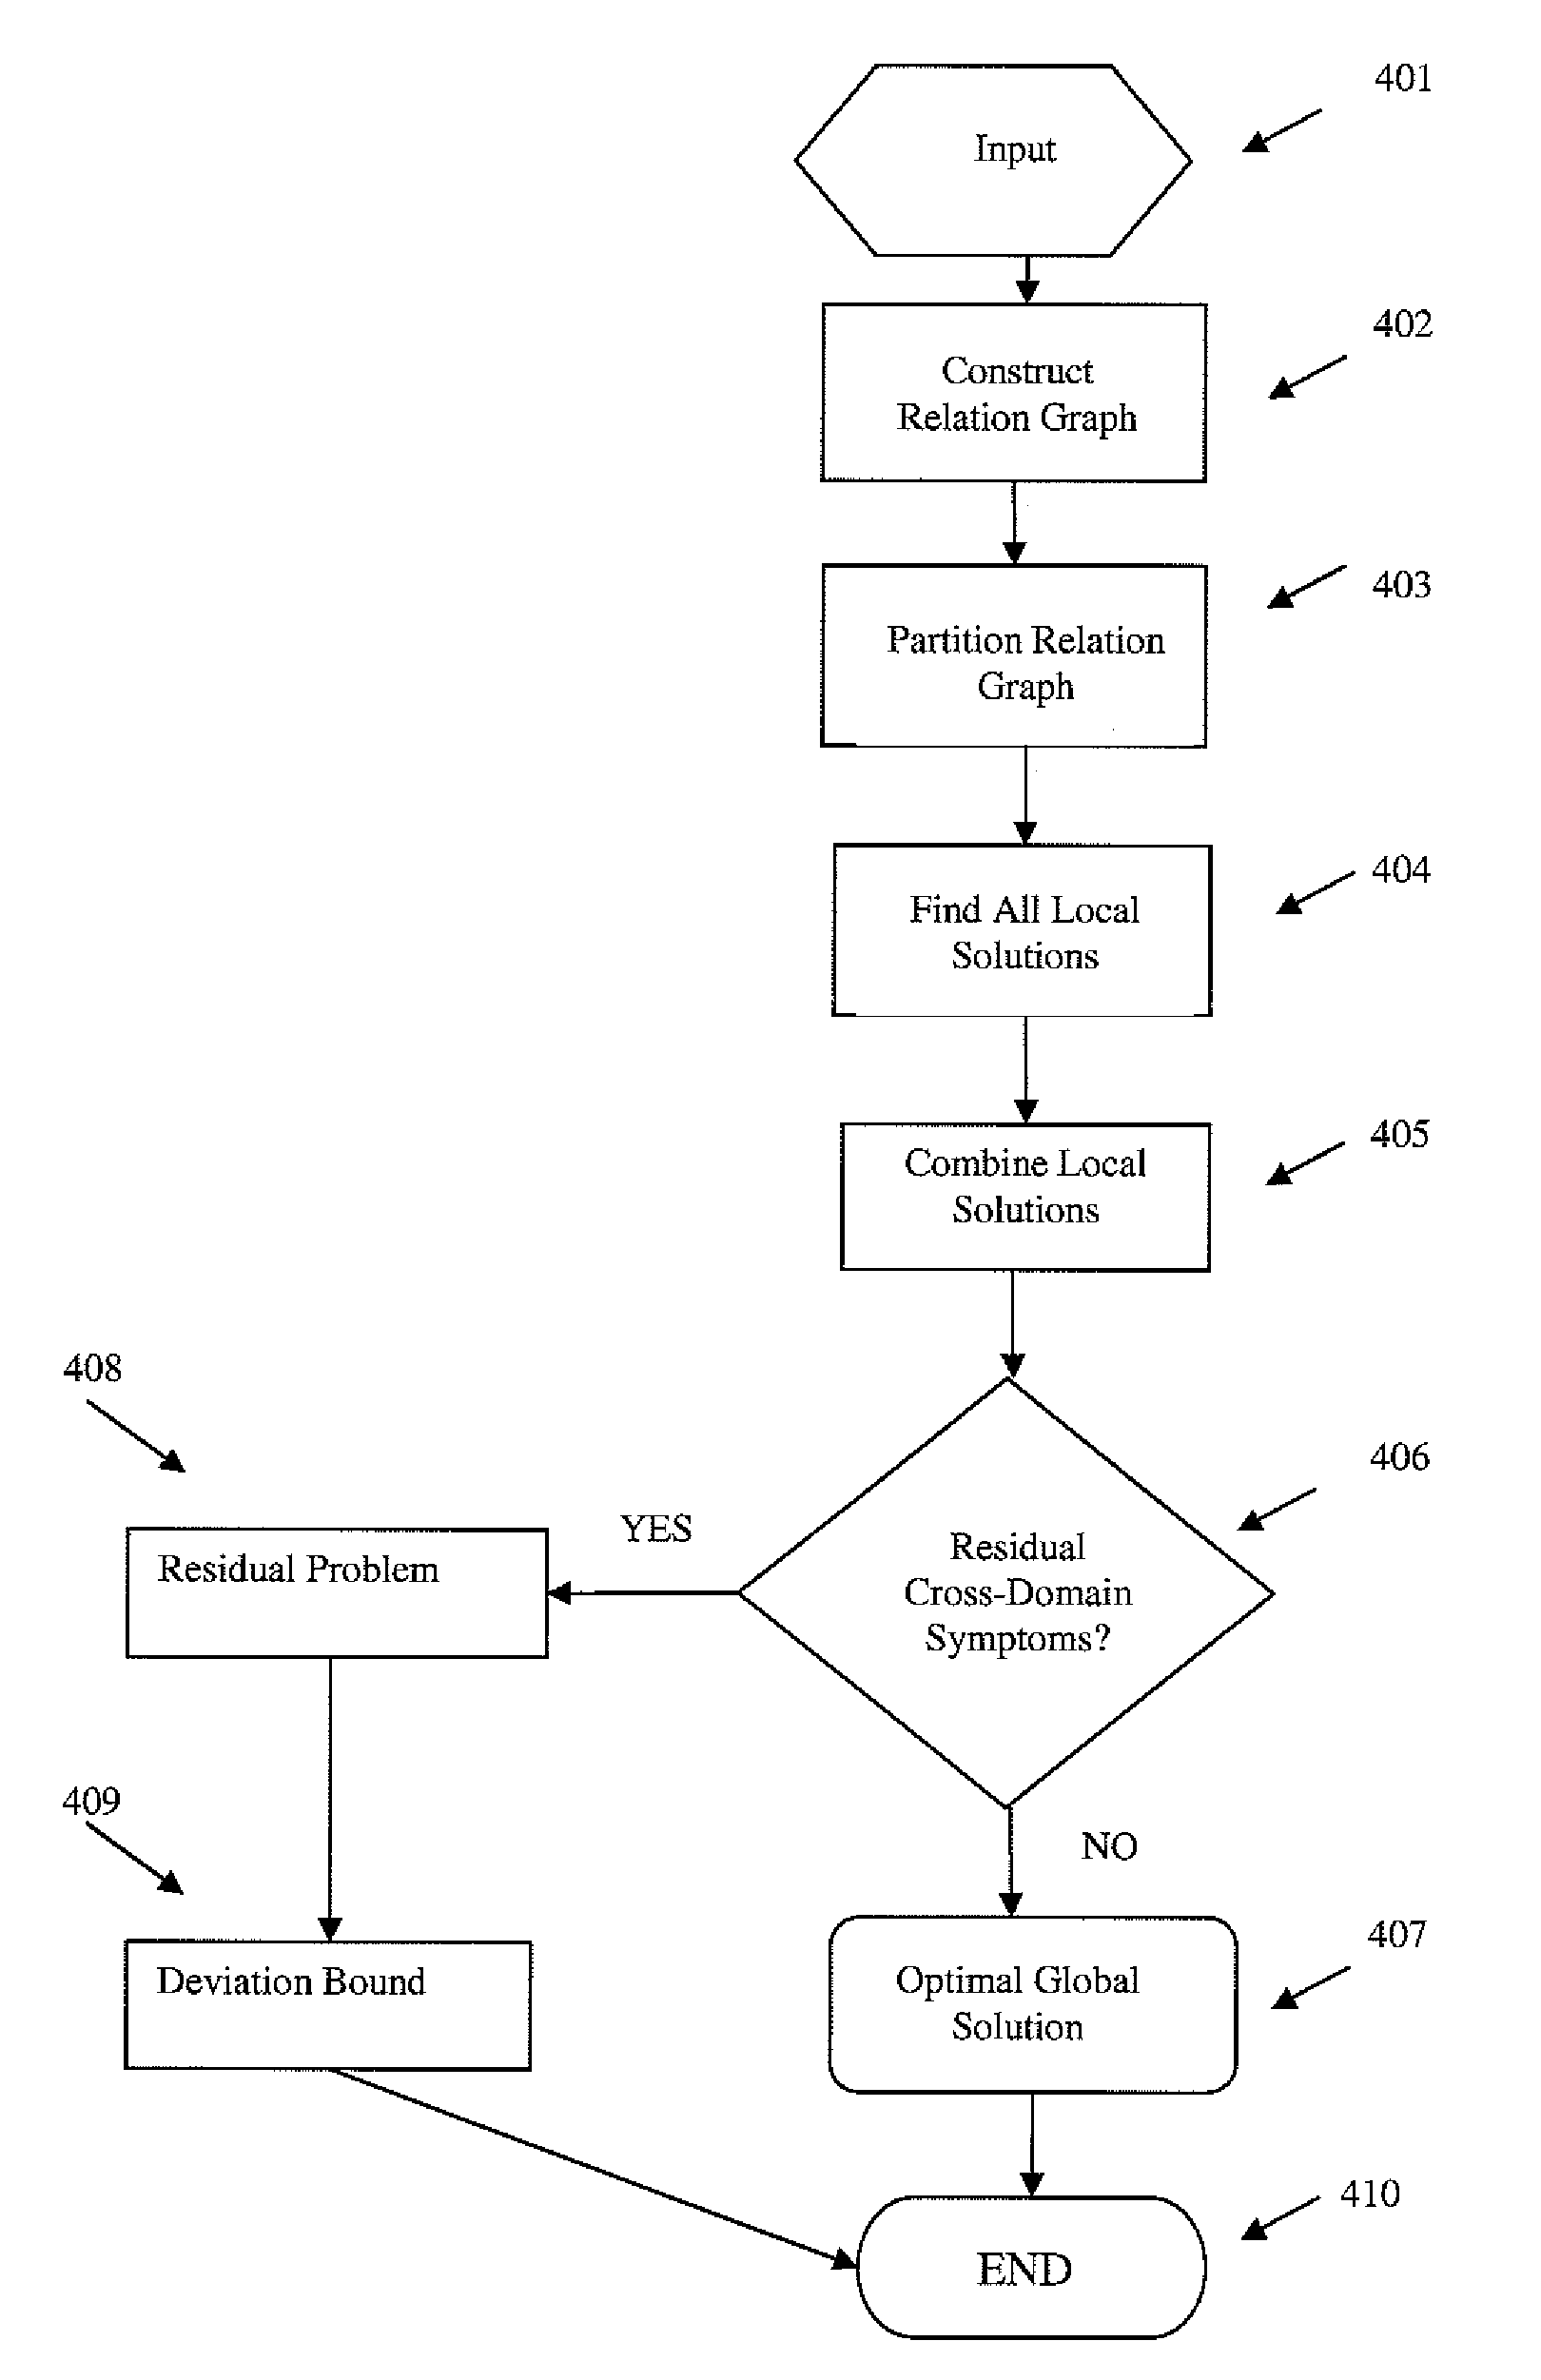
[0015]Next, the
relation graph is partitioned into several ‘computational domains’, with roughly equal numbers of nodes in each domain, while minimizing the number of relational links that bridge separate domains (which correspond to ‘cross-domain’ symptoms). Each domain includes only a subset of the objects (which, upon failure, are termed faults) and the symptoms they produce upon failure. Graph partitioning is a well-studied problem of
graph theory, for which are various fast algorithms even for graphs with thousands of nodes. See, for example, B. Hendrickson, R. Leland, “A Multilevel
Algorithm for Partitioning Graphs”, Supercomputing 95, Proceedings of the IEEE / ACM SC95 Conference, 1995. In partitioning the
relational graph, each relational link (which corresponds to one or more symptoms) is assigned a weight equal to the sum, taken over the symptoms represented by the relational link, of the reciprocal of the number of distinct object-pairs that produce each such symptom. This choice of weights is intended as an aid to achieving the objective of minimizing the number of cross-domain symptoms in the partition. The size of each domain (the number of objects assigned to it) is chosen to be the largest value for which computations for the local diagnosis in each domain can be carried out in a reasonable length of time by a centralized
algorithm, i.e., one which works with knowledge of the portion of the
fault propagation model pertaining to the faults and symptoms in the domain. The number of domains into which the problem needs to be partitioned thus depends on the largest problem size that can be handled in a single domain.
[0016]One could either obtain a fixed partitioning of the relation graph of the original bipartite model, comprising all the potential faults and their symptoms, or adapting the partitioning to the particular instance of the graph that comprises only the actually observed symptoms and all the faults that constitute their potential causes in each realized
scenario. In the latter case, the relation graph that is sought to be partitioned into loosely-coupled domains corresponds to the actual observed symptoms in each
scenario of the occurrence of faults and symptoms. Owing to the randomness in occurrences of faults, one expects, on the whole, that such an adaptive partitioning of the realized graph, matching the partitioning to the observed symptoms, offers a higher probability of being able to find a partition that minimizes the presence of cross-domain symptoms. Thus, an innovative element of our approach is to create virtual ‘computational domains’ for each realization of the
fault propagation model, grouping faults into these domains solely for the sake of computational efficiency, with no necessary connection to the geographical location of the elements that, upon failure, become faults. Thus, our approach to distributed computation is based on the idea of arranging for a suitable domain-partition that minimizes the overlap between domains, which increases the likelihood of finding a provably optimal global solution by the mere selection of a combination of optimal local solutions of the individual domains.
[0018]First, each individual domain determines all its optimum local solutions, ignoring all of its cross-domain symptoms. If all faults have the same probability of occurrence, an optimal solution is a minimal set of faults that ‘covers’ (explains) all the observed local symptoms. This is a standard ‘set covering’ problem that can be solved by commercial
integer programming solvers. This procedure is easily adapted to the case where faults have different probabilities of occurrence.
[0020]If the partitioning of the relation graph into individual domains turns out to contain cross-domain symptoms, then a check is made to see whether a combination of optimal local solutions, one from each domain, can also ‘cover’ all the cross-domain symptoms. This is accomplished by solving a maximum set cover problem, i.e., by finding a combination of optimal local solutions, one from each domain that maximizes the number of cross-domain symptoms that are explained. If a collection of such optimal local solutions, one from each domain, obtained by ignoring cross-domain symptoms, nevertheless manages to explain all the cross-domain symptoms as well, then again, such a collection is a proven optimal global solution made up of
local optimum solutions.

