[0003]As the field of renewable power / renewable energy systems grows, monitoring the performance and output of these systems on an ongoing basis becomes more important for the following reasons: 1) it helps quantify to the system owner the exact benefits of the system; 2) it informs the system owner or
service provider of issues so that they can be resolved quickly, reducing wasted generation capacity; and 3) it provides data which over time can be used to improve
renewable energy system design and performance.
[0008]It cannot be overstated how important it is that renewable energy solar systems perform as close to optimally as possible. A system which produces
electricity valued at $3,000 per year, which has a 10% degradation that can easily be fixed (e.g. through cleaning) loses $300 per year. Given the 25+ year life of the system (and without accounting for inflation in the value of
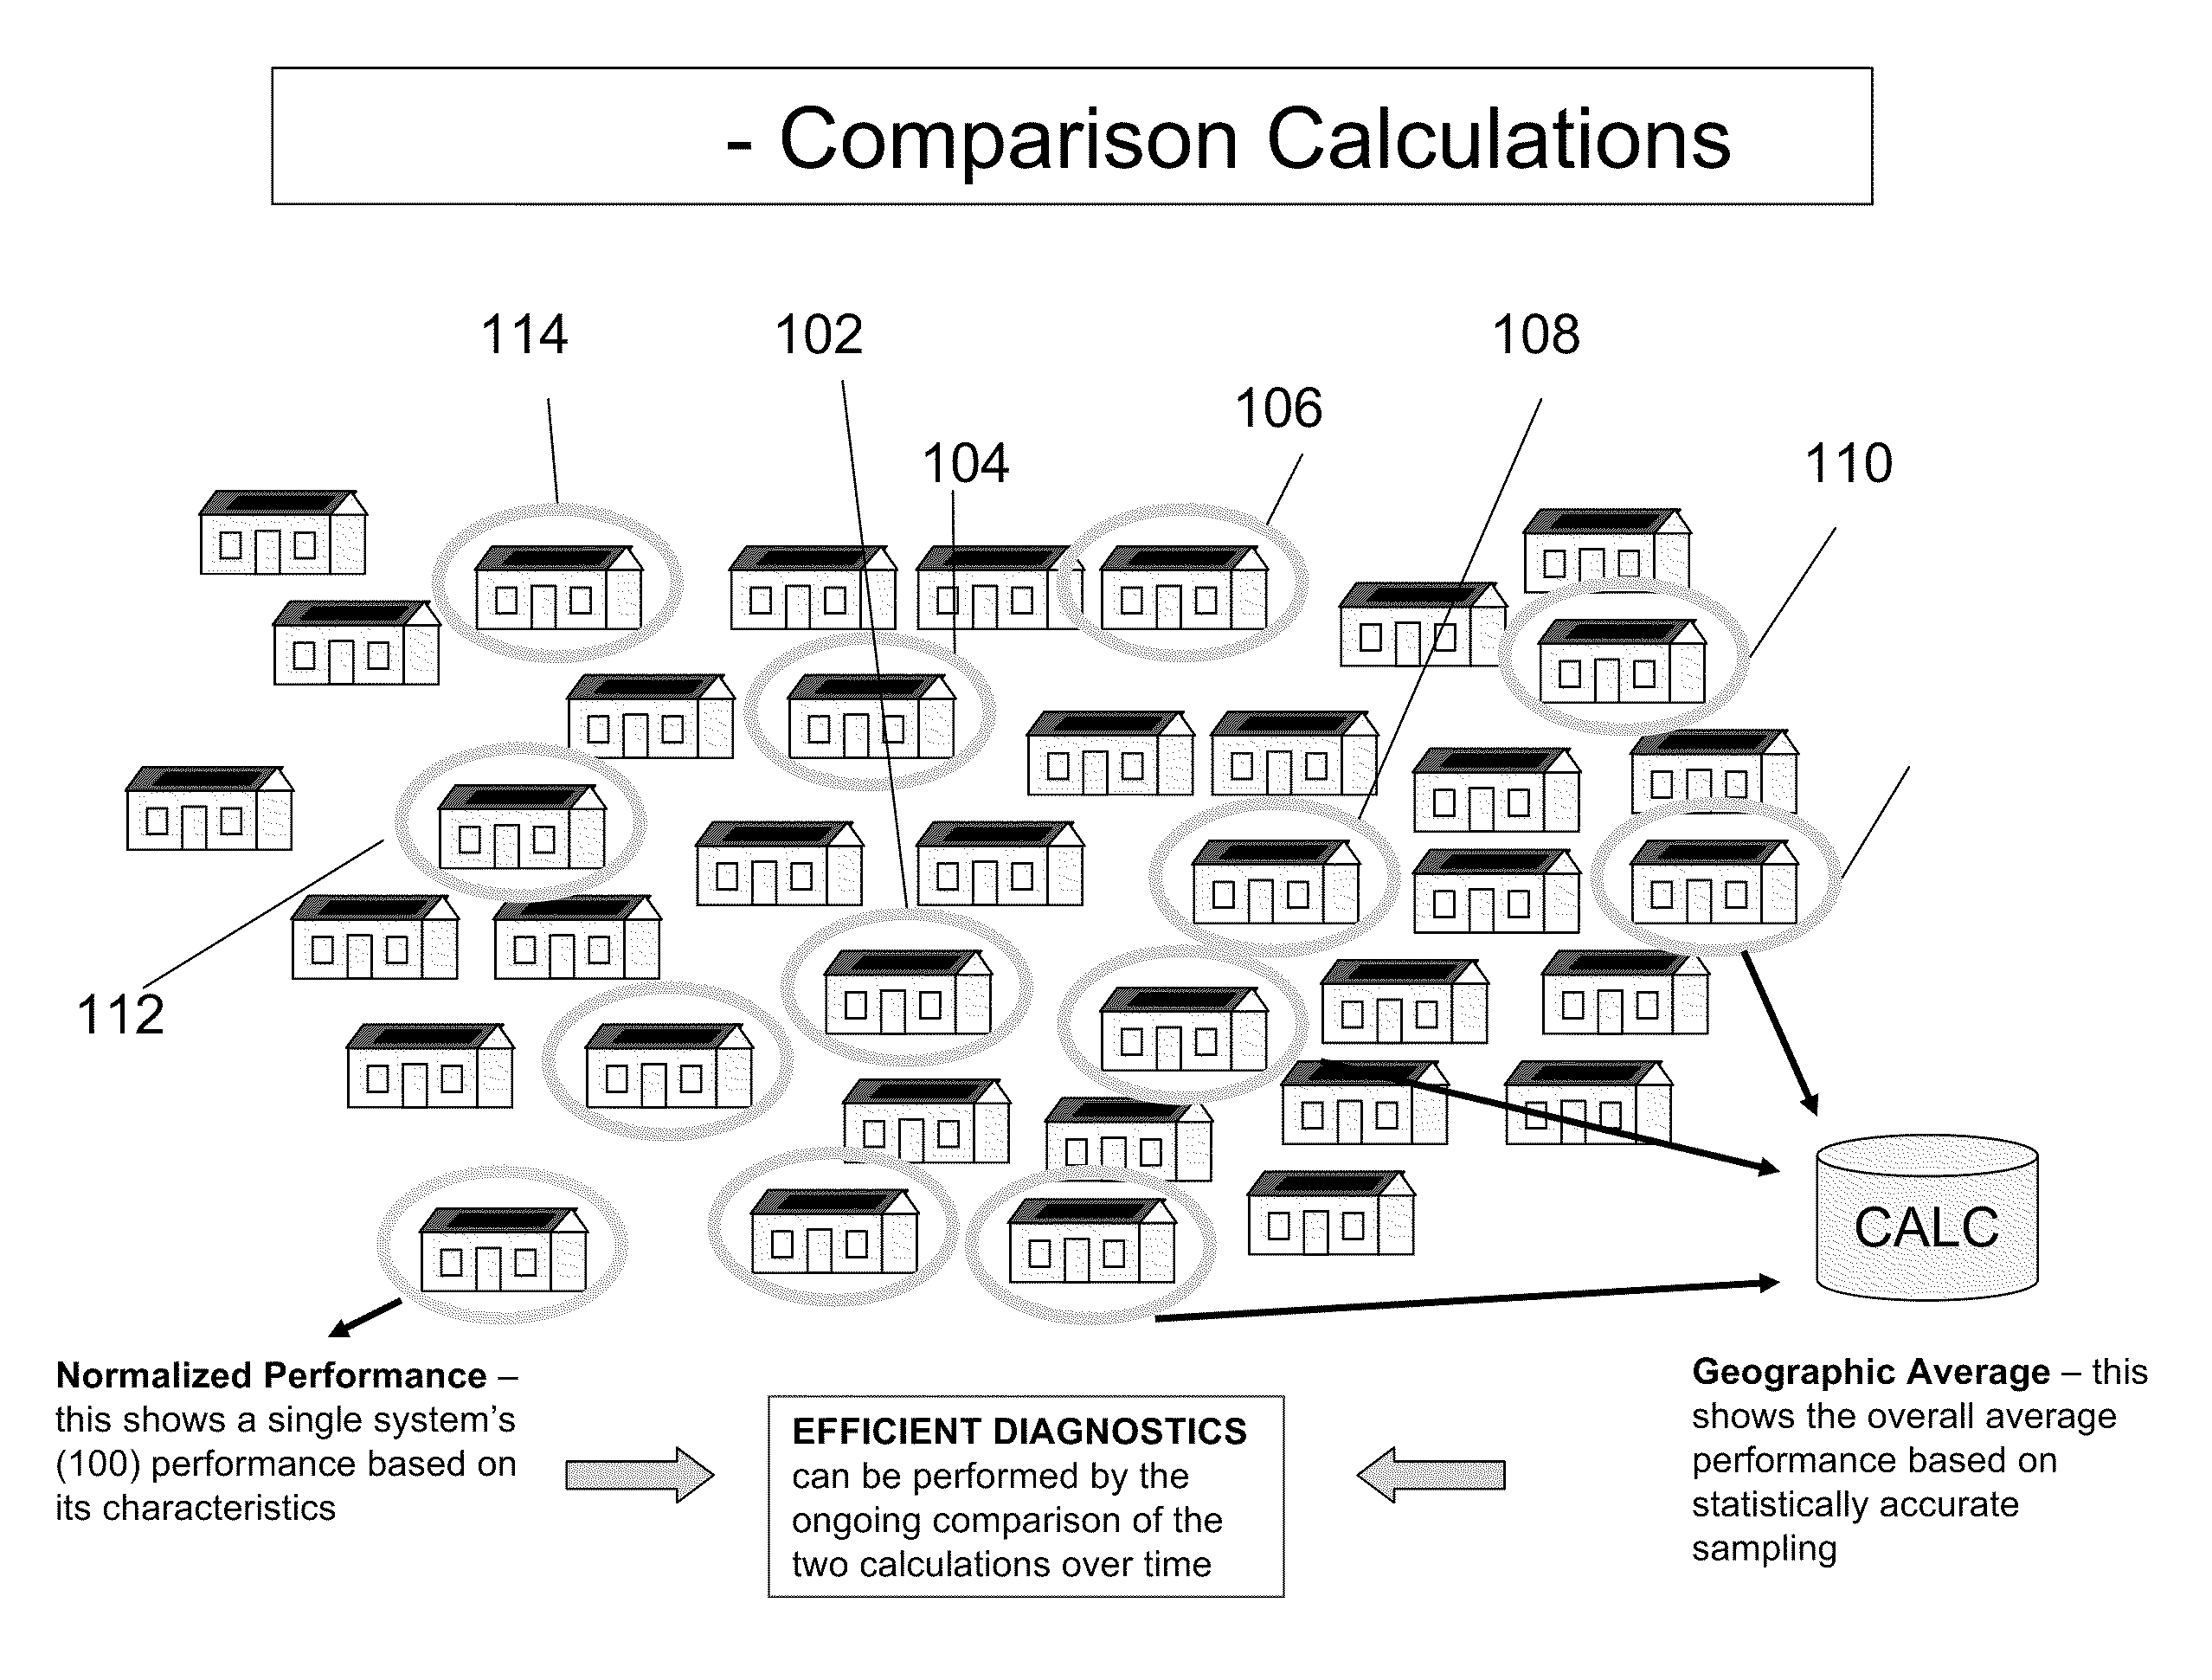
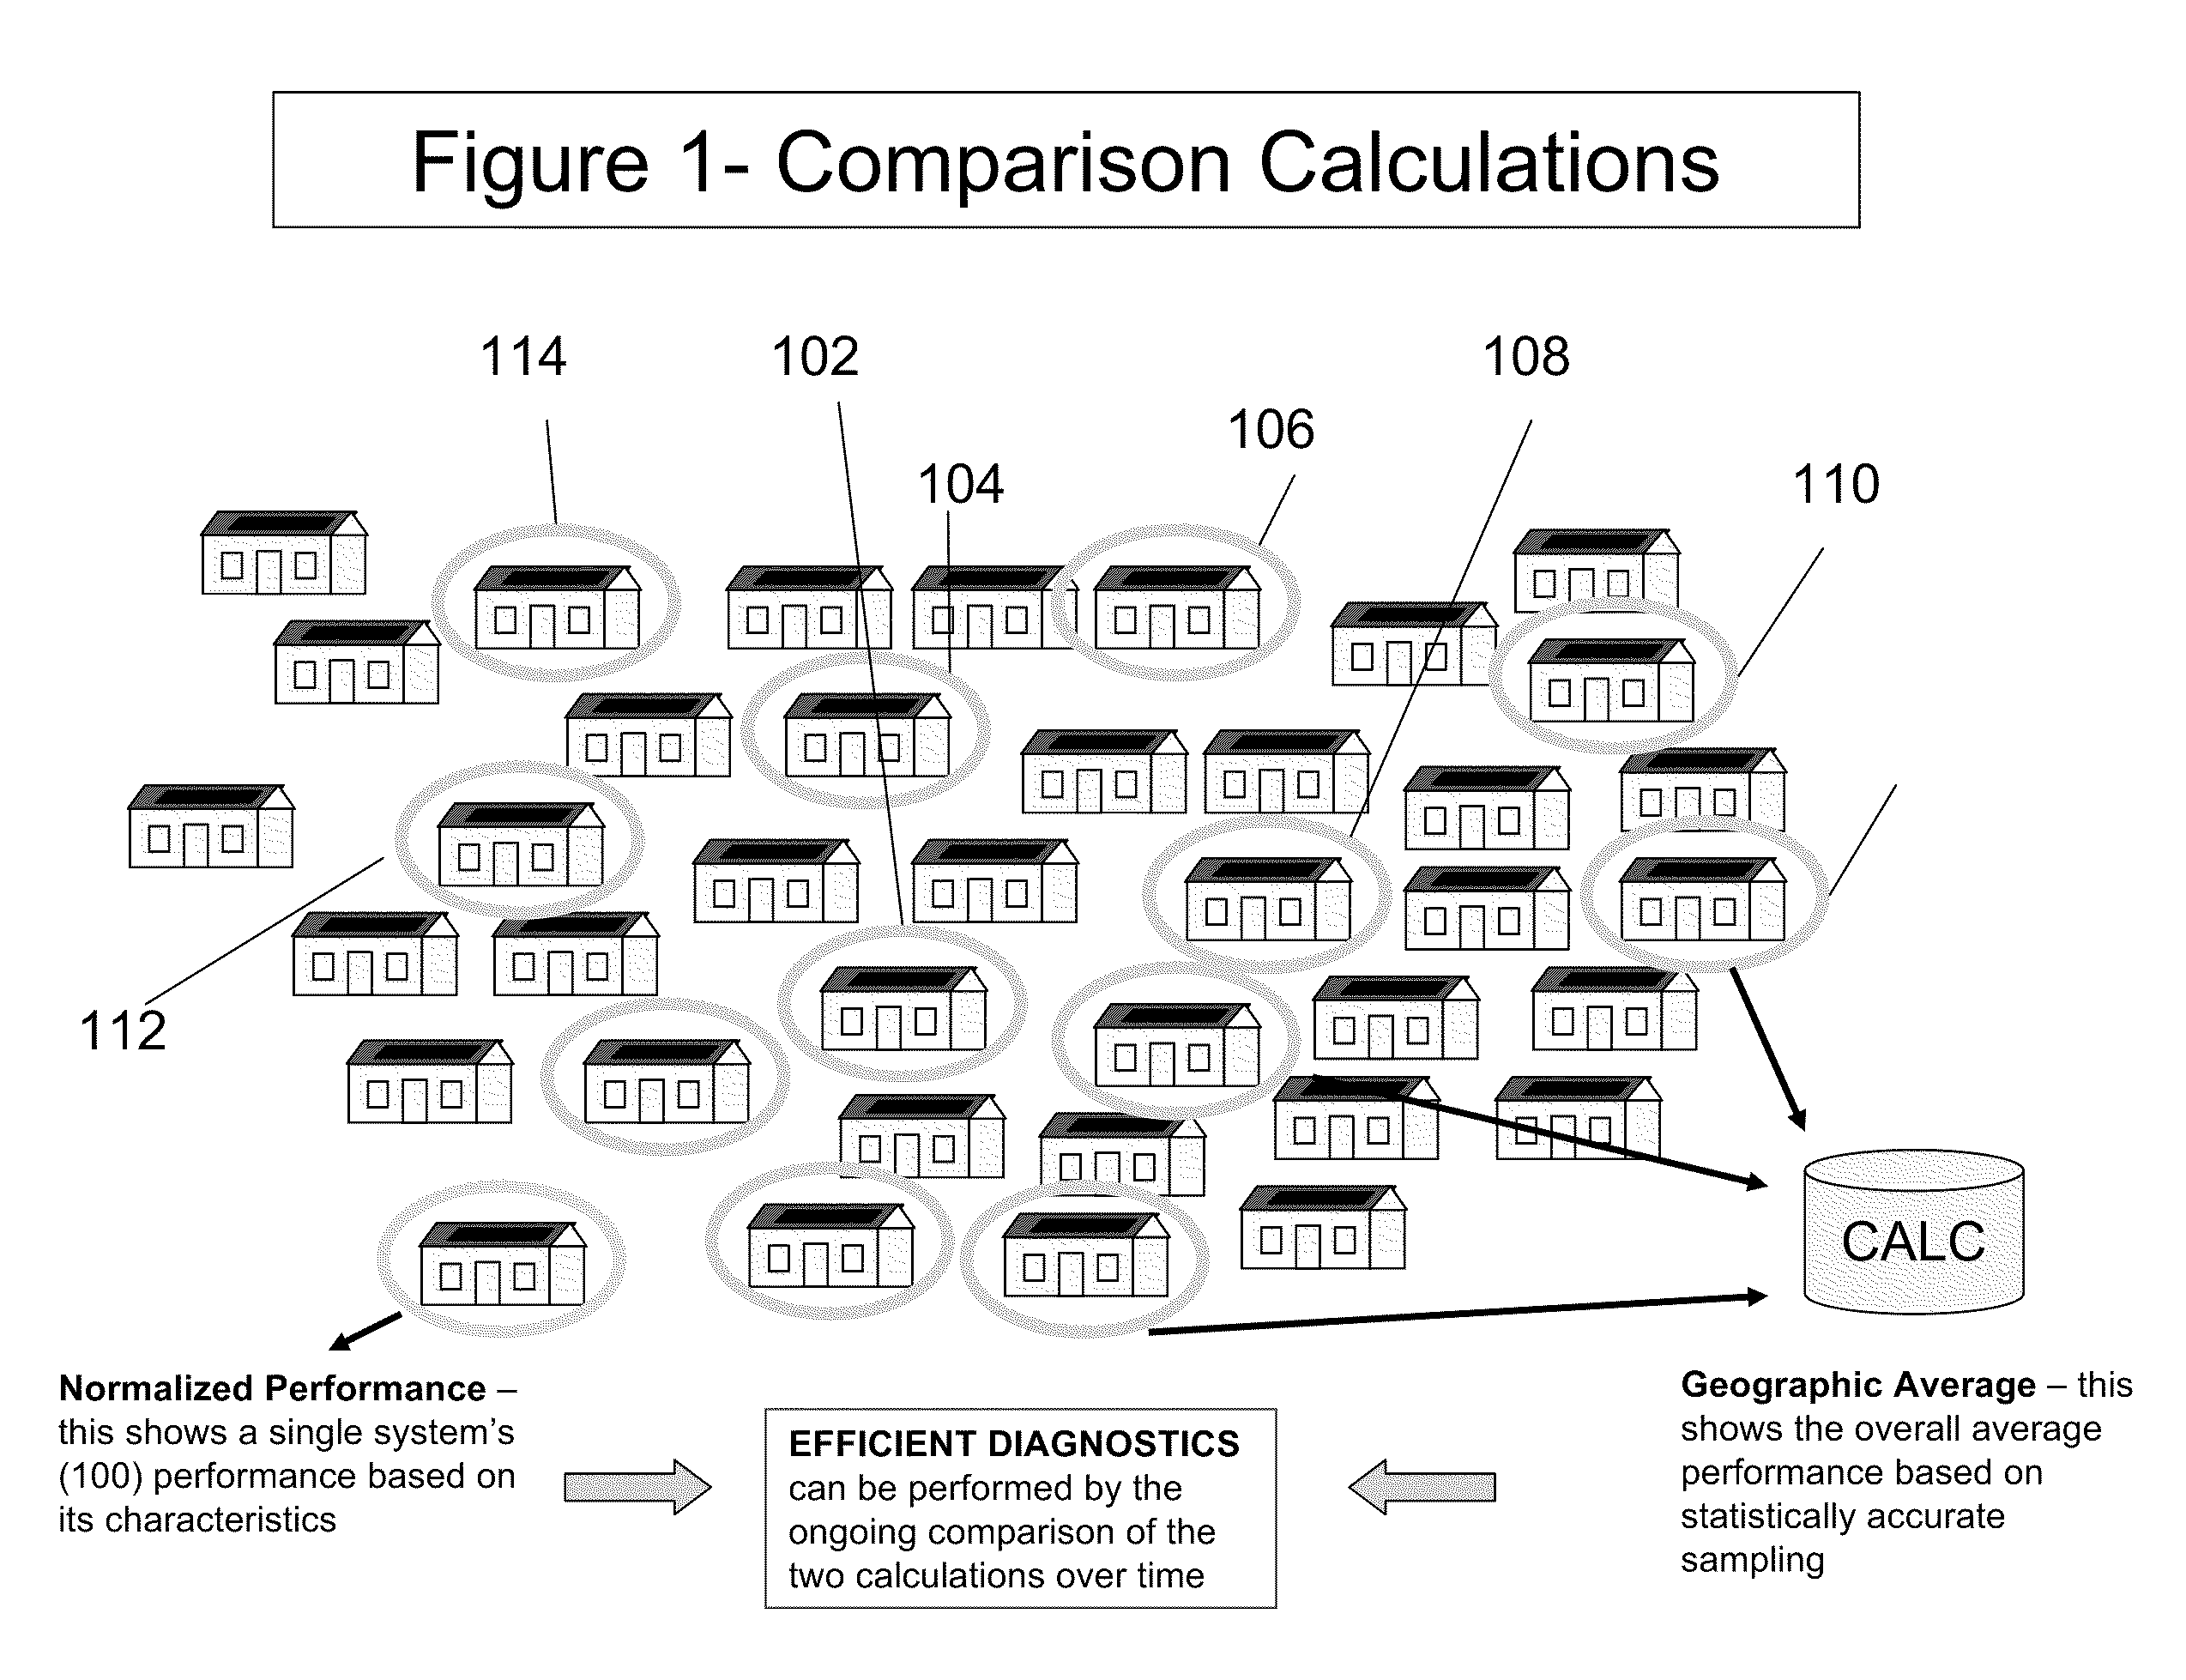
electricity), this translates into a loss of $7,500 worth of generation, as well as the additional cost of the $7,500 (or more) the user must pay for power to replace the lost generation. An efficient solution to many of these potential losses is comparative diagnostics, as opposed to, by way of example, potentially costly and complex sensors. While it is very difficult to isolate root causes of system issues (there are several different types and these can have a significant
impact as described above), by taking a statistically significant sampling of comparable renewable energy systems within a
geographic area, a Geographic Average can be created on an ongoing basis. This will not control for every variable affecting each system (e.g. a system on a hill may experience more wind than a system in a more
protected area), but given adjustments, comparing each system's performance against this point-in-
time average can efficiently highlight issues with a given system and alert the system owner and service provider that there is a potential issue that needs correction.
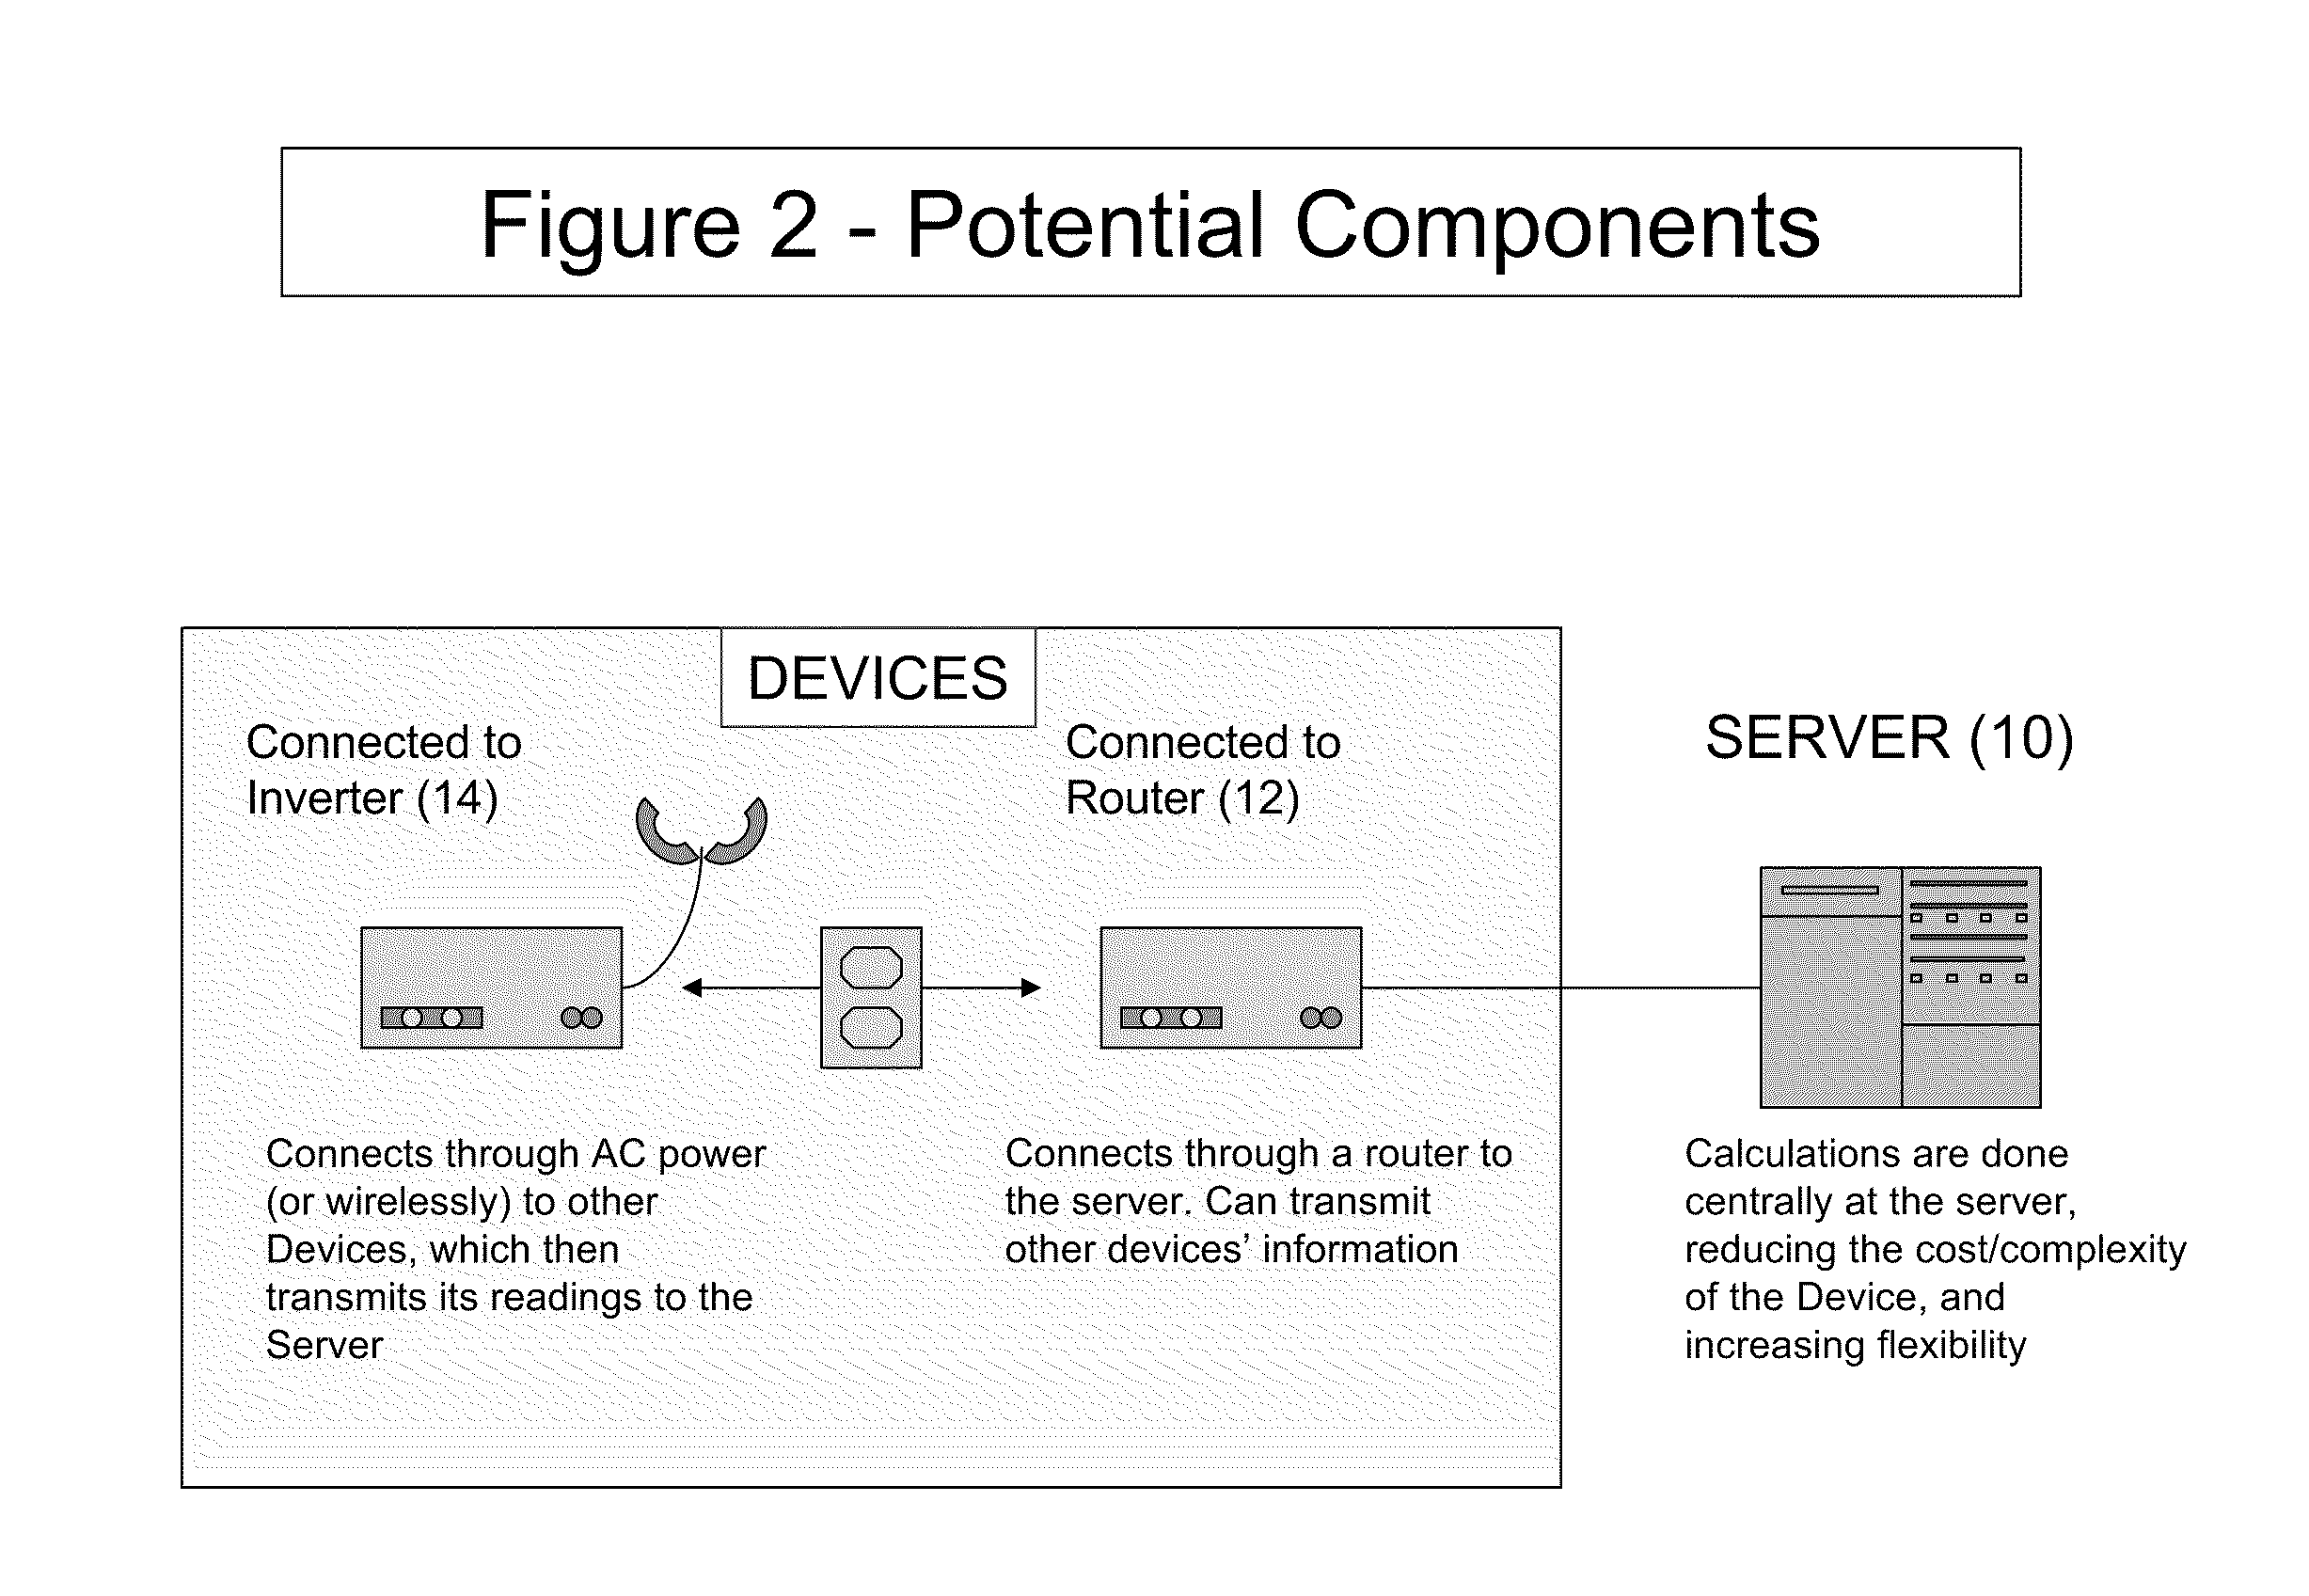
[0011]According to one embodiment of the present invention, a computer processor implemented method of measuring, monitoring, comparing and diagnosing the power generated of at least two renewable power systems provided to at least two consumers and alerting at least one of the consumers in the event of comparative underperformance, the method comprising the steps of; providing at least two renewable power systems, at least one data
server, at least one generation monitoring device in communication with at least one renewable power system and at least one communication node in communication with at least one of the renewable power system, generation monitoring device and data
server, determining at least two diagnostic variables for each renewable power system and saving each diagnostic variable into at least one data server, wherein at least two of the diagnostic variables are weather and renewable power system cover status; determining the energy generated by each renewable power system for a
specific time period to provide a normalized performance and saving the normalized performance in at least one data server along with the corresponding weather and renewable power system cover status; wherein the at least one data server determines comparative information for a predetermined
geographic area based upon at least two diagnostic variables, and at least two of the normalized performances to provide a comparative value; and informing the
consumer of the comparative value in the event of an underperforming comparative value.
[0012]According to another embodiment of the present invention, a computer processor implemented method of measuring, monitoring, comparing and diagnosing the power generated of at least two renewable power systems provided to at least two consumers and alerting at least one of the consumers in the event of comparative underperformance taking into account the effects of power system cover status (e.g.
snow covering solar panels, debris from inclement weather covering solar panels, etc.), the method comprising the steps of; providing at least two renewable power systems, at least one data server, at least one generation monitoring device in communication with at least one renewable power system and at least one communication node in communication with at least one of renewable power system, generation monitoring device and data server, determining at least two diagnostic variables for each renewable power system and saving each diagnostic variable into at least one data server, wherein at least two of the diagnostic variables are weather and renewable power system cover status; selecting a predetermined temperature threshold for a geographic area and issuing a directive to the communication node to either obtain
diagnostic data or ignore
diagnostic data from a particular renewable power system according to whether the temperature is above or below a predetermined temperature threshold; issuing a directive to the communication node to either obtain diagnostic data or ignore diagnostic data according to the renewable power system cover status; determining the energy generated by each renewable power system which were issued a directive to the communication node to obtain diagnostic data for a
specific time period to provide a normalized performance and saving the normalized performance in at least one data server along with corresponding weather and renewable power system cover status; wherein at least one data server determines comparative information for a predetermined geographic area based upon at least two of diagnostic variables, and at least two of normalized performances to provide a comparative value; and informing the
consumer of the comparative value in the event of an underperforming comparative value.

