
Generating, viewing, interpreting, and utilizing a quantitive database of metabolites

a metabolite database and quantitive technology, applied in the field of quantitive metabolites, can solve the problems of reducing the direct utility of genomics by itself, unable to meet the needs of patients, so as to improve the predictive diagnostics and power and accuracy of predictive diagnostics

Inactive Publication Date: 2011-07-14
TETHYS BIOSCI
View PDF2 Cites 8 Cited by
  • Summary
  • Abstract
  • Description
  • Claims
  • Application Information

AI Technical Summary

Benefits of technology

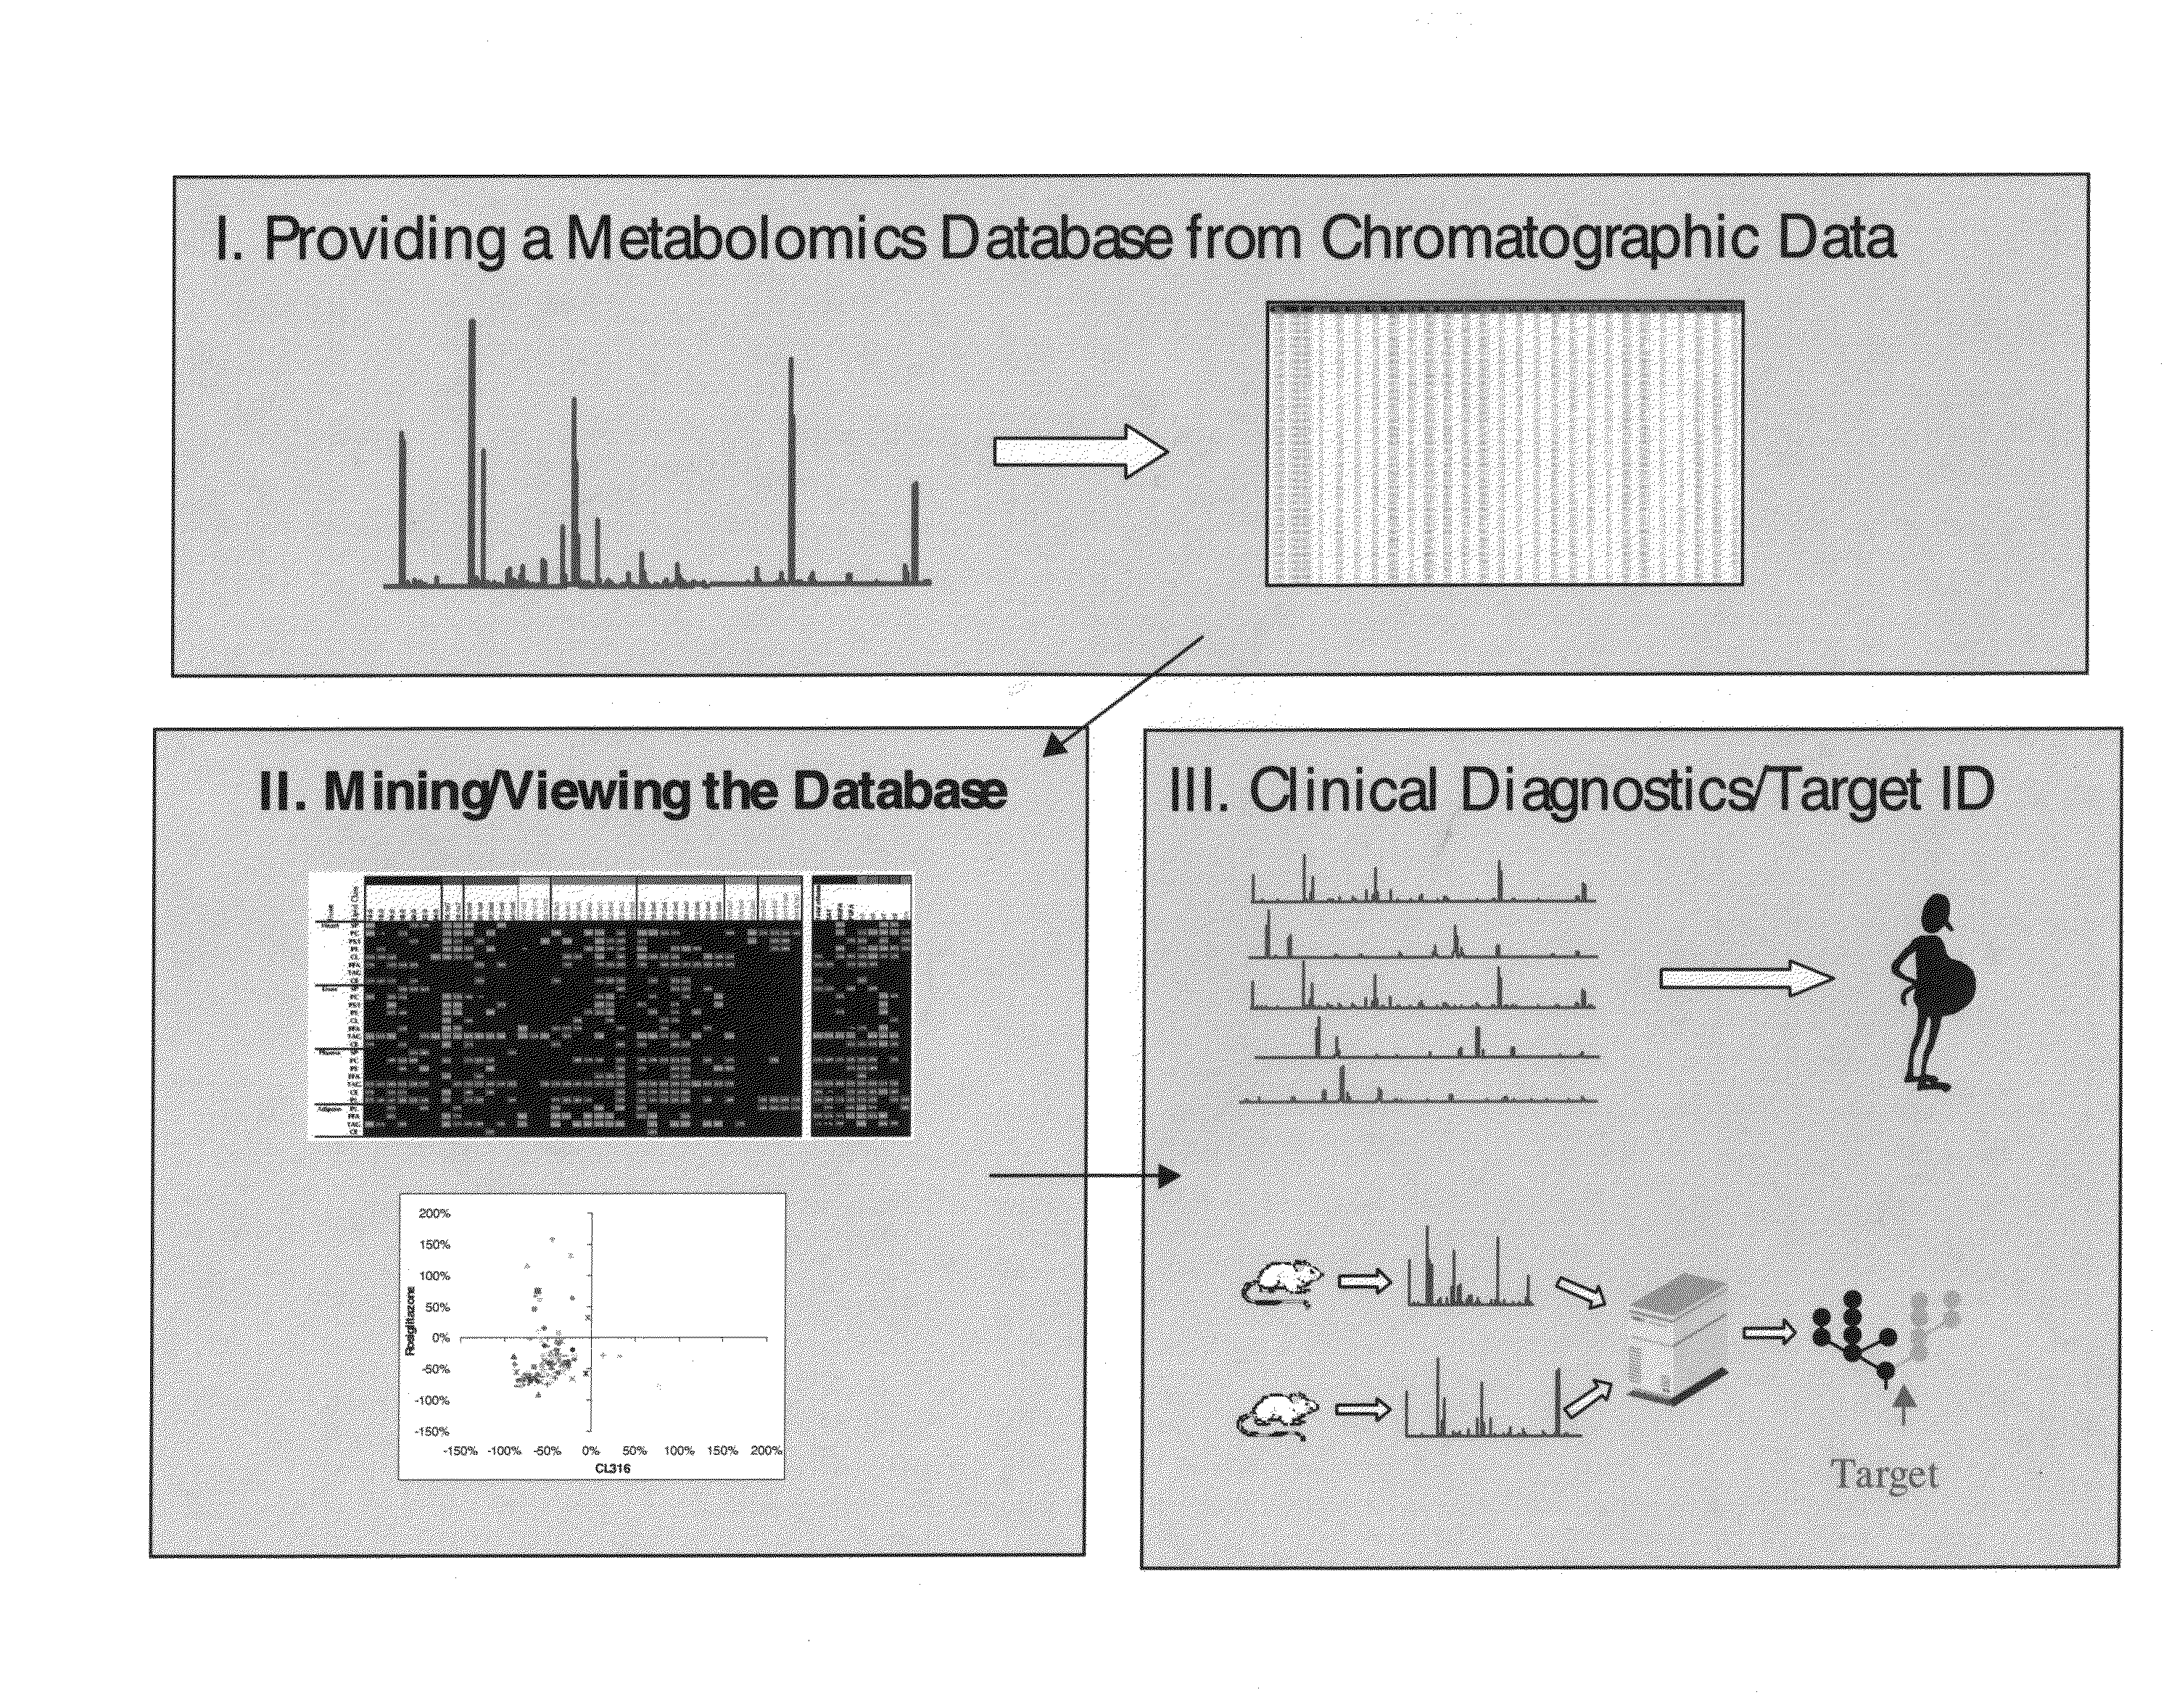
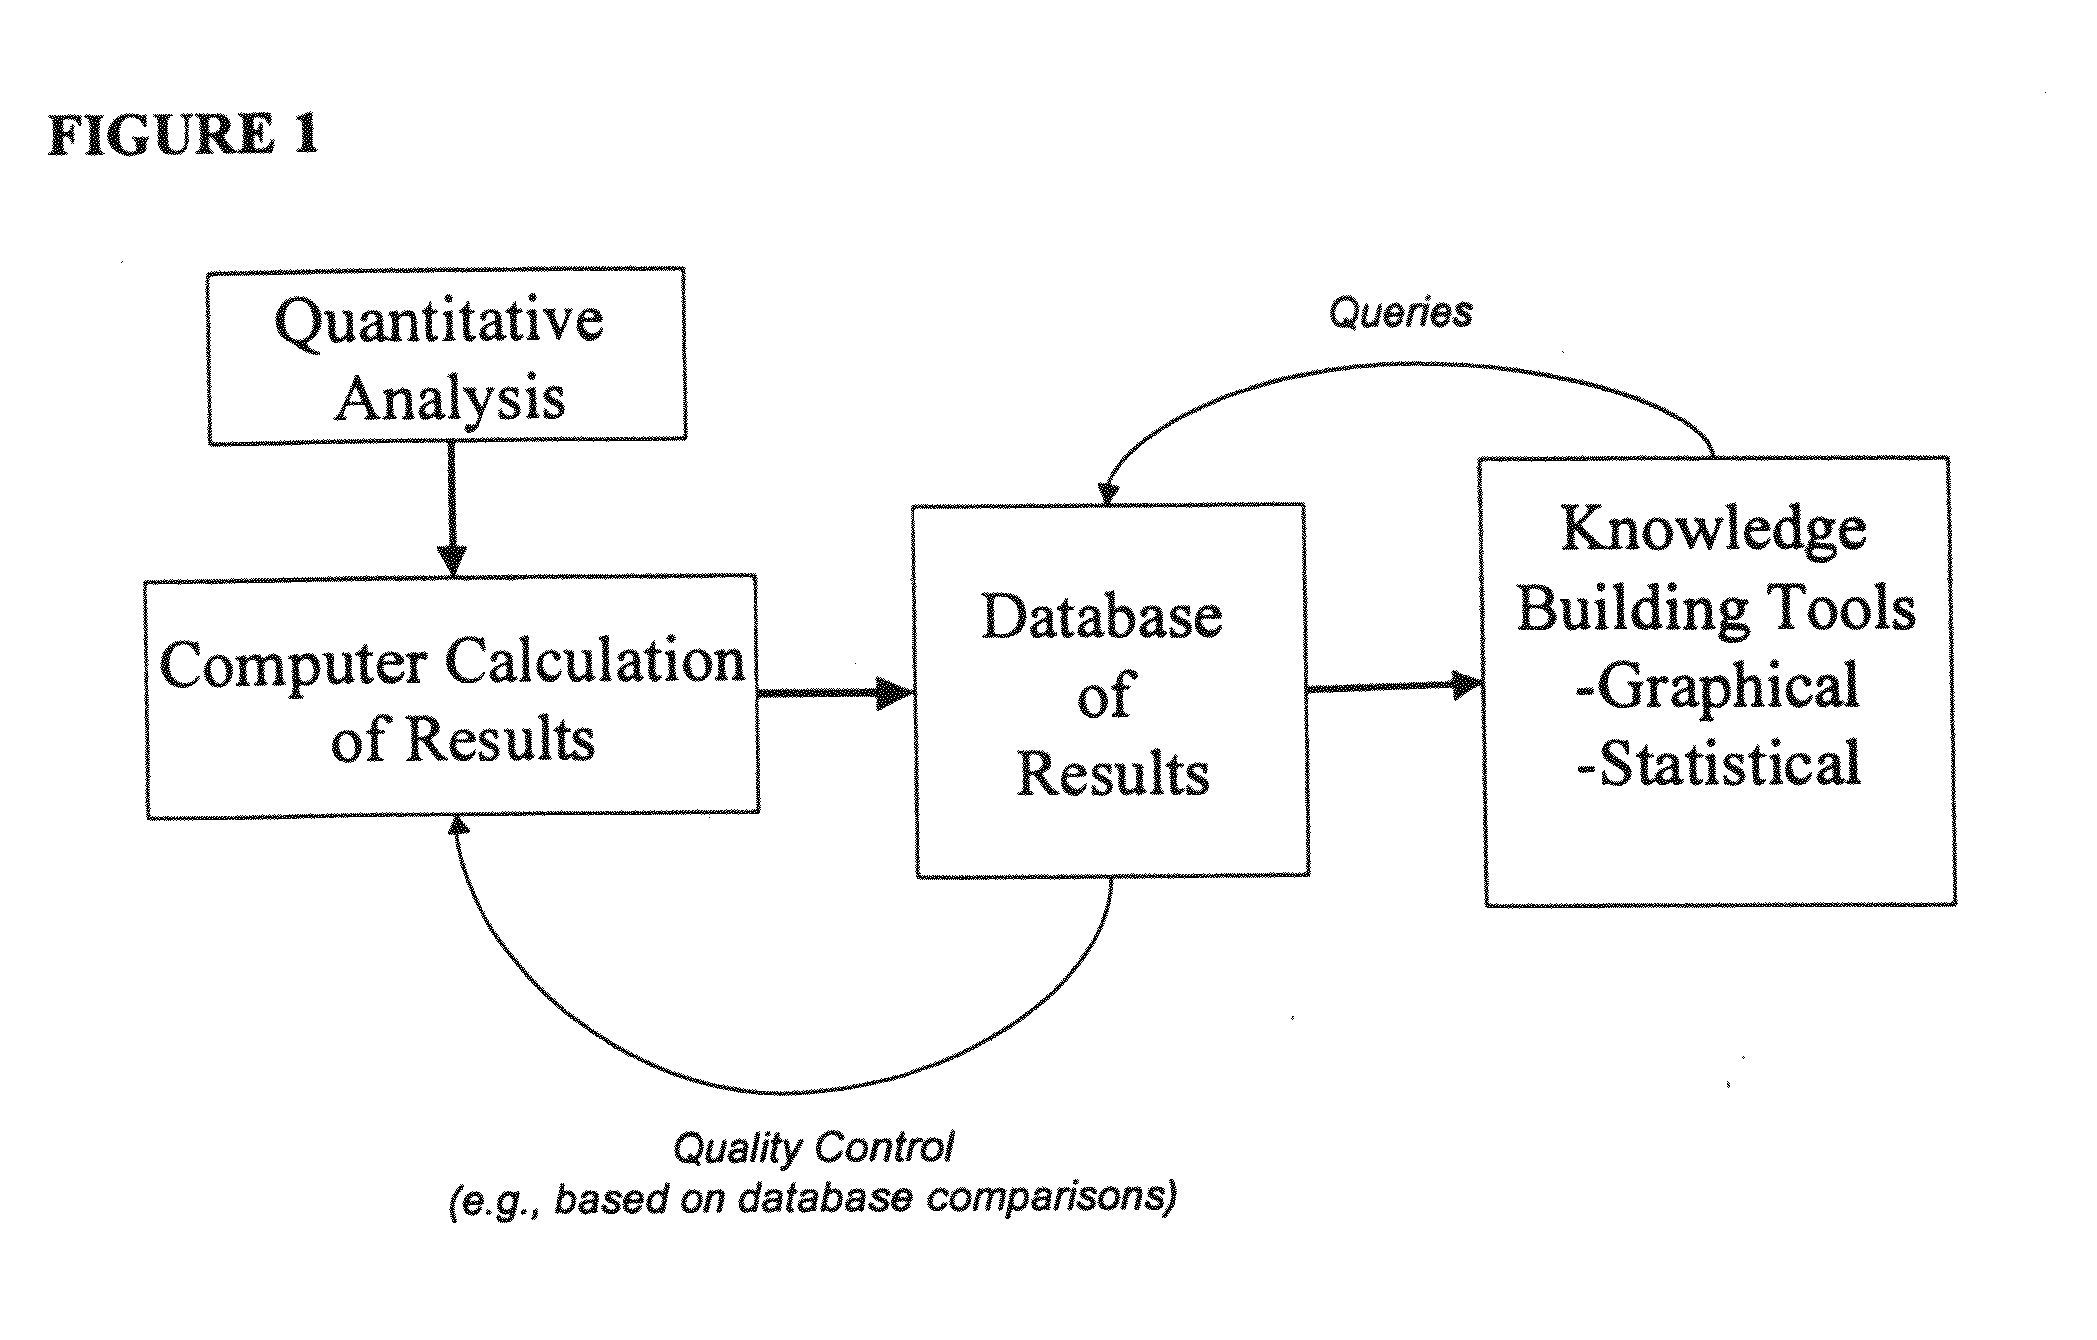
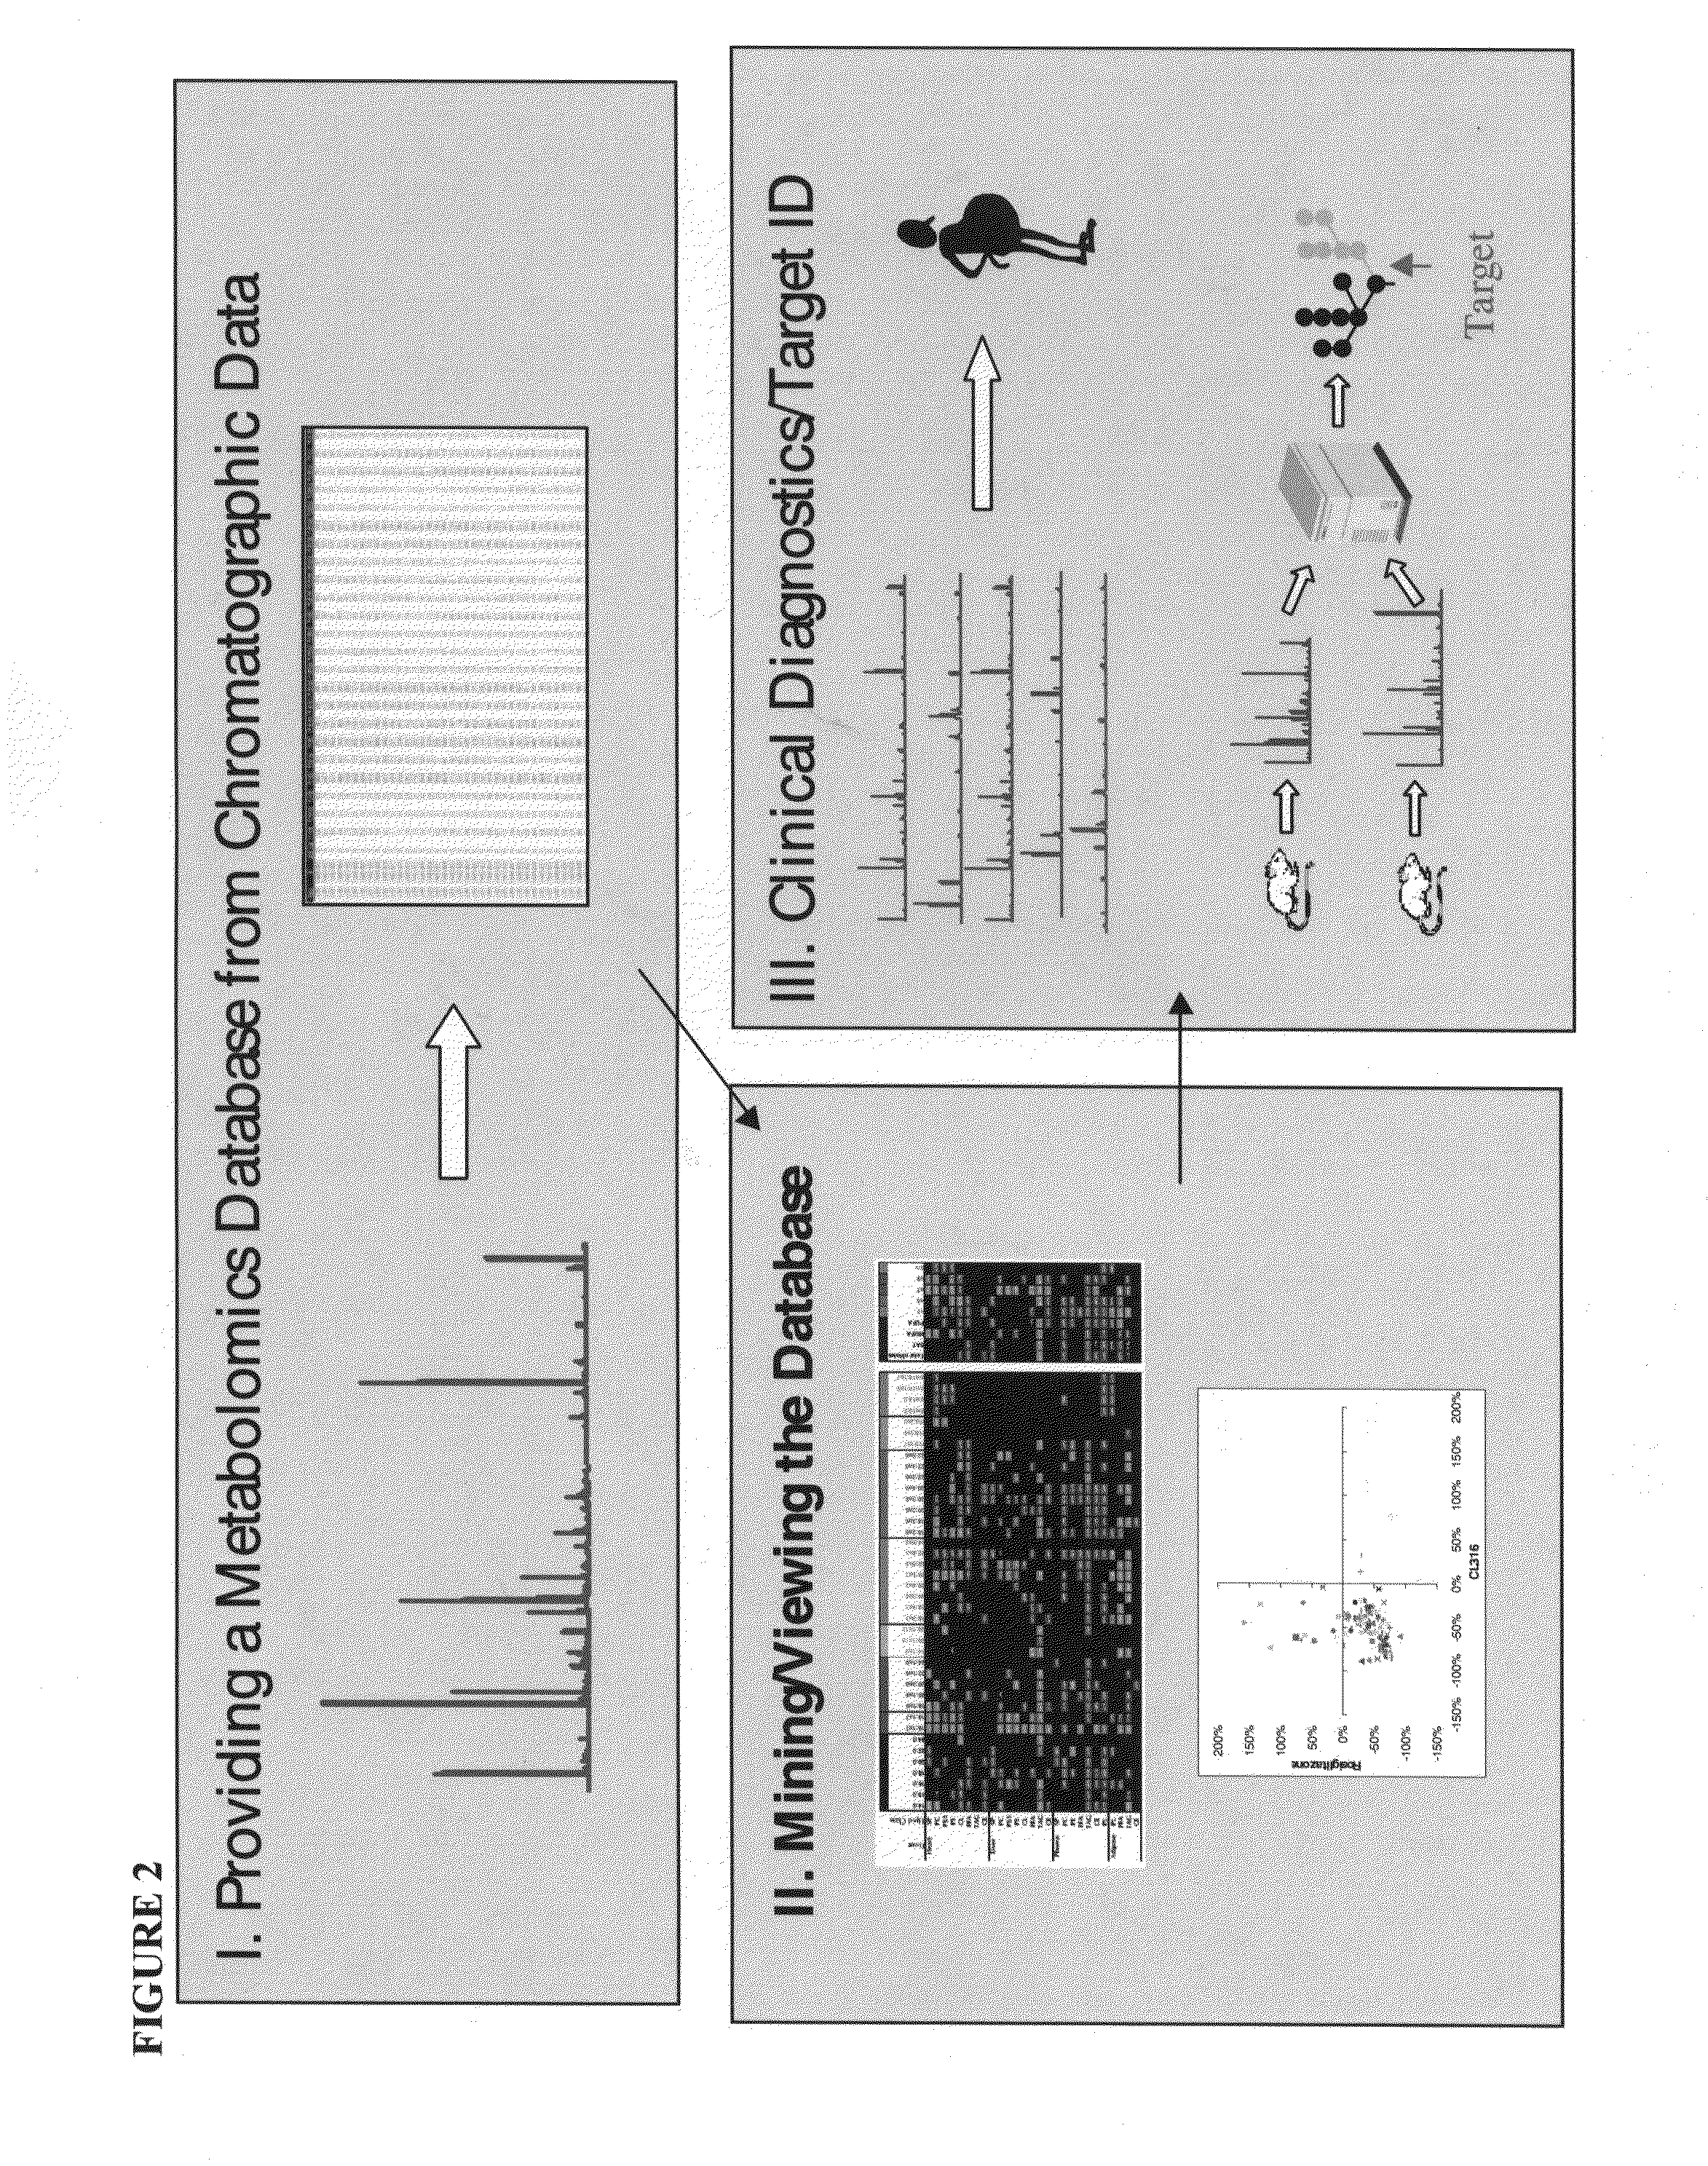
This patent provides methods for generating and storing quantitative metabolome data, specifically lipid metabolome data, in a way that is expandable and suitable for creating a quantitative database of metabolites. The data can be mined using visual tools to discover relations among metabolites from different subsets of the database. The power and accuracy of predictive diagnostics can be improved through lipid metabolomics, which allows multiple metabolites to be used in markers for a group. Comprehensive lipid analysis can measure a large number of individual lipid metabolites from each sample. The patent also provides databases and computer systems for storing, accumulating, sorting, selecting, and analyzing metabolomic data. In addition, the patent provides internal standards and internal standard compositions for analysis of lipids in biological samples.

Problems solved by technology

Managing this information and applying it to useful purpose are formidable challenges.
However, genomics is not a panacea for predictive medicine because phenotype is not necessarily predicted by genotype.
Beyond its application to diseases with demonstrably genetic causes, however, the direct utility of genomics by itself diminishes.
While the assessment of disease in man has been pursued using individual metabolite assessments, there are no technologies that enable the accumulation of diverse metabolome data in a single seamless and expandable resource.

Method used


Image

  • Generating, viewing, interpreting, and utilizing a quantitive database of metabolites
  • Generating, viewing, interpreting, and utilizing a quantitive database of metabolites
  • Generating, viewing, interpreting, and utilizing a quantitive database of metabolites

Examples


example 1

Lipid Metabolome-Wide Effects of the Peroxisome Proliferator-Activated Receptor γ Agonist Rosiglitazone

[0252]This example provides specific methods of generating and using quantified metabolite profiles to study the effects of a therapeutic compound.

Samples

[0253]Mouse tissue and plasma samples were a generous donation to Lipomics Technologies from Dr. Edward Leiter of the Jackson Laboratory (Bar Harbor, Me.). Samples included the plasma, heart, liver and inguinal adipose of mice treated with pharmaceuticals or their corresponding controls.

[0254]In trial 1, prediabetic male F1 mice (from a cross of the obese NZO and lean NON mouse strains) were fed a control diet with or without the presence of the PPARs-γ agonist rosiglitazone for 4 weeks (at 0.2 g rosiglitazone per kg body weight).

[0255]In trial 2, male, inbred NZO mice were fed a control with or without the presence of the b-3 adenergenic agonist CL316,243 for four weeks (at 0.001% CL316,243 by weight in the dietary chow).

[0256]In...

example 2

Disease / Condition-Linked Lipid Metabolite Profiles (Fingerprints)

[0297]With the provision herein of methods for determining the quantitative levels of a comprehensive panel of lipid metabolites, and the ability to assemble such individual metabolite profiles into a minable database, disease- or condition-linked lipid metabolite profiles (which provide information on the disease or condition state of a subject) are now enabled.

[0298]Disease or condition linked lipid metabolite profiles comprise the distinct and identifiable pattern of levels of lipid metabolites, for instance a pattern of high and low levels of a defined set of metabolites or subset of like or unlike metabolites, or molecules that can be correlated to such metabolites (such as biosynthetic or degradative enzymes that affect such metabolites). The set of molecules in a particular profile usually will include at least one of those listed in Table 6.

TABLE 6SCIENTIFICSCIENTIFIC NAMEABBR.COMMON NAME-SATURATED-Tetradecanoi...

example 3

Identification of Compounds

[0302]The linkage of specific lipid metabolites, or sets of lipid metabolites, and the levels thereof (for instance, as shown in a lipid metabolite profile), to a disease, condition, or predilection of an individual to suffer from or progress in a disease or condition, can be used to identify compounds that are useful in treating, reducing, or preventing that disease or condition, or development or progression of the disease or condition.

[0303]By way of example, a test compound is applied to a cell, for instance a test cell, and a lipid metabolite profile is generated and compared to the equivalent measurements from a test cell that was not so treated (or from the same cell prior to application of the test compound). Similarly, in some embodiments, the test compound is applied to a test organism, such as a mouse. If application of the compound alters level(s) of one or more lipid metabolites (for instance by increasing or decreasing that level), or changes...


PUM

PropertyMeasurementUnit
pHaaaaaaaaaa
temperatureaaaaaaaaaa

Abstract

This disclosure provides methods for the creation of a quantitative database of metabolites, particularly lipid metabolites, using chromatographic technology; methods for assembling that information into a visual format for interpretation, and methods of this information to identify and understand metabolome-wide effects, for instance those effects influenced by pharmaceuticals, genes, toxins, diet or the environment. Also provided are metabolite databases, such as lipid metabolite databases, that are stored on a computer readable medium, which include quantitative measurements of a plurality of metabolites.

Description

CROSS REFERENCE TO RELATED APPLICATIONS[0001]This is a continuation of PCT / US02 / 21426, filed Jul. 5, 2002 (published in English under PCT Article 21(2)), which in turn claims the benefit of U.S. Provisional Application No. 60 / 303,704, filed Jul. 6, 2001. The referenced applications are incorporated herein in their entirety.FIELD[0002]This disclosure relates to ways of quantifying metabolites and collecting quantitative data on metabolites, a database of quantified metabolite profiles, and methods of mining and visualizing selected subsets thereof.BACKGROUND[0003]The recent explosion of data acquisition and analysis technology, termed informatics, promises to revolutionize predictive and diagnostic medicine. The information readily available to doctors and scientists today dwarfs that of even a few years ago, and will expand at an even more accelerated rate in the next few years. Managing this information and applying it to useful purpose are formidable challenges.[0004]Currently, ge...

Claims


Application Information

Patent Timeline
Patent Type & Authority Applications(United States)
IPC IPC(8): G06F19/00G16B50/20A61B5/00G01N33/68G01N33/92G16B40/00
CPCG06F19/24G06Q50/22G06F19/28G06F19/26G16B40/00G16B45/00G16B50/00G16H10/40G16H10/60Y02A90/10G16B50/20
Inventor WATKINS, STEVE M.
Owner TETHYS BIOSCI
Learn More