System and method for photovoltaic plant power curve measurement and health monitoring

a photovoltaic plant and power curve technology, applied in the direction of electric devices, instruments, transportation and packaging, etc., can solve the problems of inability to achieve scheduled maintenance, inability to know the monitoring scheme of the photovoltaic plant, and difficulty in determining conclusive results

Inactive Publication Date: 2011-11-17
GENERAL ELECTRIC CO
View PDF1 Cites 34 Cited by
  • Summary
  • Abstract
  • Description
  • Claims
  • Application Information

AI Technical Summary

Benefits of technology

one or more power converters configured to receive DC electrical power from the one or more solar panels and deliver AC electrical power to the power grid; and
a monitoring system configured to determine normalized irradiation data in response to an algorithmic software based on measured or calculated irradiance at one or more desired PV plant locations, and further configured to measure desired PV plant electrical signals and generate an estimated signal curve map for the PV plant as a function of the normalized irradiation data and the measured PV plant electrical signals, such that corresponding PV plant electrical signal data can be compared to at least one of historical, theoretical or simulated PV plant electrical signal data based on normalized irradiation data for the PV plant to detect degradation of at least a portion of the PV plant in a desired time frame.
According to yet another embodiment, a photovoltaic plant power curve measurement system comprises a monitoring system configured to determine normalized irradiation data in response to an algorithmic software based on measured or calculated irradiance at one or more desired PV plant locations, and further configured to measure PV plant electrical p

Problems solved by technology

There presently is no known scheme for monitoring a photovoltaic plant as a complete system.
This technique disadvantageously results in long time intervals associated with receipt of feedback information that make scheduled maintenance impracticable or impossible to achieve due to unavailability of early warning signals.
Conclusory results are particularly difficult to determine because condition

Method used


Image

  • System and method for photovoltaic plant power curve measurement and health monitoring
  • System and method for photovoltaic plant power curve measurement and health monitoring
  • System and method for photovoltaic plant power curve measurement and health monitoring

Examples


Embodiment Construction

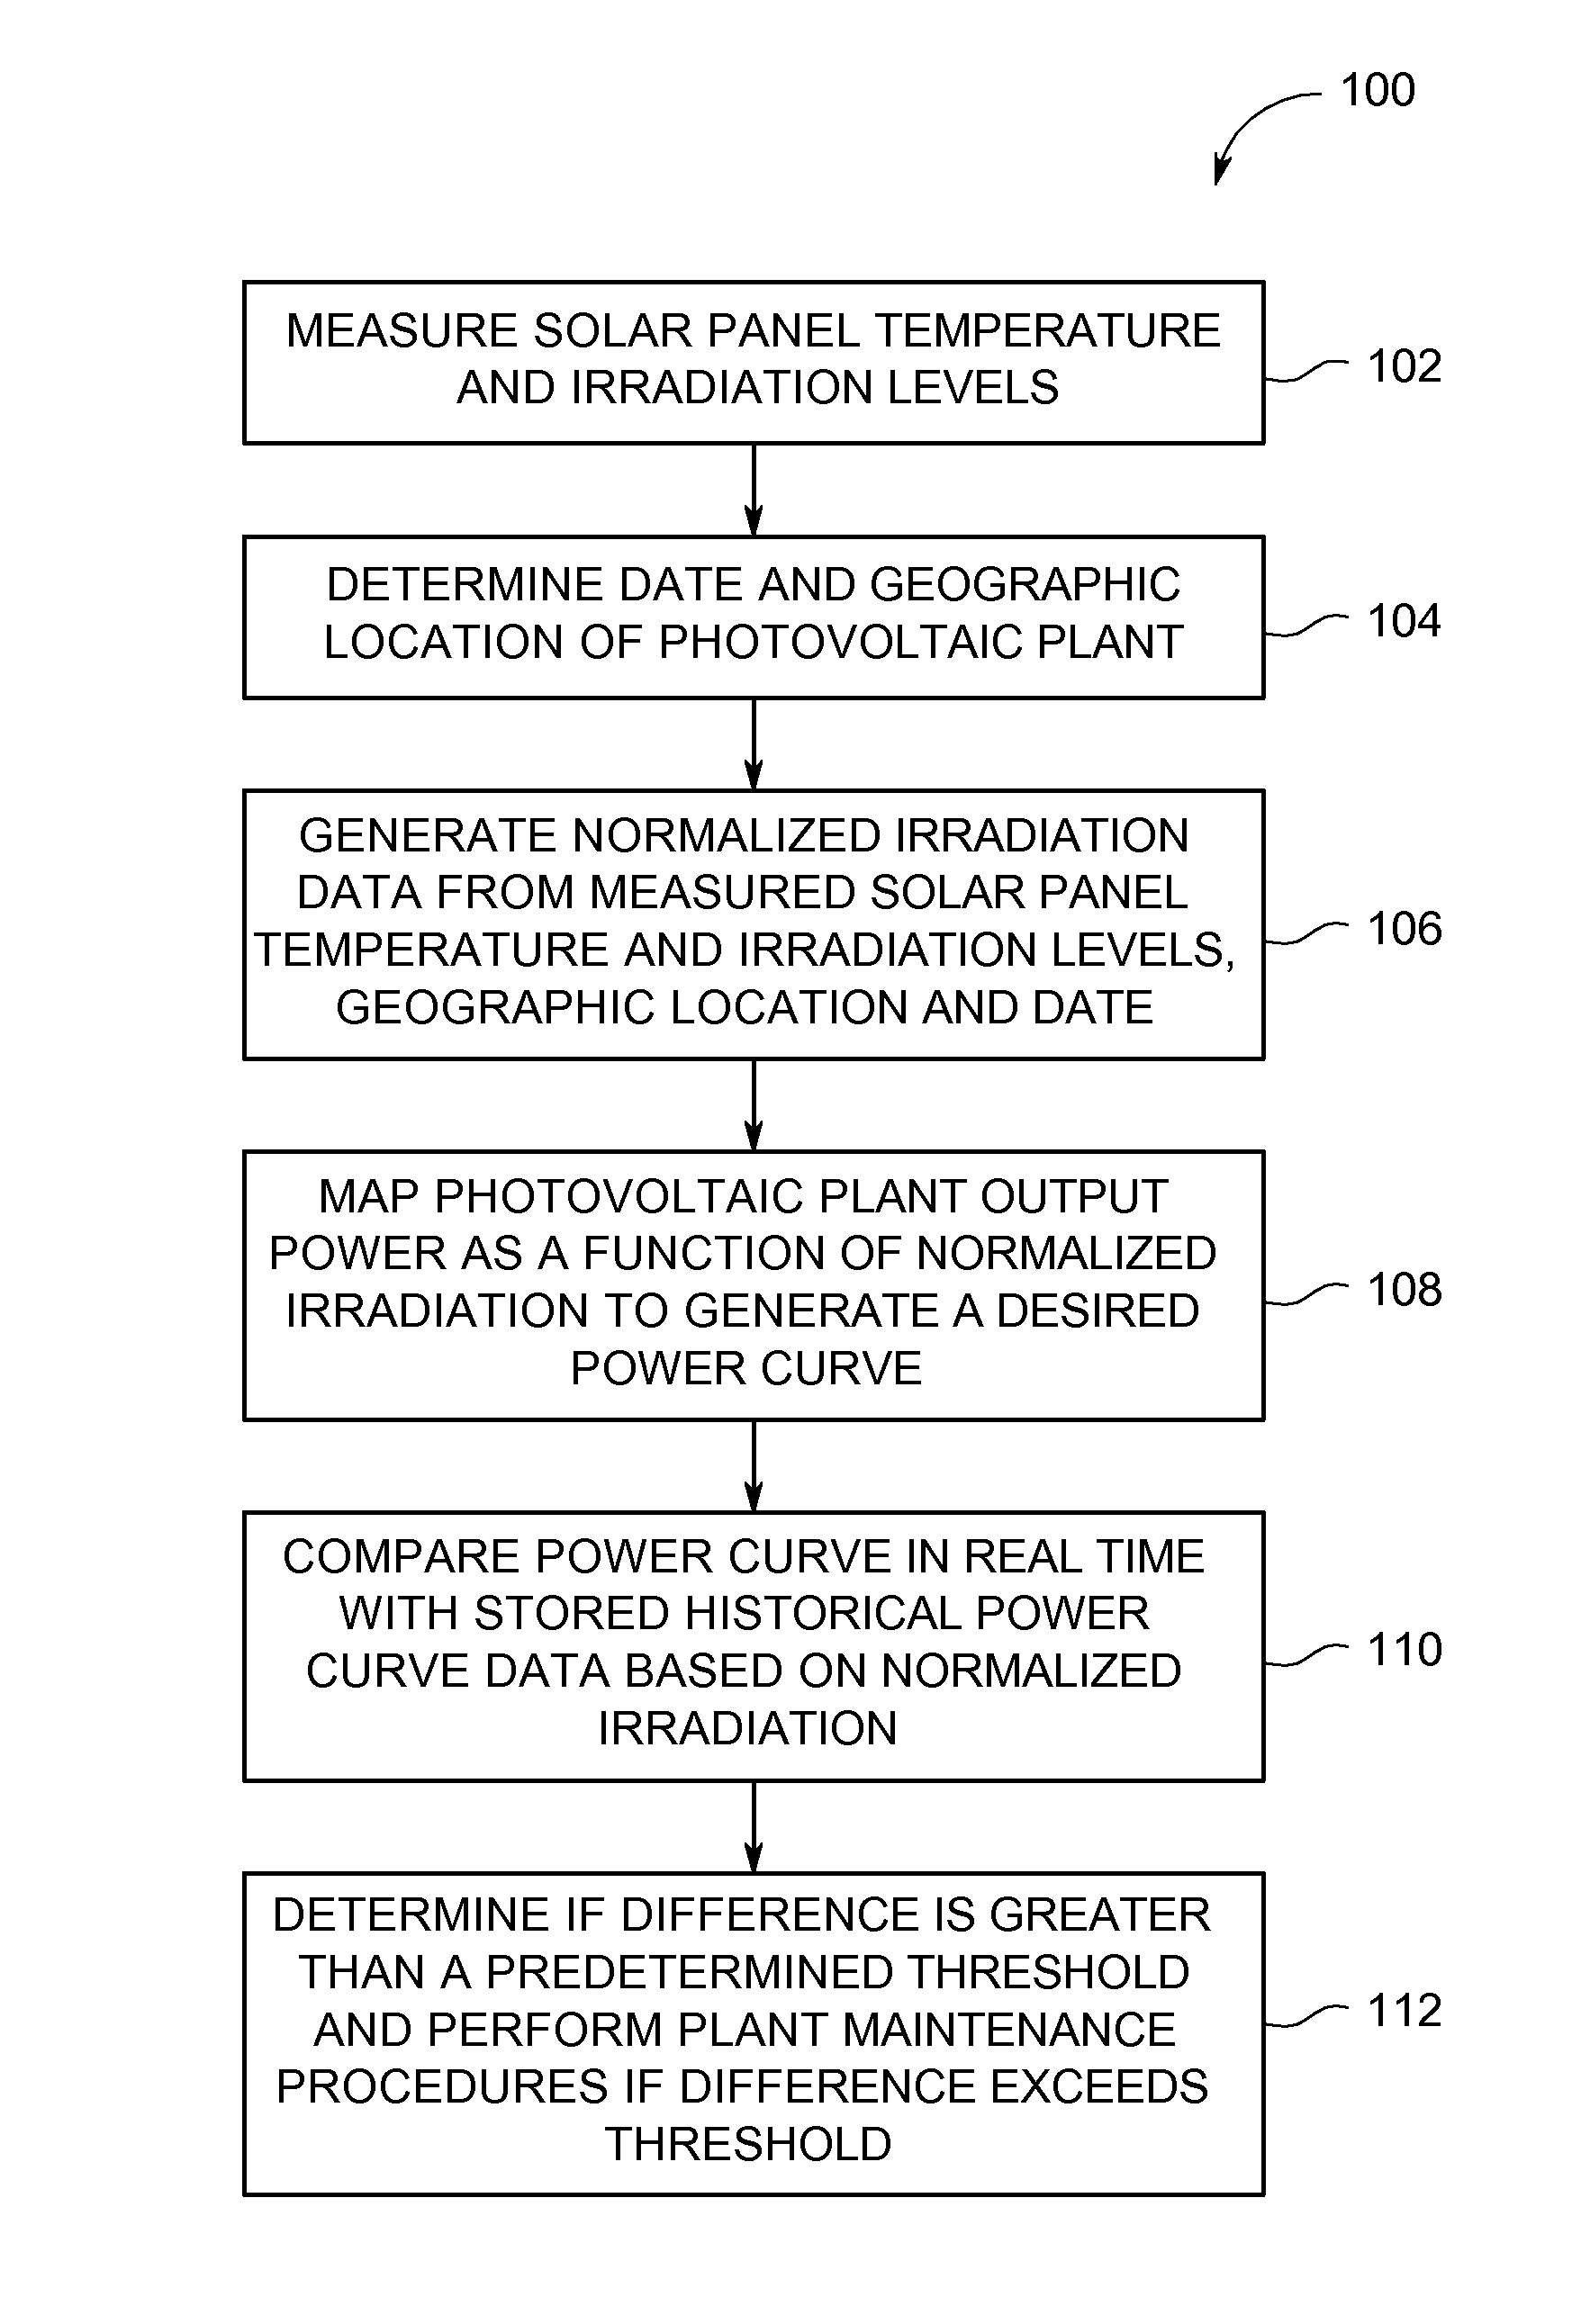
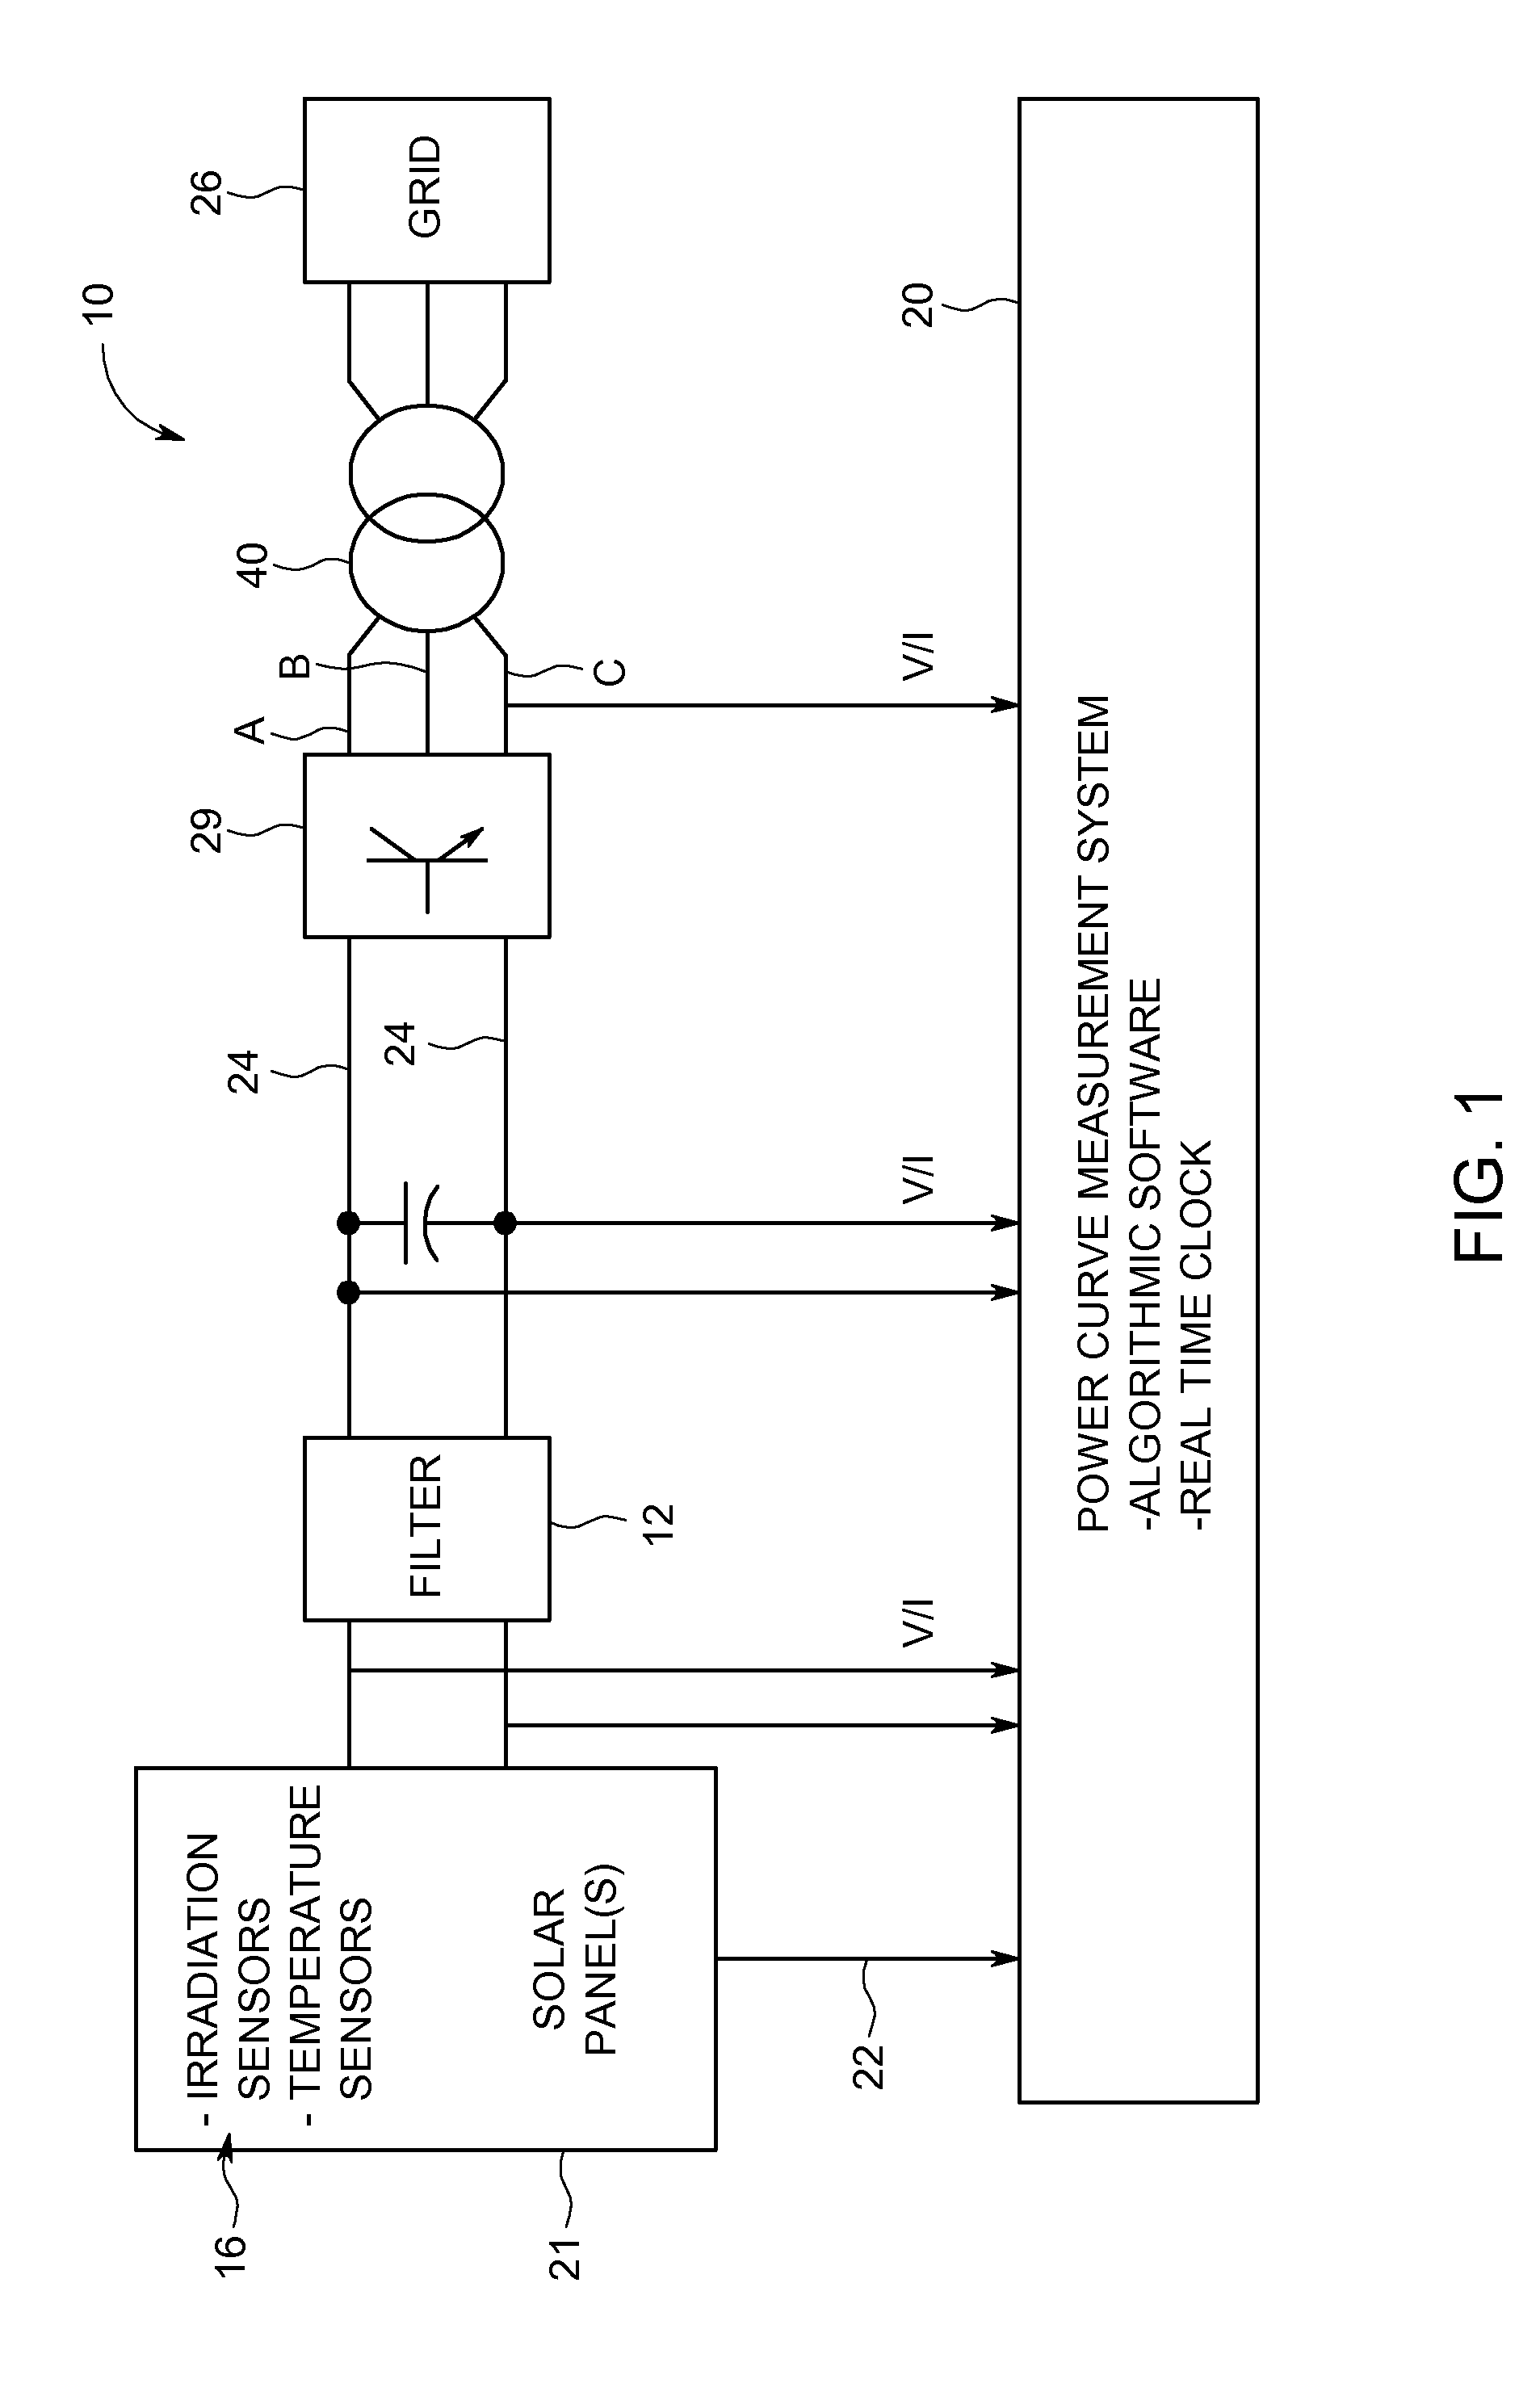
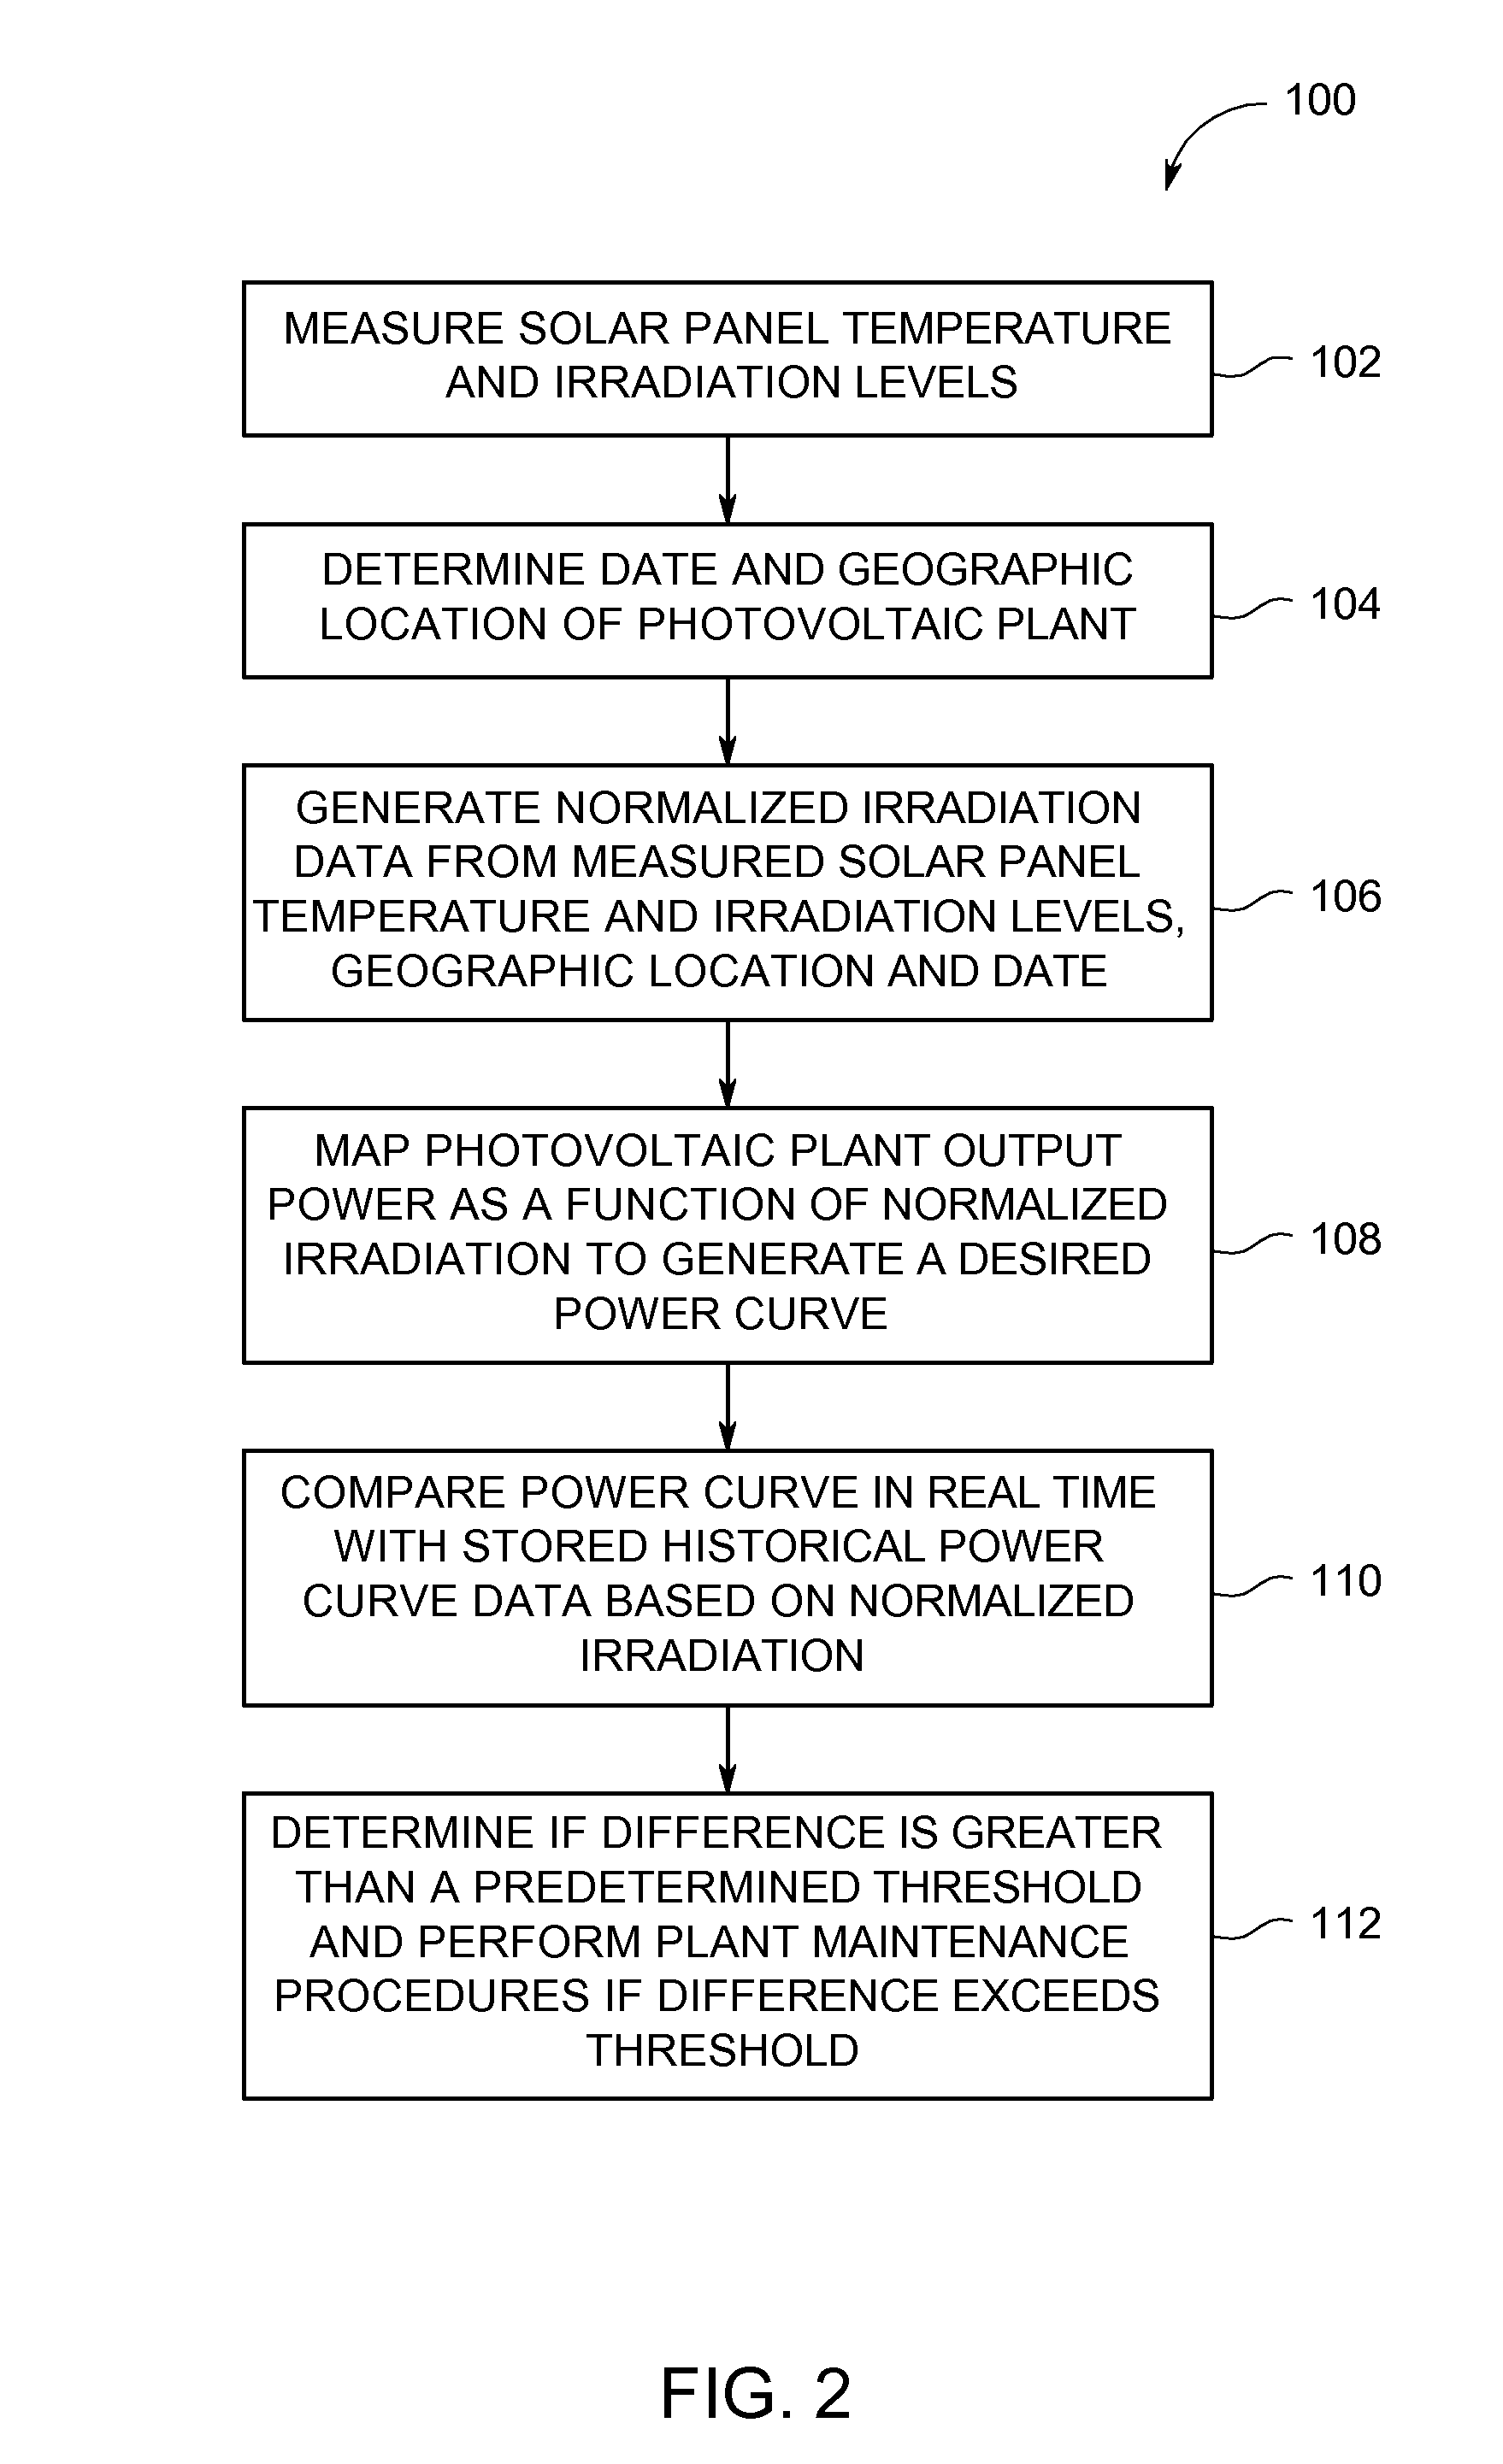
FIG. 1 illustrates a photovoltaic plant 10 configured with a power curve measurement and health monitoring system 20 according to one embodiment. Photovoltaic plant 10 includes a power converter 29, and a power transformer 40 that together are configured to supply energy to an AC power grid 26. Power converter 29 is configured to receive electrical energy from one or more solar panels 21 and deliver converted electrical energy to the power grid 26.

Power curve measurement and health monitoring of the photovoltaic plant 10 according to particular embodiments may be based on electrical voltage and / or current measurements between the filter 12 and the PV solar panel(s) 21, between the filter 12 and the converter 29, between the converter 29 and the power grid 26, or combinations thereof. Measurements between the filter 12 and the PV panel(s) 21 are particularly useful when implementing a stand-alone system. Measurements between the filter 29 and the converter 29, and measurements betwee...


PUM


Abstract

A photovoltaic (PV) plant power curve measurement system determines normalized irradiation data in response to algorithmic software based on measured or calculated irradiance at one or more desired PV plant locations. The measurement system also measures PV plant electrical power and generates an estimated power curve map of corresponding photovoltaic plant electrical power as a function of the normalized irradiation data and the measured PV plant electrical power, such that corresponding power curve data can be compared to historical, theoretical or simulated power curve data based on normalized irradiation data for the photovoltaic plant to detect degradation of the photovoltaic plant in a desired time frame.

Description

BACKGROUNDThe invention relates generally to health and performance monitoring of photovoltaic plants and more particularly to a system and method for monitoring the health of a photovoltaic plant based on a calculated power curve for the photovoltaic plant.There presently is no known scheme for monitoring a photovoltaic plant as a complete system. Current industrial techniques use monthly or yearly energy generation tracking. The resultant numbers are compared on an industry wide basis to provide a better understanding of system performance. This technique disadvantageously results in long time intervals associated with receipt of feedback information that make scheduled maintenance impracticable or impossible to achieve due to unavailability of early warning signals. Performance of photovoltaic plant systems, particularly annual energy production, is currently evaluated based solely on simulation results. The long time interval generation tracking is used to get around the uncerta...

Claims


Application Information

Patent Timeline
IPC IPC(8): G01R21/00G06F17/30G06F19/00
CPCH02J3/383H02S50/10Y02E10/563H02J2300/24H02J3/381Y02E10/56
Inventor ROESNER, ROBERTEL-BARBARI, SAID FAROUK SAID
Owner GENERAL ELECTRIC CO
Why Eureka
Try Eureka