
System for analyzing expression profile, and program therefor

a technology of expression profile and analysis system, applied in the field of system for analyzing expression profile, can solve the problems of inability to directly compare data on the web with each other, inability to analyze by a general-purpose computer, and increase in calculation amount, so as to achieve easy extraction, easy confirmation, and easy extraction of subject gene having similarity

Inactive Publication Date: 2012-01-05
MEIJI UNIV +1
View PDF0 Cites 3 Cited by
  • Summary
  • Abstract
  • Description
  • Claims
  • Application Information

AI Technical Summary

Benefits of technology

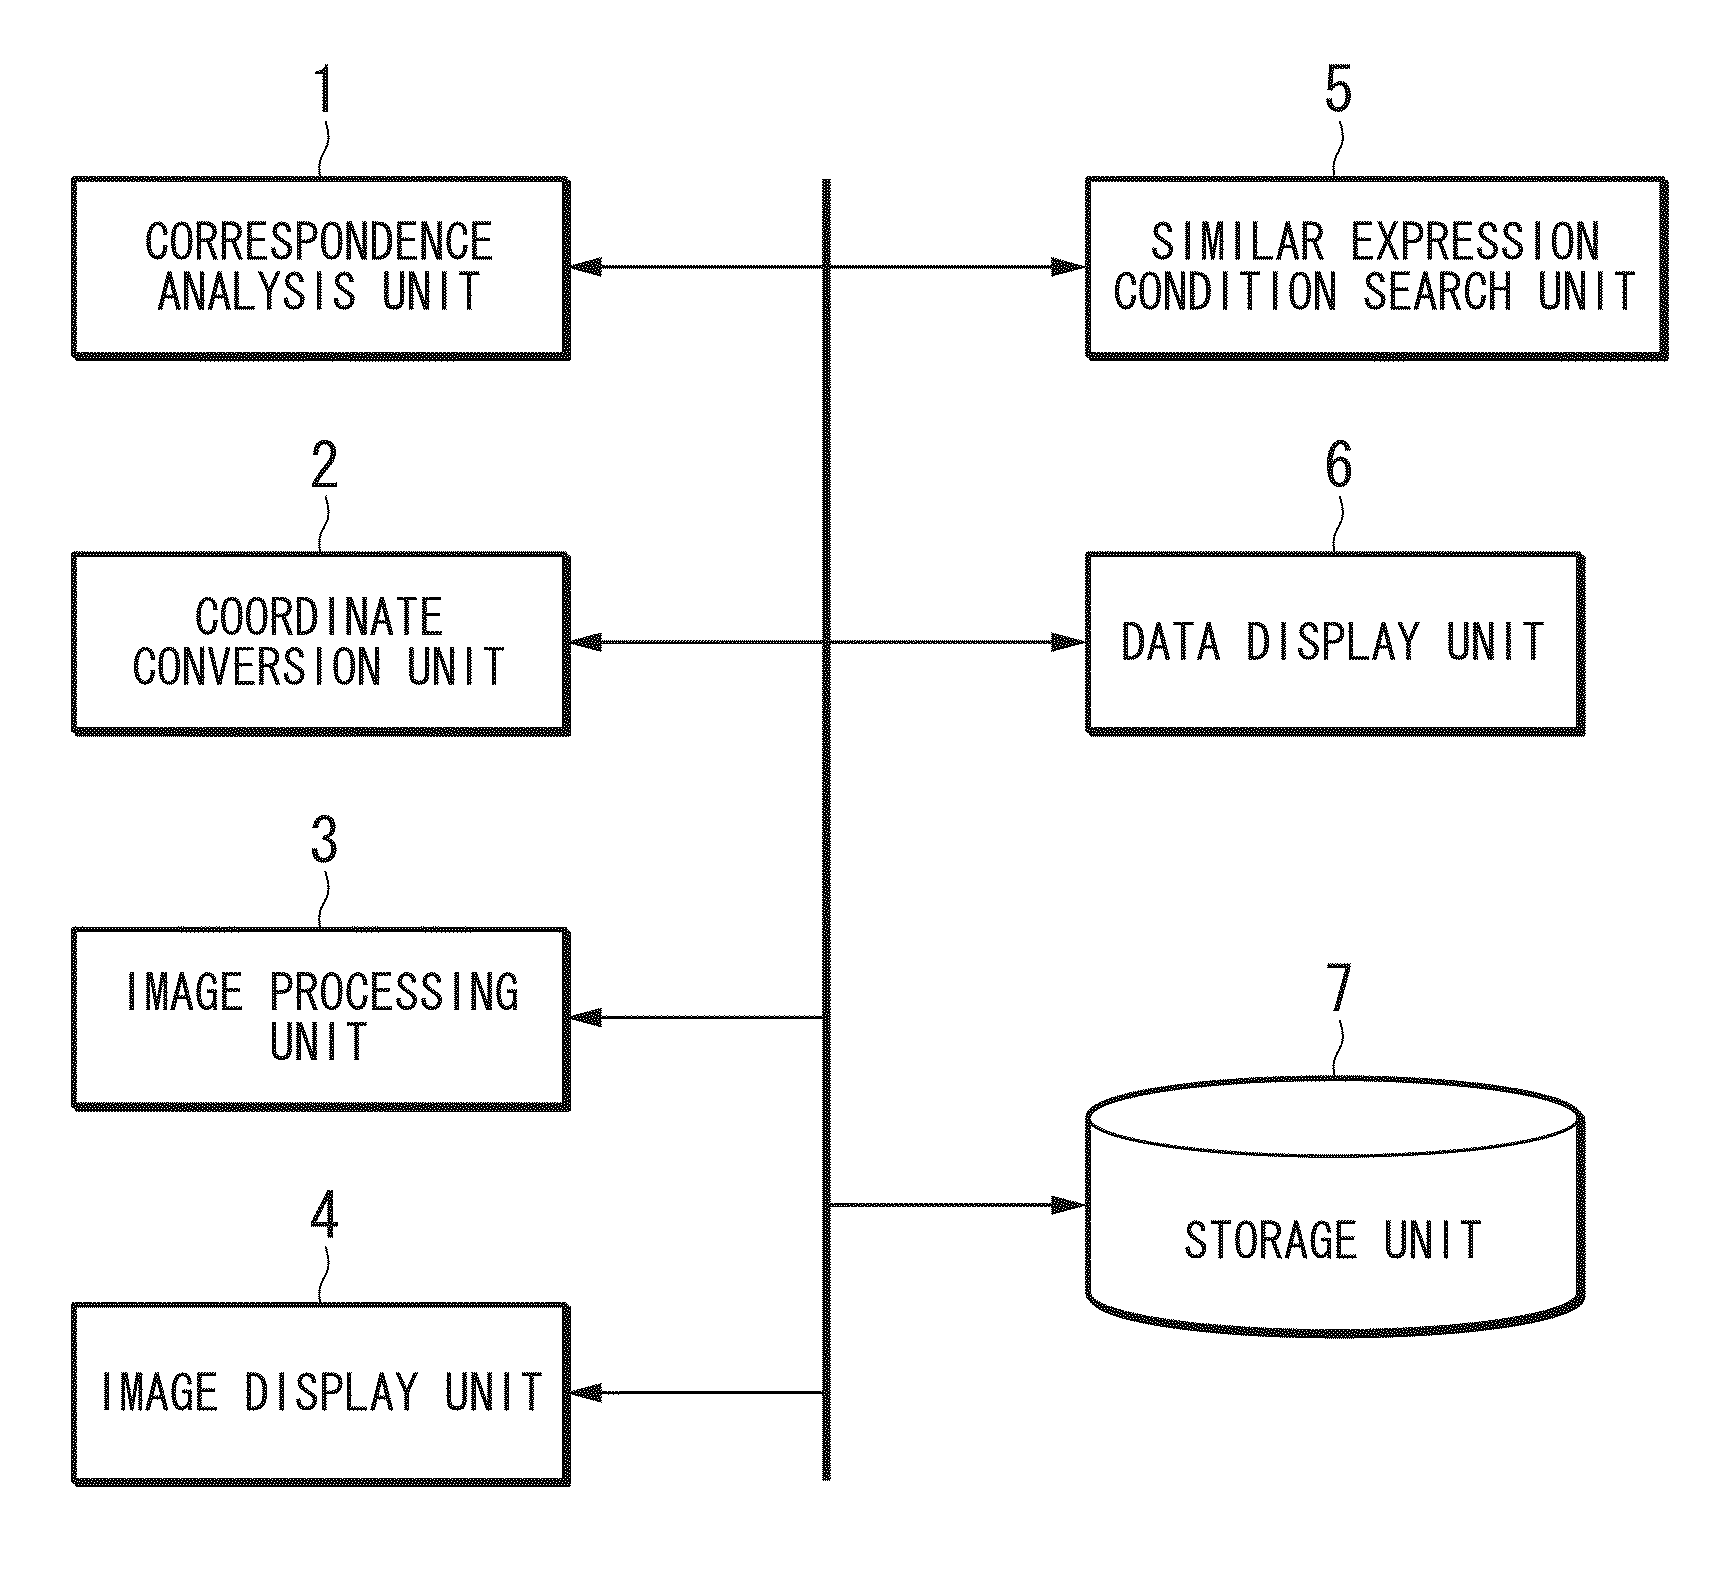
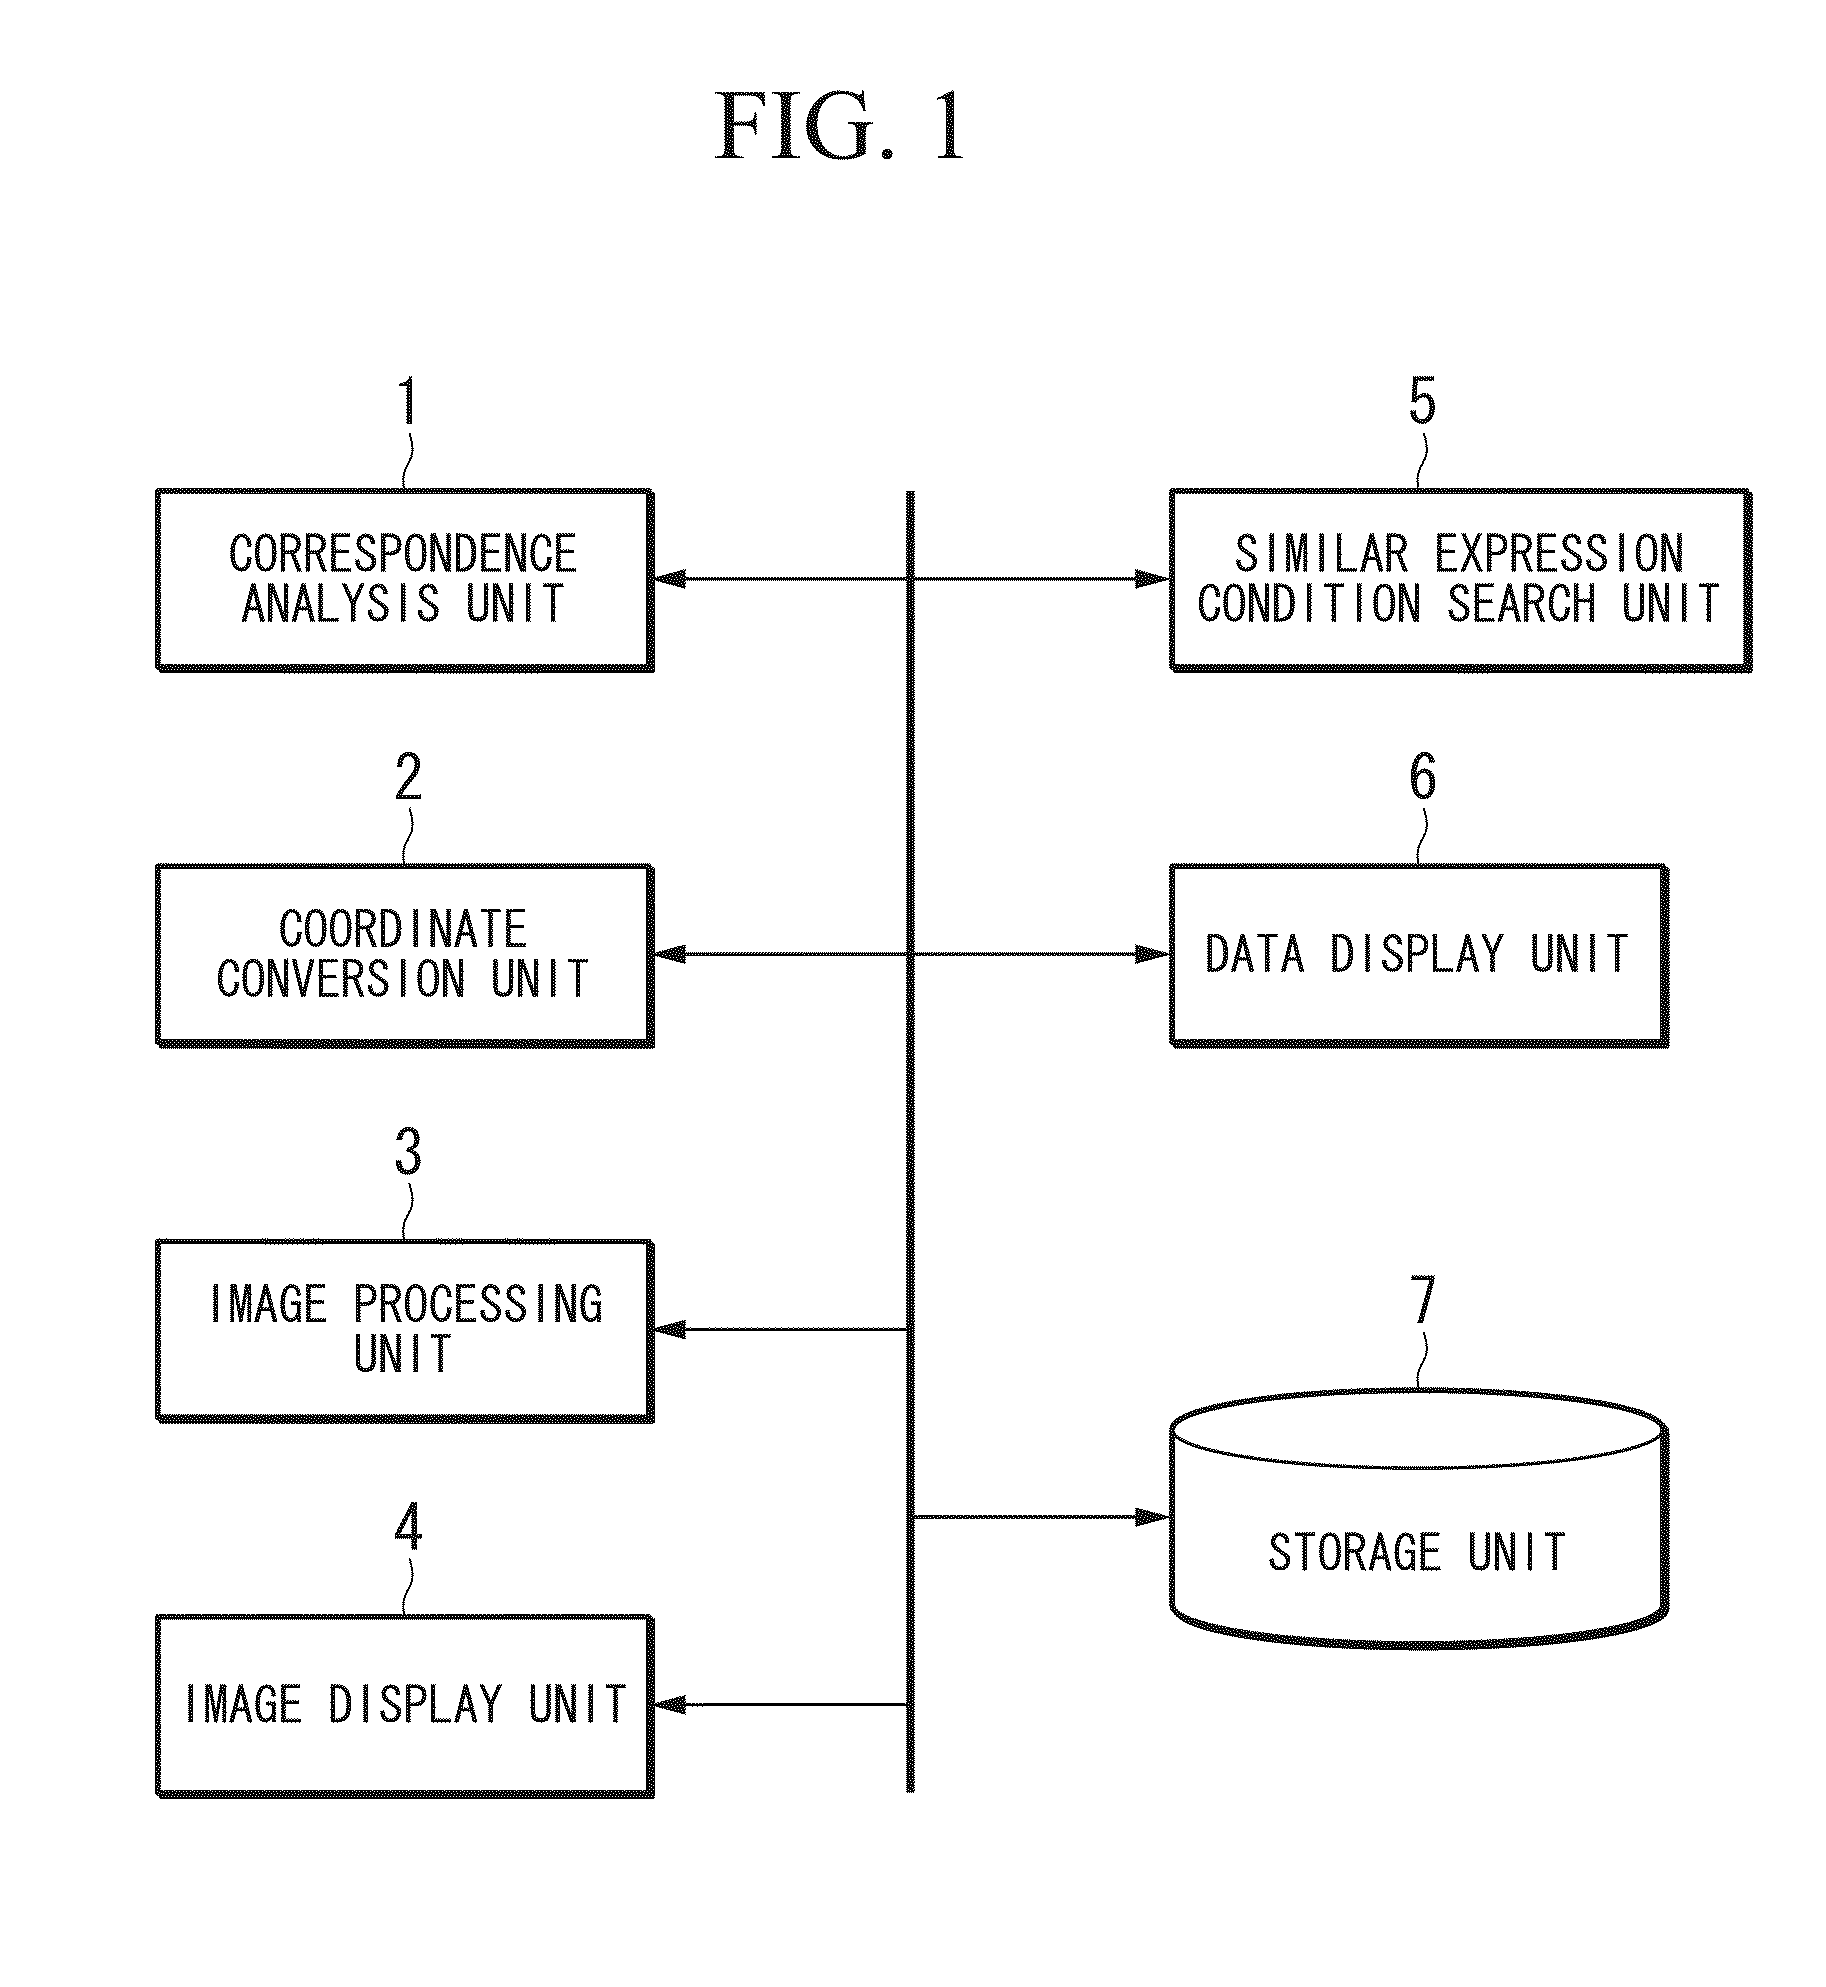
[0042]As described above, according to the invention, by the correspondence analysis using the number of counts of mRNAs of the subject gene to be evaluated under each expression condition, each subject gene is plotted in a space (analysis space) with the coordinate value corresponding to each expression pattern and displayed in a dimension which can be displayed on the image display unit. For this reason, it is possible for the user to easily extract a gene having a shape approximate to (identical or similar to) the expression profile of an expression pattern including the number of counts of a subject gene under each expression condition, that is, a gene having a similar function from the display screen of the image display unit.
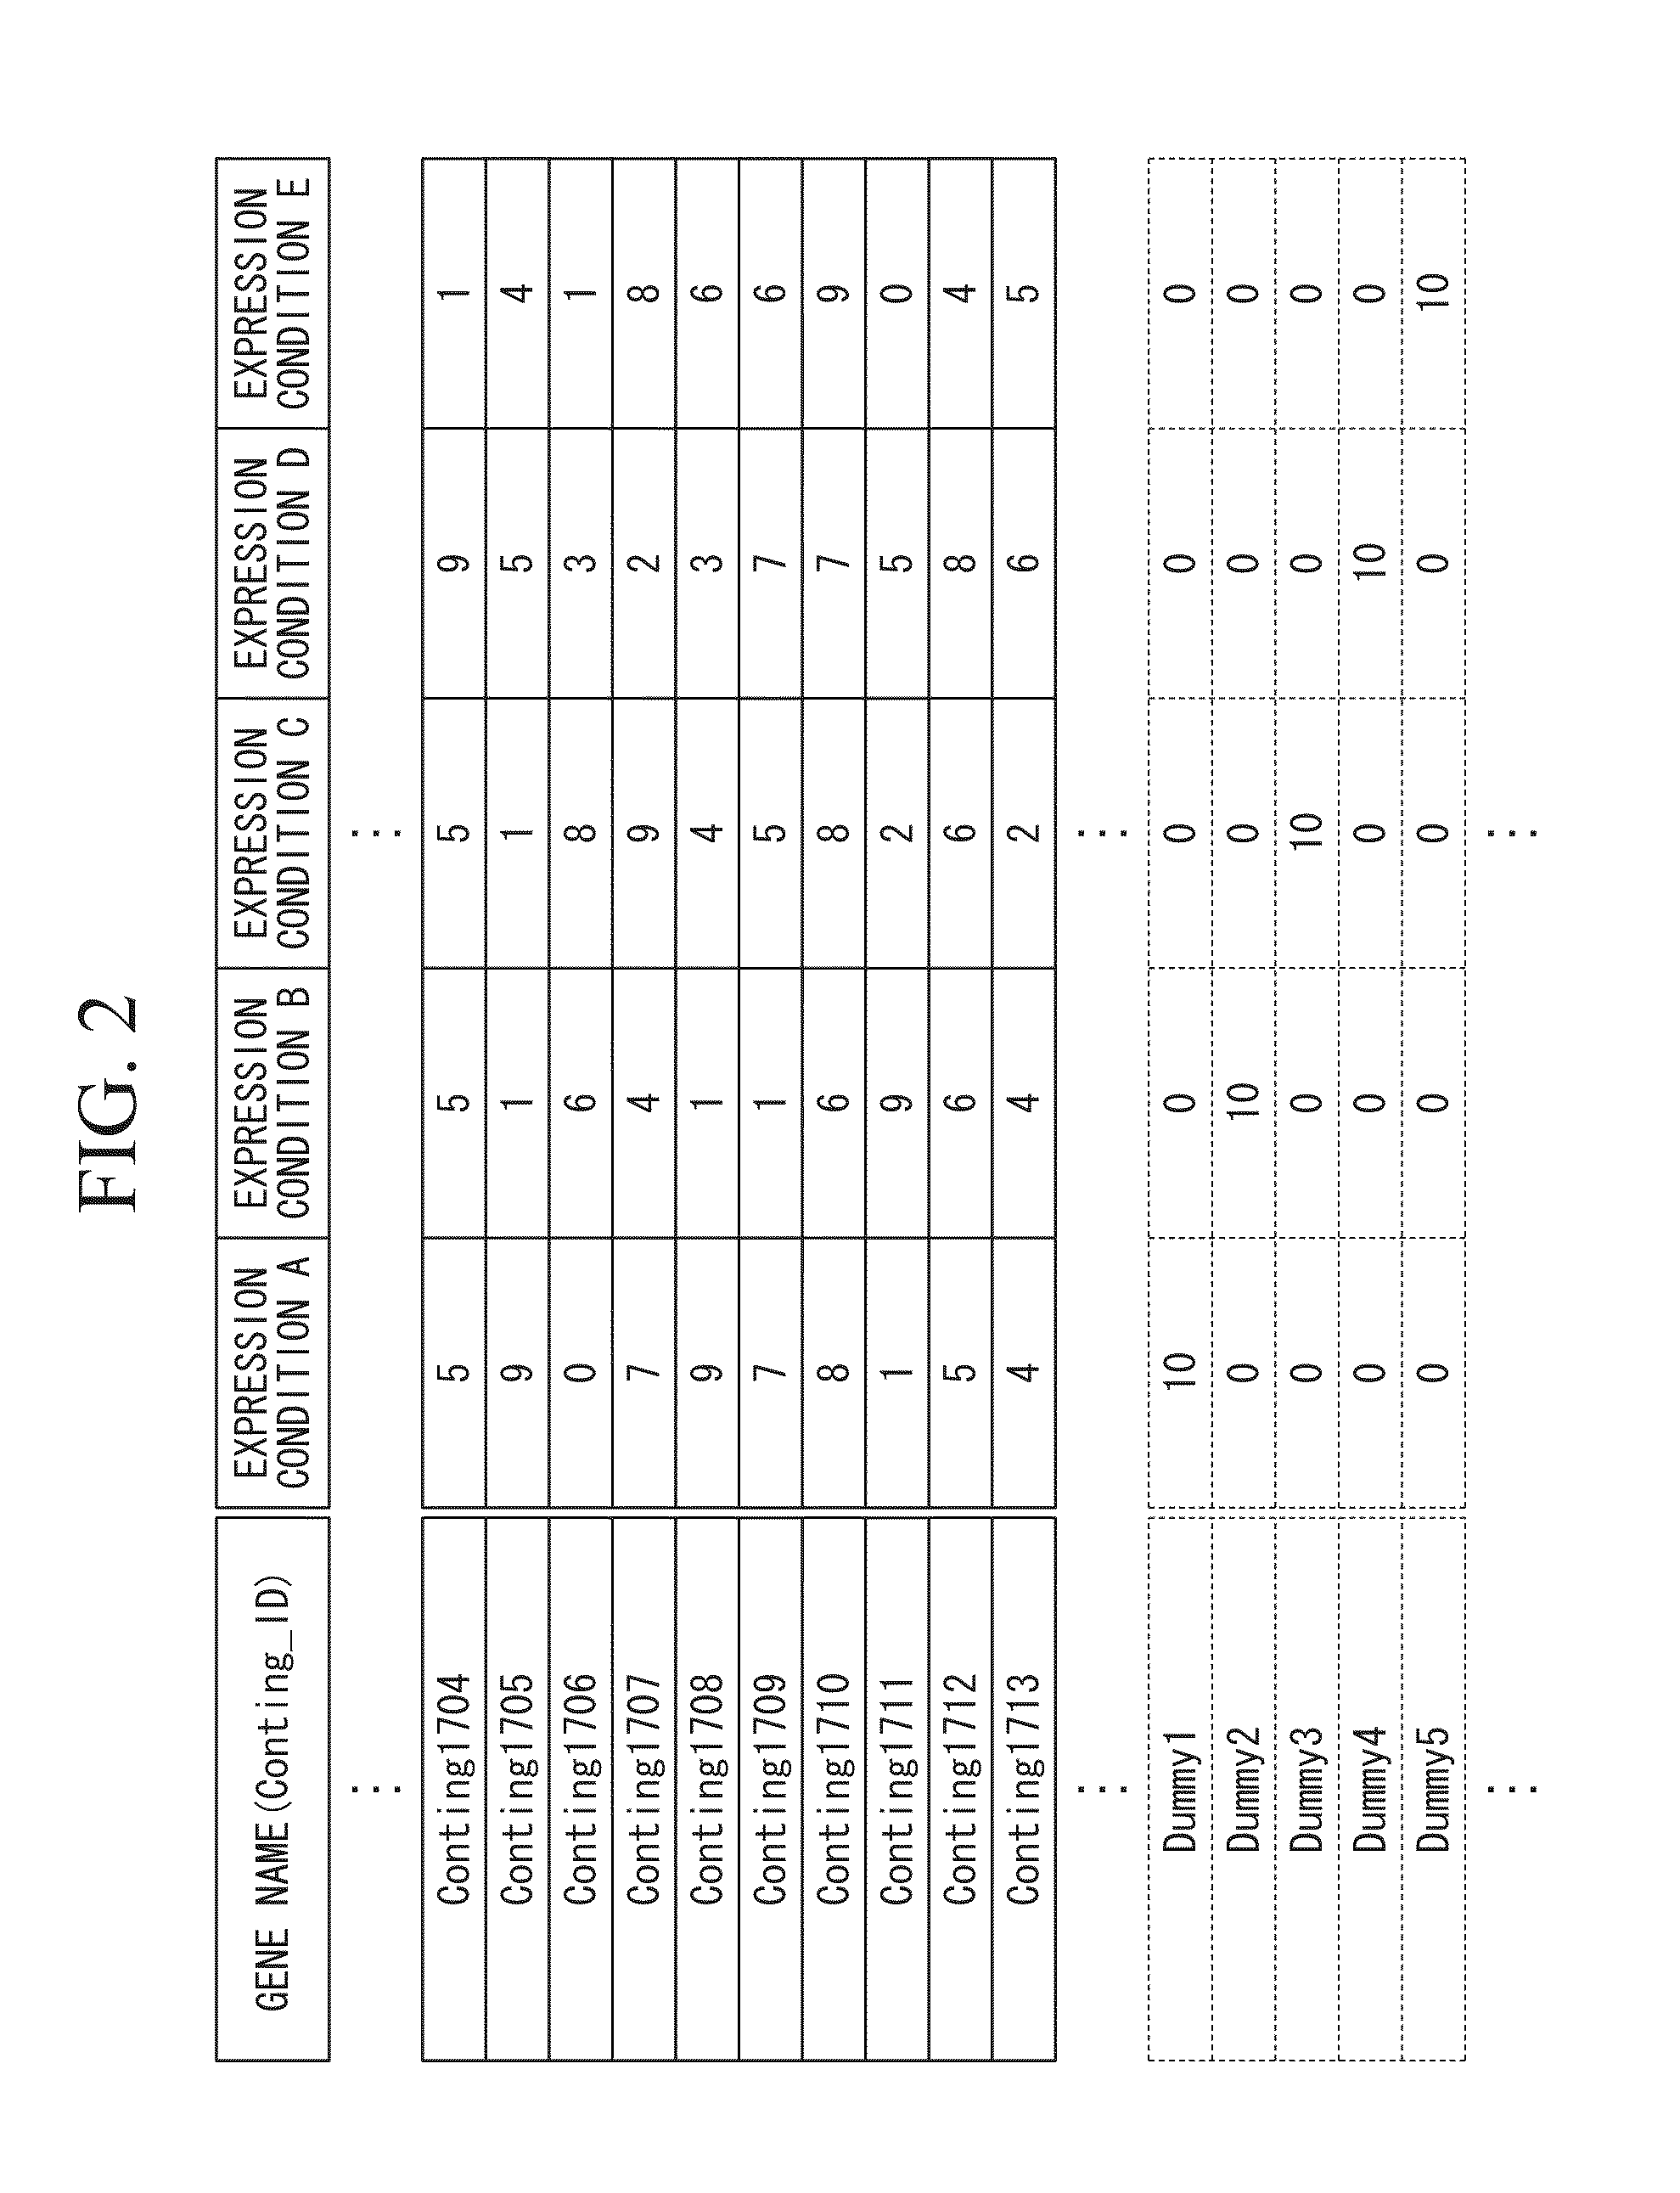
[0043]According to the invention, the expression pattern of a specific gene which is expressed under only any of expression conditions is included in a subject gene group having subject genes to be analyzed (to be evaluated), and thereby each specific gene becomes a marker representing each expression condition. Therefore, it is possible for the user to easily confirm under which expression condition each subject gene to be analyzed is strongly expressed on the display screen of the image display unit.
[0044]According to the invention, the user inputs an arbitrary distance in the space and selects a specific gene, and thereby the similar expression condition search unit extracts a subject gene included in a sphere with the distance around the specific gene as a radius. Therefore, it is possible to easily extract a subject gene having similarity based on the distance set by the user.
[0045]According to the invention, a known gene having a known function is included in a subject gene group having subject genes, and thereby each known gene becomes a marker of an expression condition representing a gene function. Therefore, it is possible for the user to easily confirm whether or not each subject gene has a function approximate to the function of the known gene on the display screen of the image display unit.
[0046]According to the invention, the display image of each gene which is displayed on the display screen of the image display unit is selected, and thereby information regarding a gene, such as the gene sequence of each gene or measurement conditions, is displayed on the display screen of the image display unit. Therefore, it is possible to easily identify unique information of the desired gene while many genes are displayed.
[0047]According to the invention, it is determined whether image display is performed one-dimensionally, two-dimensionally, or three-dimensionally on the basis of the cumulative contribution ratios of a plurality of dimensions obtained by the correspondence analysis, making it easy to view similarity on the display screen of the image display unit. (In the case of two-dimensional display, an expression condition is drawn as a line connecting vertexes as plotting positions where specific expression is made under two conditions (on two principal axes) or a polygon with the plotting positions as vertexes on a two-dimensional plane. In this case, the plotting positions become two-dimensional coordinates.)

Problems solved by technology

However,since research institutes or researchers use 2, e, 10, and the like as the base of the logarithm, coherence is lacking, and there is a problem in that it may be impossible to directly compare data on the Web with each other.
For this reason, in hierarchical clustering (for example, Ewing et al, 1999, Genome Res. 9:950-959 and the like), which is widely used in the clustering analysis, analysis by a general-purpose computer cannot be easily carried out due to an increase in the calculation amount.
However, when the number of genes is equal to or greater than several thousand, it is difficult to output the entire dendrogram to a computer monitor or a printing sheet, and it takes a lot of work to analyze the result from a large-scale dendrogram.
That is, hierarchical clustering has drawbacks in that the calculation amount increases with an increase in the number of genes, in that the topology of the dendrogram is likely to change depending on a given data set, and in that the analysis time rapidly increases along with an increase in the size of a matrix, and thus a CPU and a memory of a computer are further required, and the like.
However, at the time of analysis, it is necessary to determine the number of clusters in advance, and thus they are arbitrary methods.
However, as it is not an analysis method for a profile, expression profiles cannot be compared based on the obtained scores.
There is a problem in that it is difficult to visually recognize a large amount (ten thousand-order) of samples or gene clusters obtained by each of the above-described methods.
However, a researcher is unlikely to easily understand the viewer of the obtained clusters (see FIG. 8).
For this reason, even when plotting is carried out on a scatter diagram, detection is not easily carried out.

Method used


Image

  • System for analyzing expression profile, and program therefor
  • System for analyzing expression profile, and program therefor
  • System for analyzing expression profile, and program therefor

Examples


Embodiment Construction

[0056]Hereinafter, a system for analyzing an expression profile according to an embodiment of the invention will be described with reference to the drawings. The system for analyzing an expression profile of this embodiment estimates, identifies, and predicts genes involved in a phenotype set in advance on the basis of correspondence analysis (for example, described in Noboru OHSUMI, L. Lebart, et al., “Multivariable Descriptive Analysis Method”, 1994, JUSE Press Ltd.) using the number of counts under each expression condition obtained from gene expression profile data.

[0057]The term “expression profile data” refers to the expression patterns of mRNAs of a plurality of genes which are expressed in an individual sample, for example, a tissue, a cell, or the like, in other words, a data cluster including the types of genes and the respective expression levels thereof (or count values under respective expression conditions). Hereinafter, individual expression profile data is simply ref...


PUM


Abstract

The present invention provides a system for analyzing an expression profile in which a large number of expression profile data obtained by a next-generation high-speed sequencer, a similar experimental technique, or the like is analyzed at high speed by a general-purpose computer, gene expression patterns are visualized, thereby easily analyzing to which gene a novel gene is similar in function. A system for analyzing an expression profile which analyzes gene expression profile data includes a storage unit which stores the number of counts of mRNAs expressed from a subject gene to be evaluated as expression data under each of a plurality of gene expression conditions for each subject gene name, a correspondence analysis unit which reads the expression data from the storage unit for each subject gene, and carries out correspondence analysis on the basis of the number of counts under each expression condition in expression data, a coordinate conversion unit which converts n-dimensional (n: natural number) scores obtained by the correspondence analysis to coordinate values for m-dimensionally (m: natural number, m≦n) arranging each subject gene, and an image processing unit which carries out plotting along the corresponding coordinate values for each gene to display the result on an image display unit.

Description

TECHNICAL FIELD [0001]The present invention relates to a system for analyzing an expression profile which analyzes a gene expression profile, or the like, and a program therefor.[0002]Priority is claimed based on Japanese Patent Application No. 2009-063273, filed on Mar. 16, 2009, the content of which is incorporated herein by reference.BACKGROUND ART [0003]With the advancement of genome analysis studies, a large number of novel genes having unknown functions have been identified, and it is necessary to clarify these functions. In order to obtain information regarding such functions, a gene expression pattern corresponding to the expression condition (information representing the condition under which a gene is expressed) is used.[0004]For this reason, with EST, MPSS, SAGE, CAGE, or the like, comprehensive analyses have been performed on the expression of a large number (tens of thousands) of genes obtained from a tissue or cultured cells of a patient with a disease, or from a patho...

Claims


Application Information

Patent Timeline
Patent Type & Authority Applications(United States)
IPC IPC(8): G06F19/26G06F19/00G16B45/00
CPCG06F19/26G06F19/20G16B25/00G16B45/00
Inventor YANO, KENTAROSHIMIZU, AKIFUMI
Owner MEIJI UNIV
Learn More