Eureka AIR delivers breakthrough ideas for toughest innovation challenges, trusted by R&D personnel around the world.

Tissue Phasic Classification Mapping System and Method

a phasic classification and mapping technology, applied in the field of tissue phasic classification mapping system and method, can solve the problems of serious bodily injury, wheezing, chest tightness, and other symptoms, and achieve the effects of reducing the risk of infection, and improving the quality of li

Active Publication Date: 2013-01-03
RGT UNIV OF MICHIGAN
View PDF13 Cites 132 Cited by
  • Summary
  • Abstract
  • Description
  • Claims
  • Application Information

AI Technical Summary

Benefits of technology

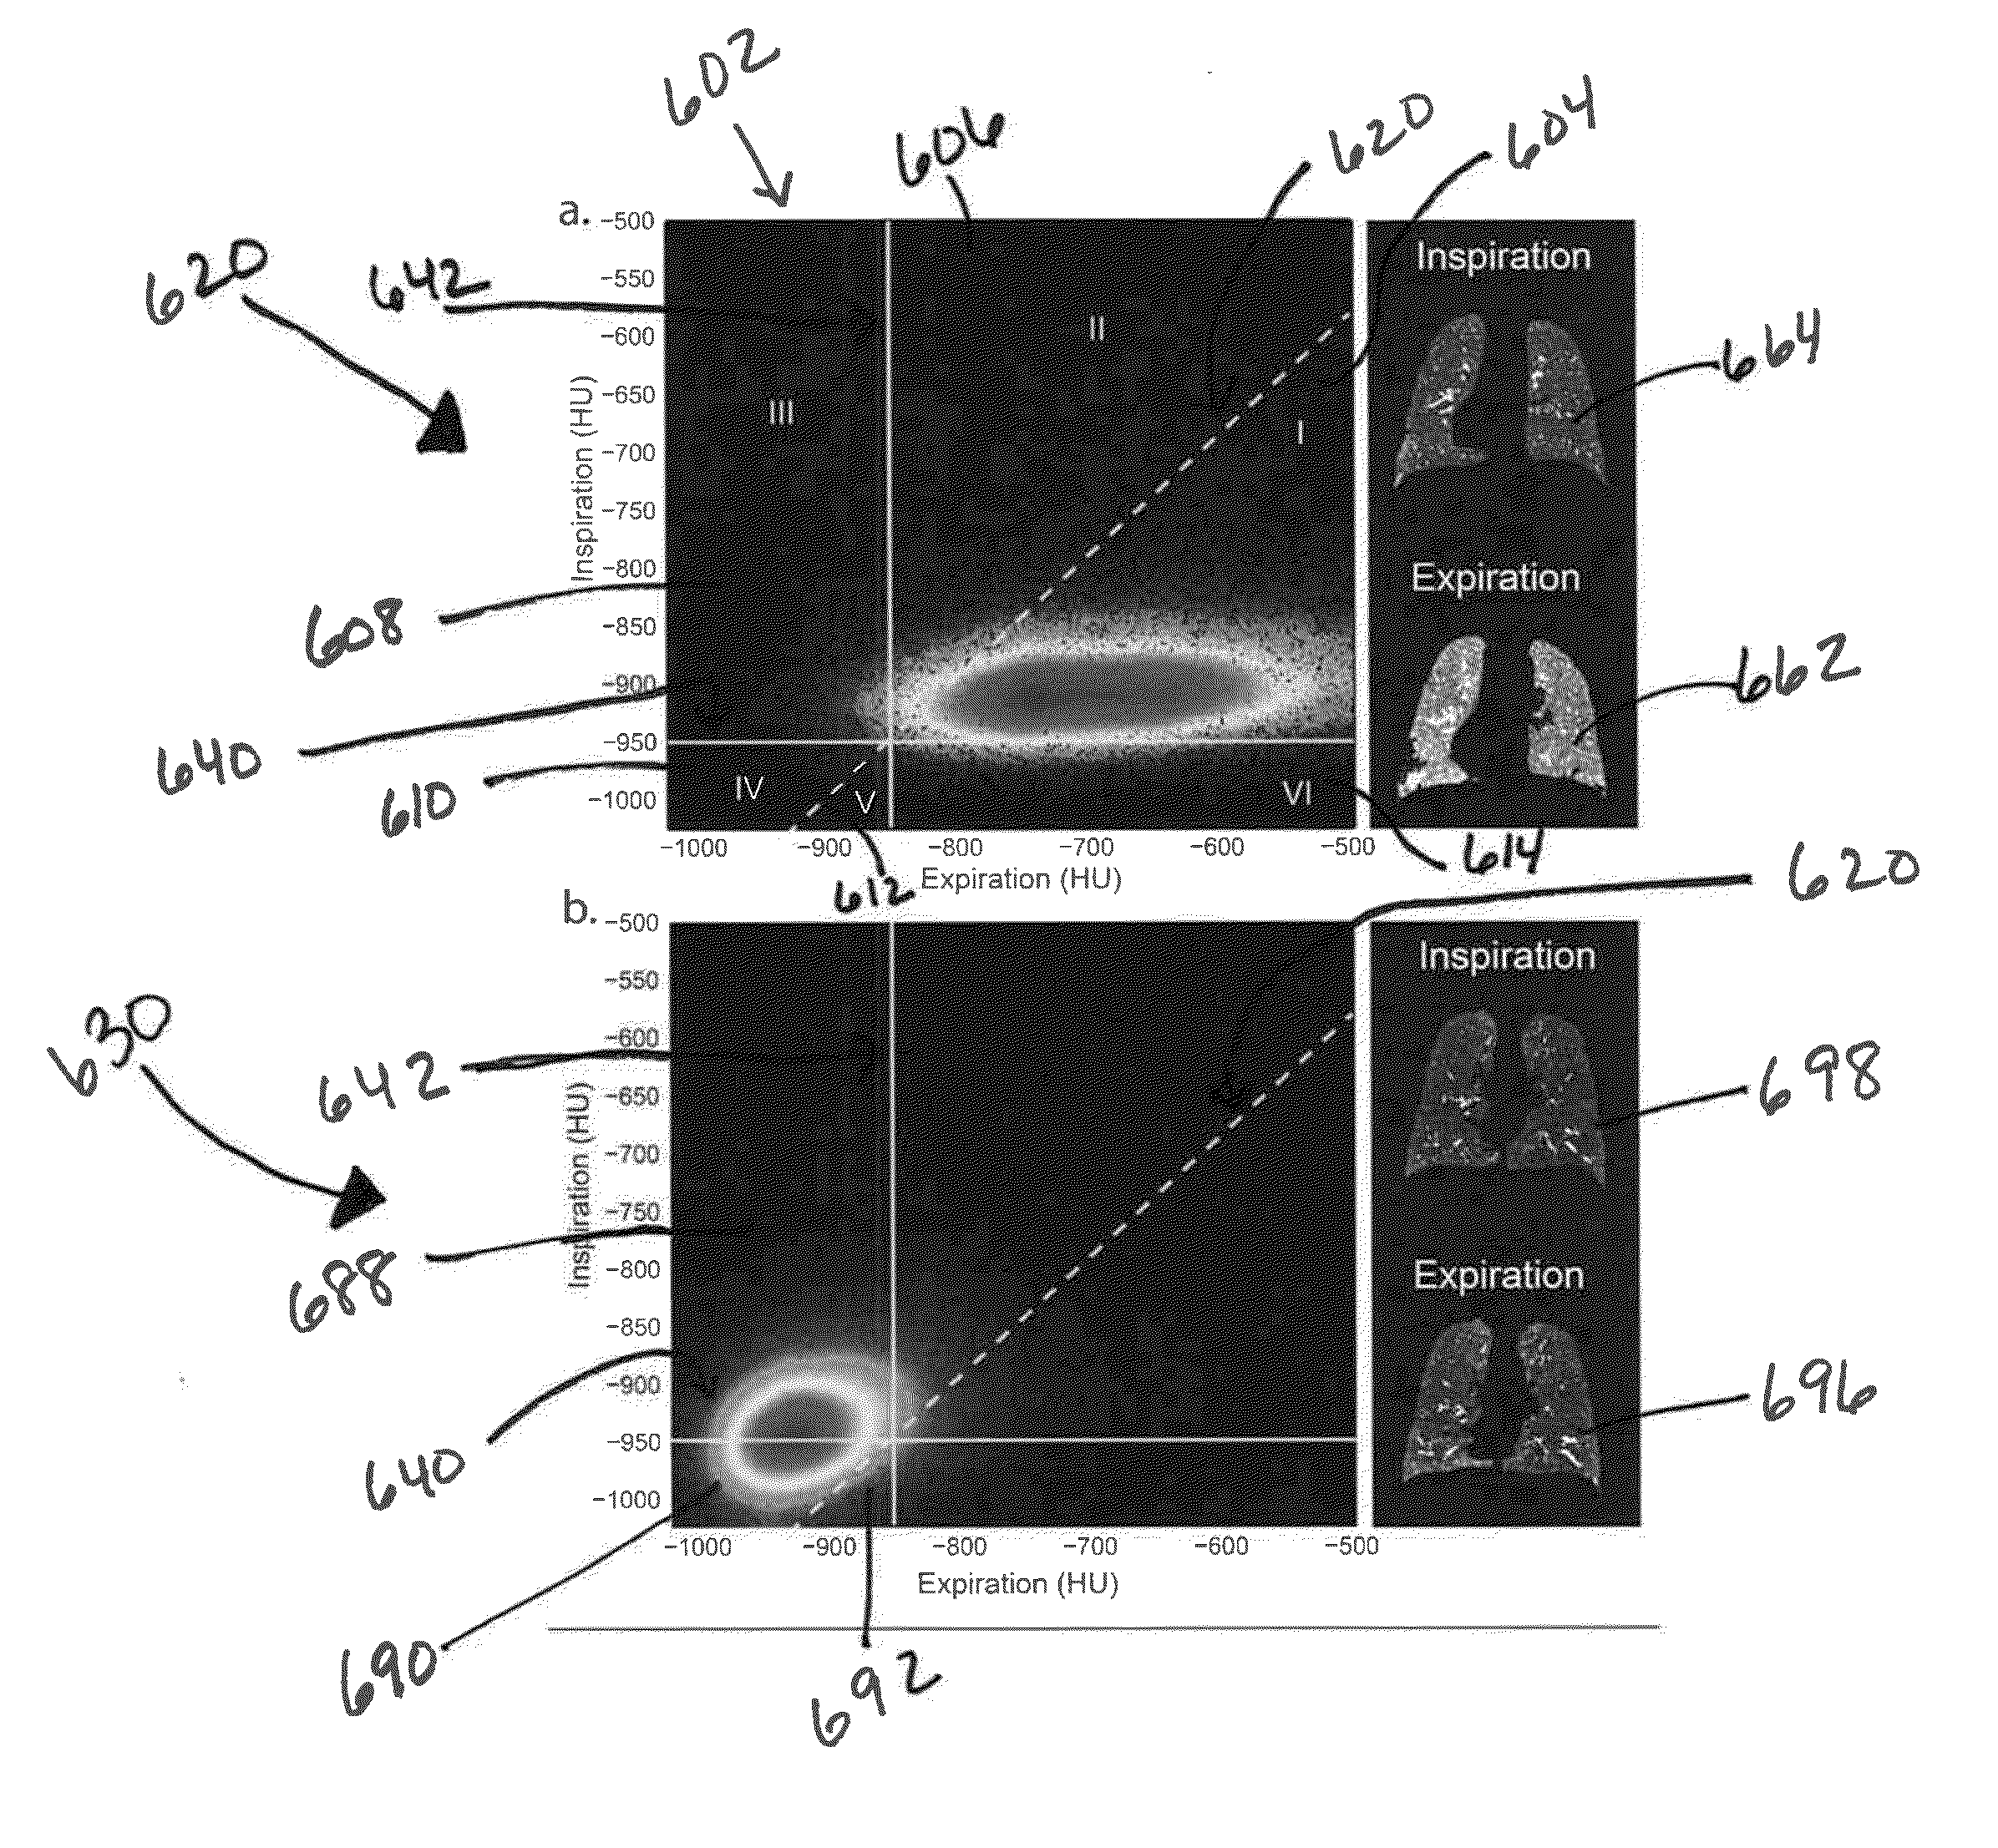
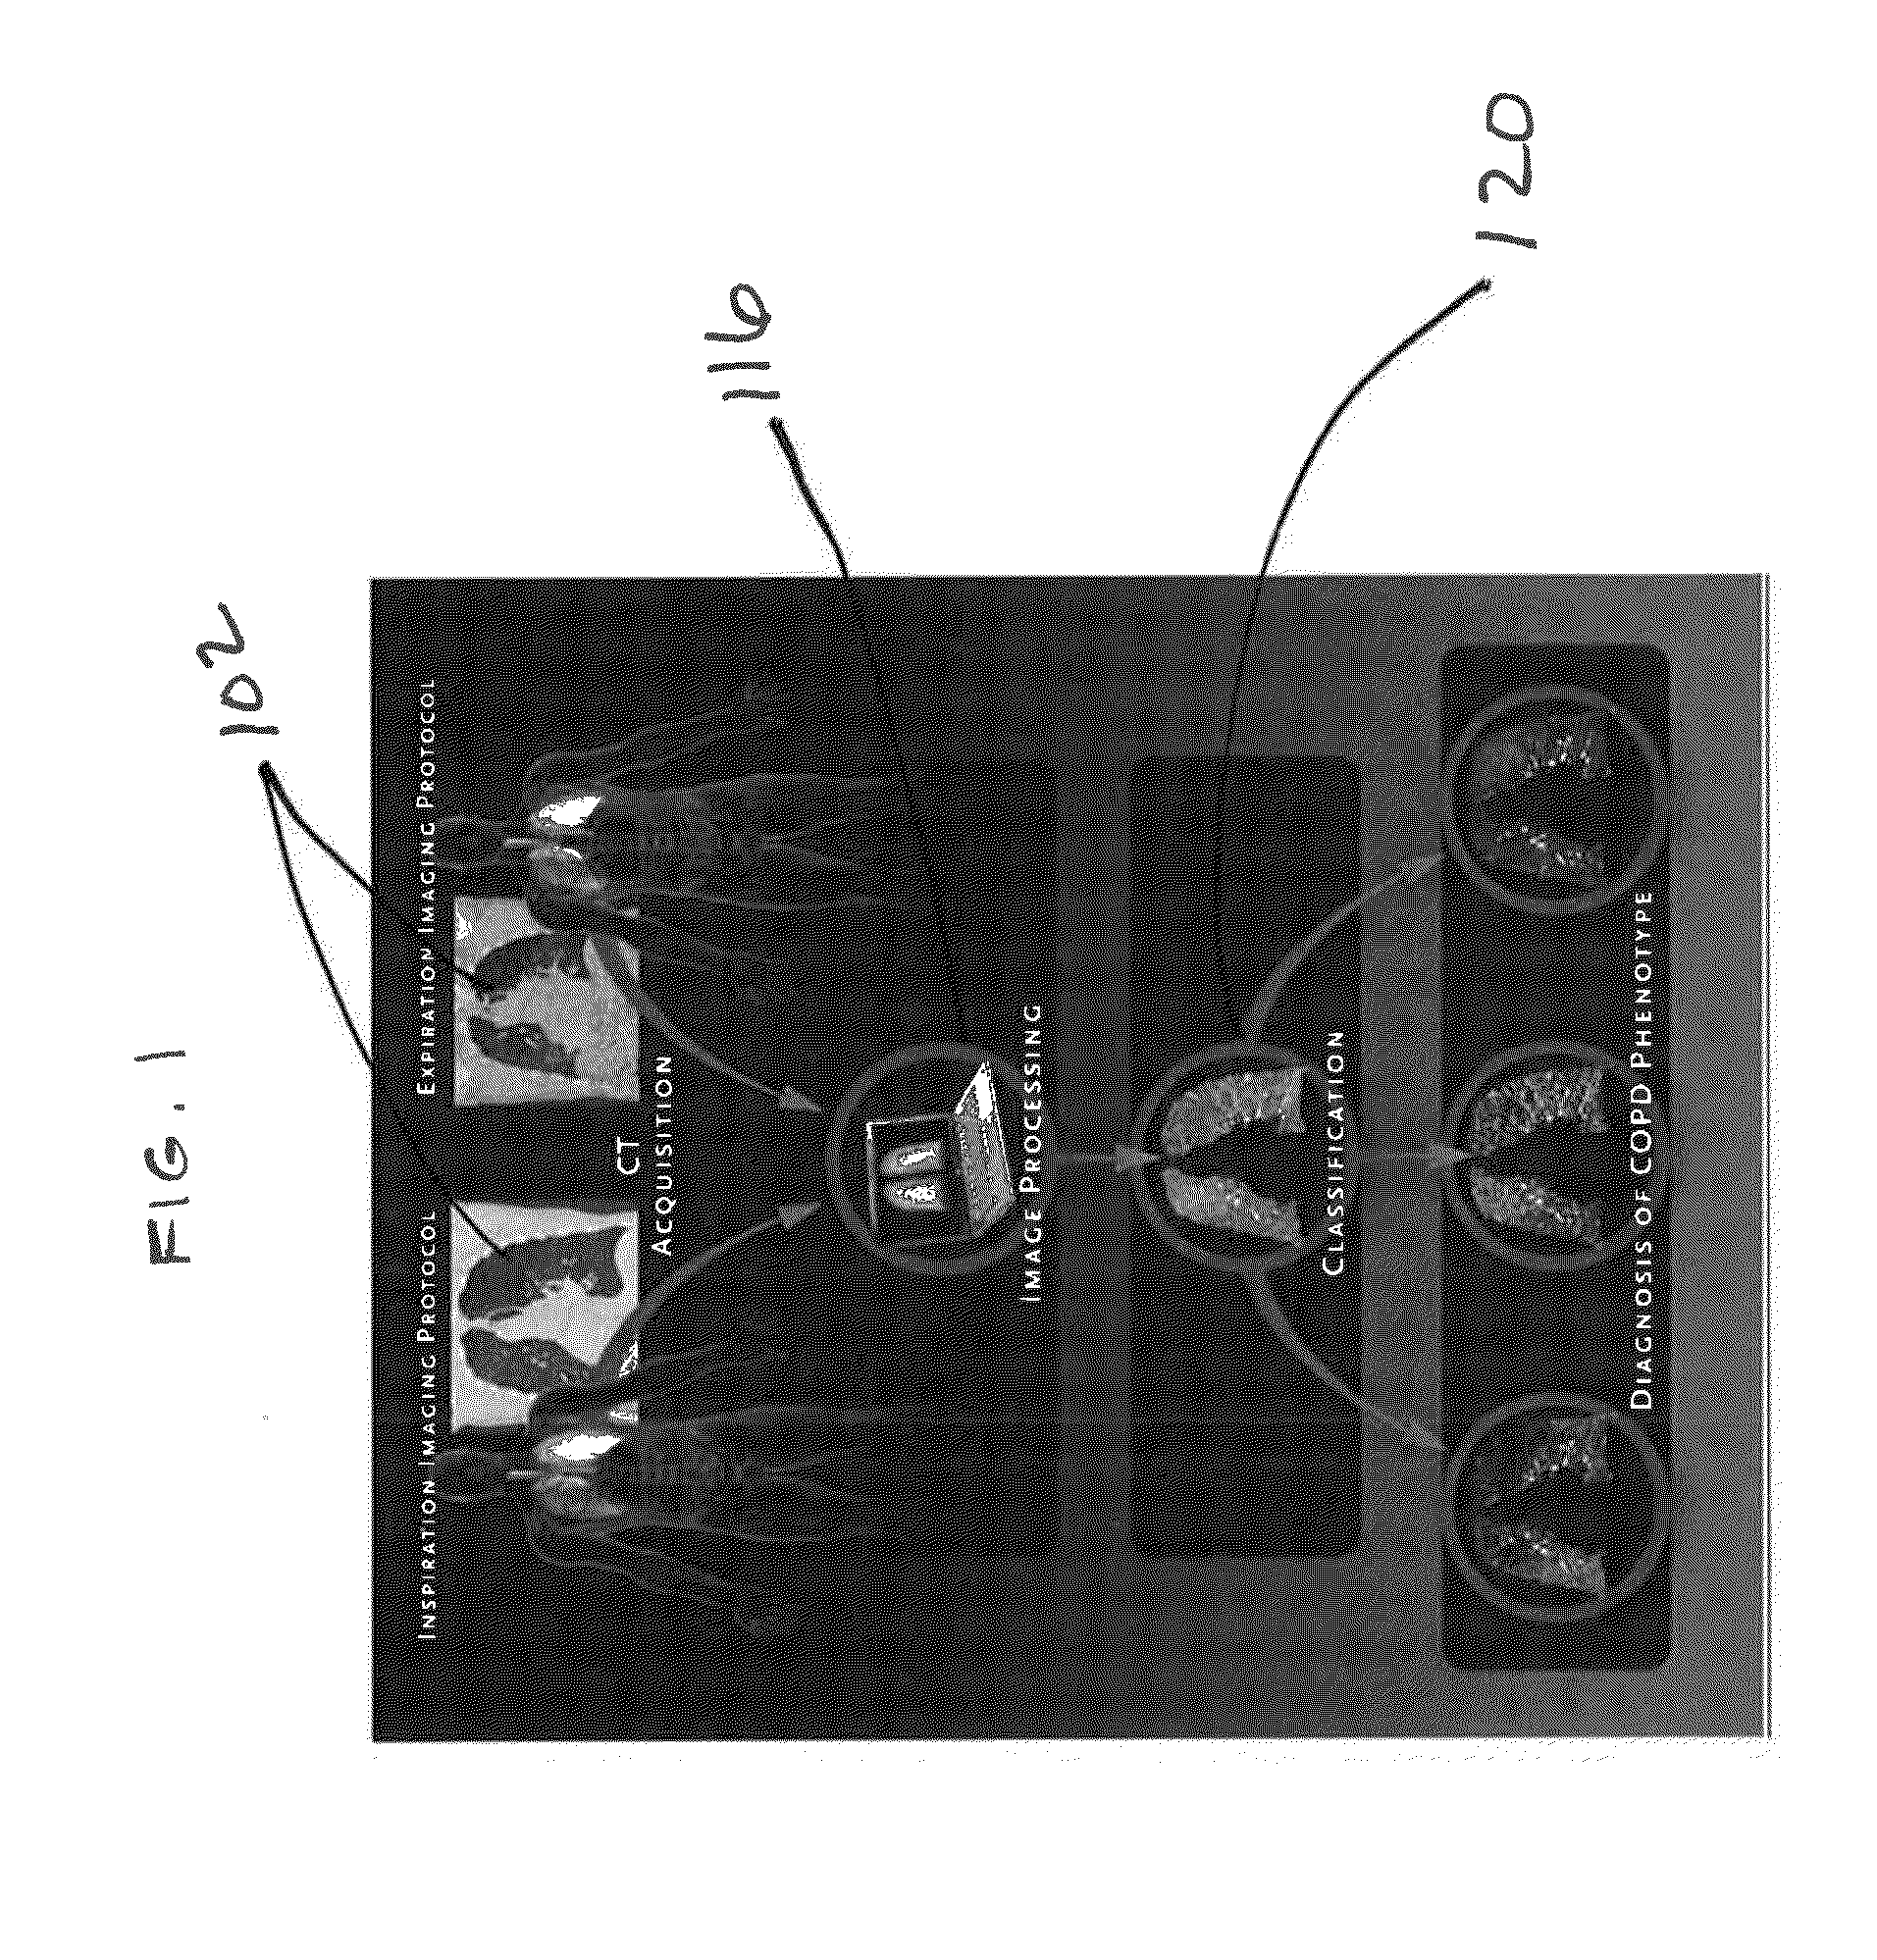
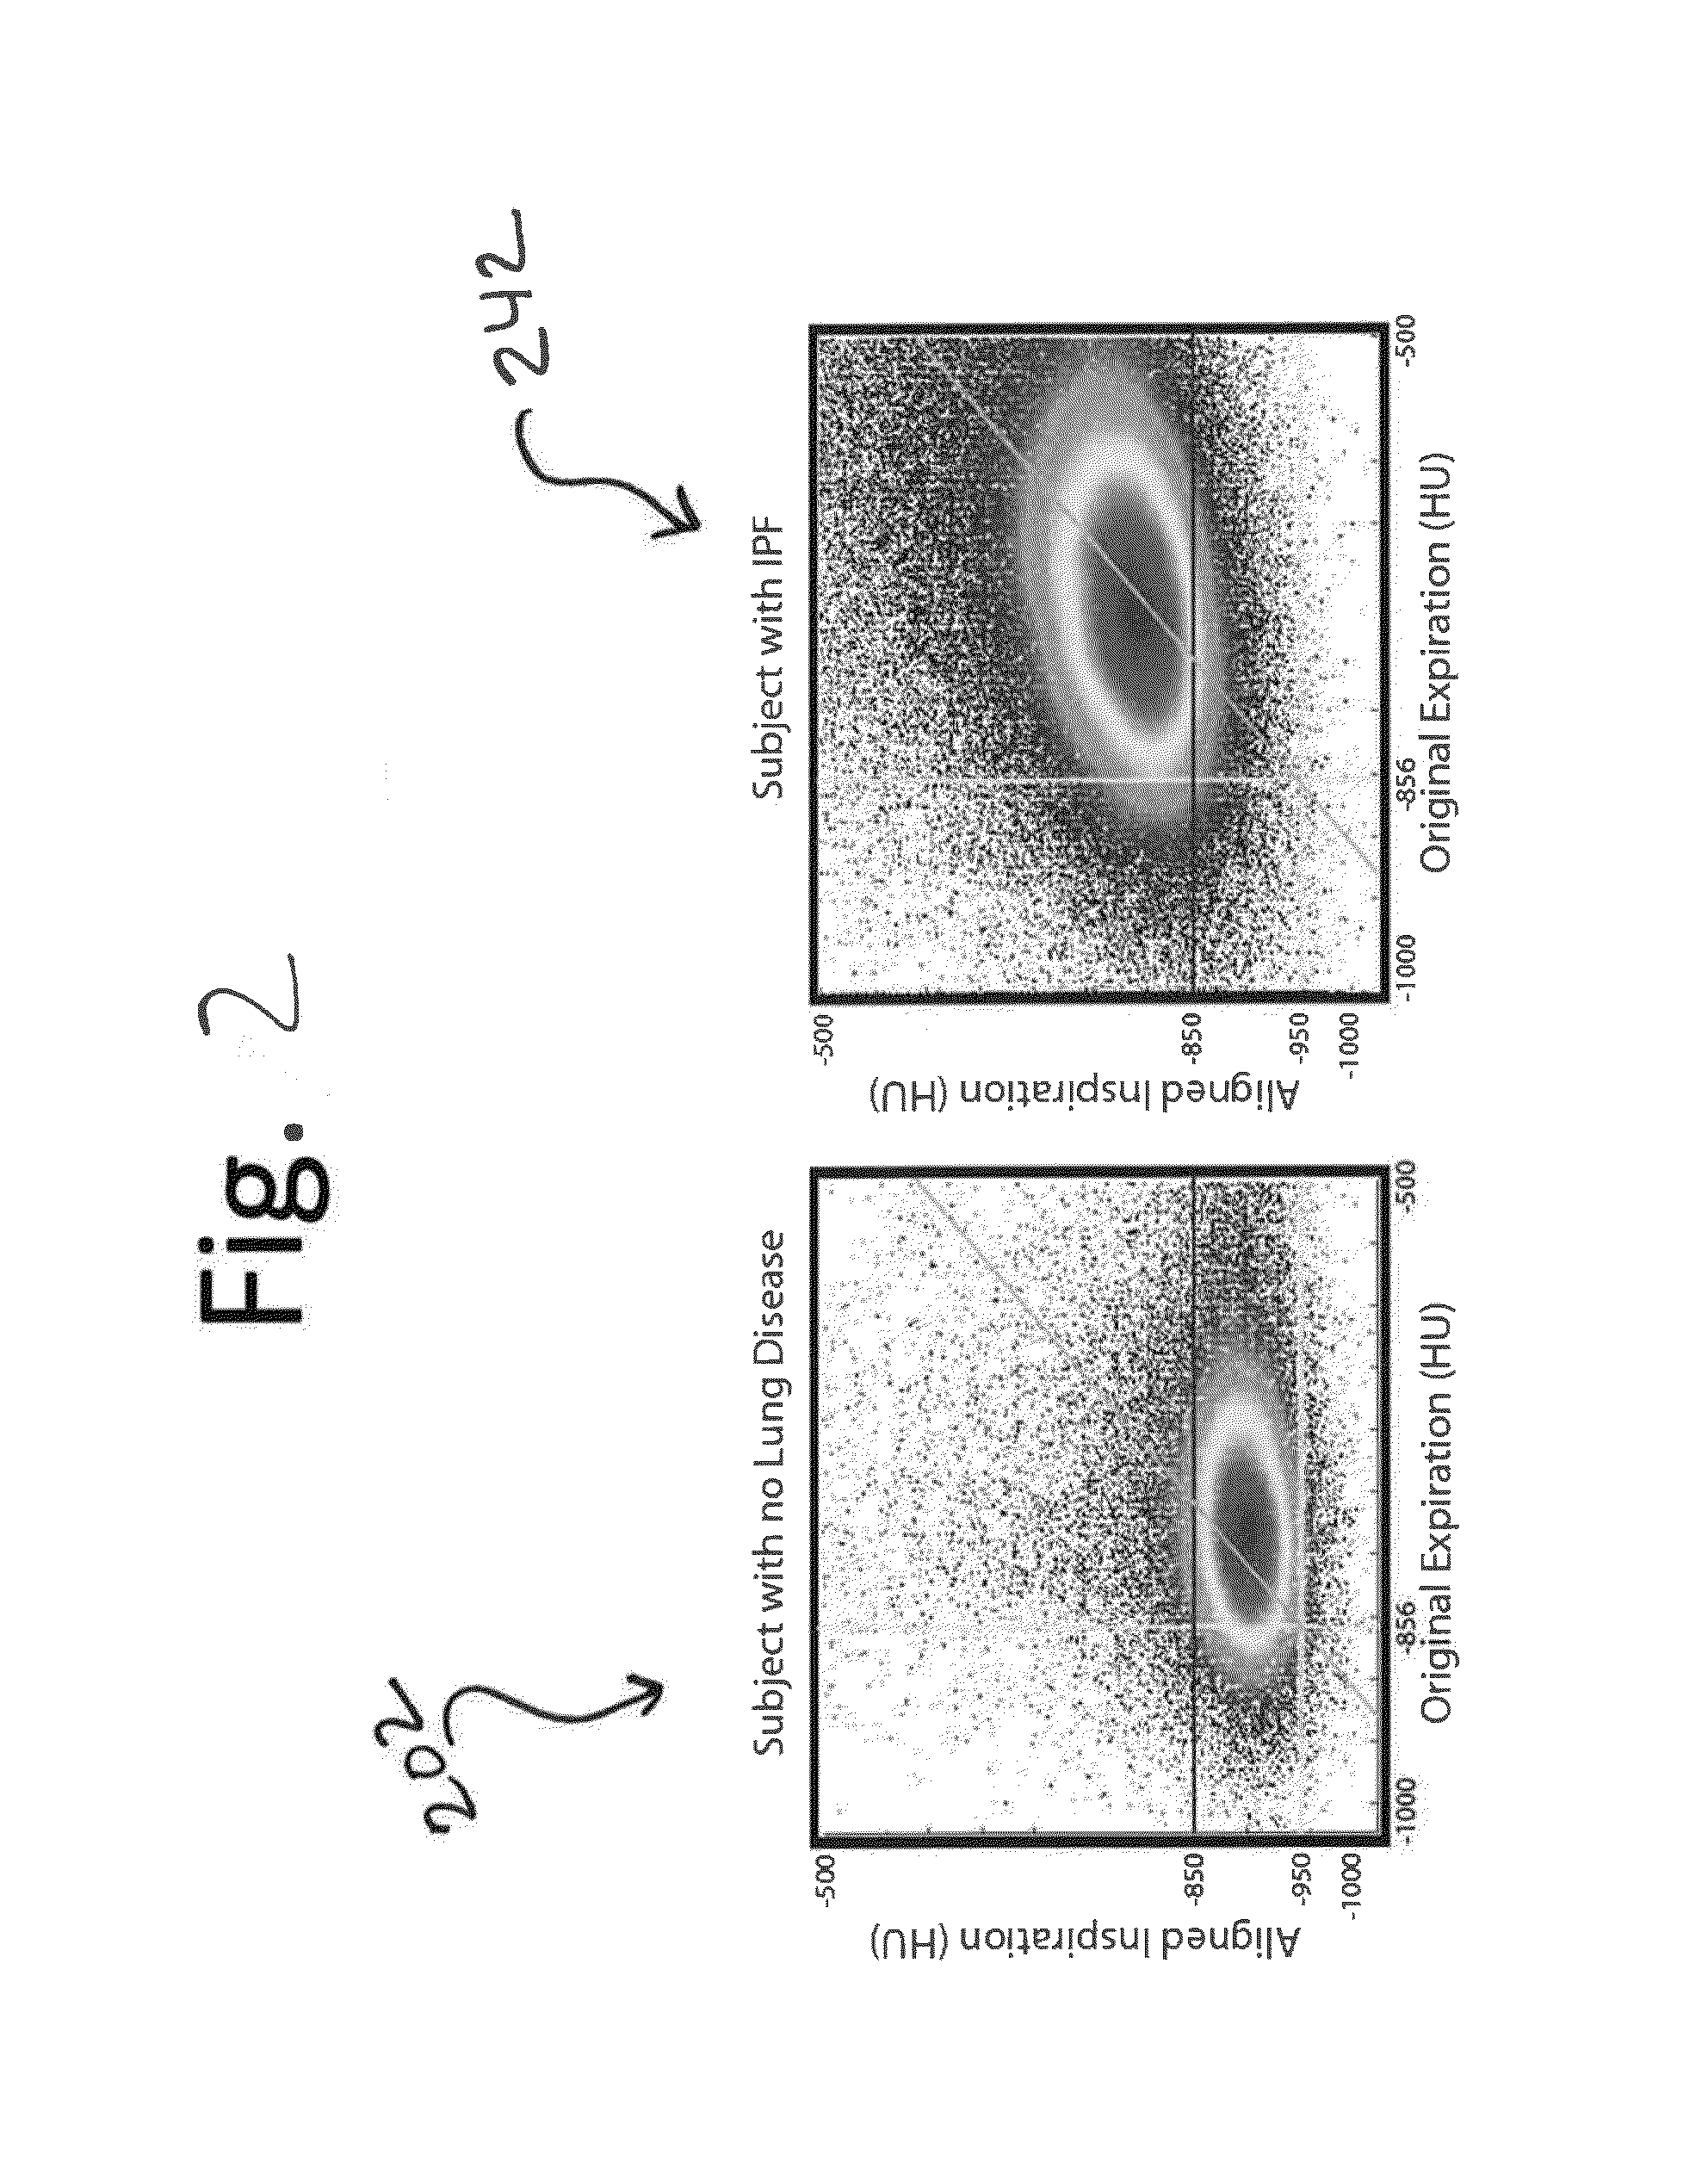
The present patent is about a technique for analyzing different tissue characteristics using a method called phasic classification map (PCM) analysis. This technique involves collecting image data from a sample region while it is in different states of movement, and then comparing the data to create a co-registered image data set. This data set includes a plurality of voxels that have changes in signal values between the different states of movement. A classification mapping data set is then formed based on these changes, which can be used to determine the presence or absence of a pathology condition in the sample region. The technique can also be extended to analyze changes in tissue physiology and pathology over time by collecting and analyzing multi-phasic imaging data.

Problems solved by technology

COPD can cause coughing that produces large amounts of mucus, wheezing, shortness of breath, chest tightness, and other symptoms.
Cigarette smoking is the leading cause of COPD.
In all cases, damage to lung airways may eventually interfere with the exchange of oxygen and carbon dioxide in the lungs, which can lead to serious bodily injury.
Currently, the inability of medical professionals to accurately diagnose a patient's COPD phenotype inhibits such tailored and targeted treatment.
These metrics are easily derived from standard CT protocols, but only provide a global measure of COPD severity lacking the ability to interpret spatial information within the CT scans.
Although extensive research has been devoted to evaluate CT-based techniques for assessing COPD severity, no effective techniques have been developed for using CT-based imaging to identify COPD phenotypes beyond the emphysema metric.

Method used


Image

  • Tissue Phasic Classification Mapping System and Method
  • Tissue Phasic Classification Mapping System and Method
  • Tissue Phasic Classification Mapping System and Method

Examples


example 1

Lung Tissue and COPD Analysis Example

[0074]The study described in this example included subjects with a smoking history of at least 10 pack-years that were enrolled at the University of Michigan as part of the COPDGene Study. The subjects had no history of any active lung disease other than asthma, emphysema or COPD. Of these subjects, a total of 52 were analyzed for this retrospective study of subjects recruited at a single site, the University of Michigan. Patients underwent spirometry using the EasyOne™ spirometry system (ndd Inc. of Zurich, Switzerland) before and after the administration of short-acting bronchodilating medication (albuterol). Quality control was performed for all spirometry tests using both an automated system and manual review. Patient characteristics are summarized below in Table 1.

TABLE 1Patient characteristics and results of pulmonary function tests in52 patientsCharacteristicMean + / − SDMedianRangeAge62.8 (8.6) 63.746-80Pack-years  52 (28.2)45.5 11-156BMI27...

example 2

COPD Components: Emphysema and Small Airways Disease

[0088]Inspiratory and expiratory CT scans were acquired from 10,000 patients as part of the COPDGene Study (www.copdgene.org). Of these patients, 194 (n=194) with at least a 10 pack-year history of cigarette smoking and with varying GOLD statuses, as defined by Global Initiative for Chronic Obstructive Lung Disease (GOLD; www.goldcopd.com), were assessed via embodiments of the present disclosure. Subjects included had no history of any active lung disease other than asthma, emphysema or COPD. Patients underwent spirometry using the EASYONE spirometry system (ndd Medical Technologies Inc., Zurich, Switzerland) before and after the administration of a short-acting bronchodilator (albuterol). Quality control was performed for all spirometry tests using both an automated system and manual review. The COPDGene Study research protocol was approved by the Institutional Review Board, and all participants provided written informed consent. ...

example 3

[0102]In order to provide some insight into the feasibility of PRM as an imaging biomarker to monitor individuals longitudinally over time, we obtained additional retrospective imaging data outside of the COPDGene Study from subjects who had previously visited the University of Michigan pulmonary clinic and underwent inspiratory / expiratory CT scanning protocol over a period of time. Shown in FIG. 13 are examples of two different subjects 1302, 1304 along with the time intervals between CT exams, PRM metrics normal (green) 1316, fSAD (yellow) 1318, and emphysema (red) 1320 provided as relative volumes 1328, 1330 along with FEVs acquired as a standard PFT. As shown 1330, the subject which had considerable emphysema 1320 and fSAD 1318 at the baseline scan (month 0), had at 11 months later progressive emphysema greater than the loss of fSAD as there was an additional loss of normal functional lung 1316 as well. FEV1 was unchanged from 18% to 17% over this time interval. These two pathol...


PUM


Abstract

A voxel-based technique is provided for performing quantitative imaging and analysis of tissue image data. Serial image data is collected for tissue of interest at different states of the issue. The collected image data may be deformably registered, after which the registered image data is analyzed on a voxel-by-voxel basis, thereby retaining spatial information for the analysis. Various thresholds are applied to the registered tissue data to identify a tissue condition or state, such as classifying chronic obstructive pulmonary disease by disease phenotype in lung tissue, for example.

Description

CROSS-REFERENCE TO RELATED APPLICATIONS[0001]This application claims priority to U.S. Provisional Application No. 61 / 559,498, entitled “Tissue Phenotype Classification Mapping System and Method,” filed Nov. 14, 2011 and U.S. Provisional Application No. 61 / 502,805, entitled “Parametric Response Map as an Imaging Biomarker for Assessment of COPD Severity,” filed Jun. 29, 2011, both of which are hereby incorporated herein in their entirety.FIELD OF THE INVENTION[0002]The present disclosure relates to novel and advantageous systems and methods for monitoring tissue regions and, more particularly, to systems and methods for detecting changes in tissue regions over a period of time, for example, during patient diagnosis or treatment.BACKGROUND OF THE INVENTION[0003]Chronic obstructive pulmonary disease (COPD) is a highly and increasingly prevalent disorder referring to a group of lung diseases that block airflow during exhalation and make it increasingly difficult to breathe. COPD can cau...

Claims


Application Information

Patent Timeline
IPC IPC(8): G06K9/00
CPCG06T7/0016G06T2207/30061G06T2207/20148G06T2207/10081
Inventor ROSS, BRIAN D.GALBAN, CRAIG
Owner RGT UNIV OF MICHIGAN
Why Eureka
Eureka Blog
Learn More