Nmr methods for monitoring blood clot formation

a technology of blood clot and nmr, which is applied in the field of monitoring rheological changes, can solve the problems of dramatic risk of hemorrhage and patient may remain at risk, and achieve the effects of reducing the risk of bleeding or clotting

Active Publication Date: 2014-07-31
T2 BIOSYST
View PDF2 Cites 23 Cited by
  • Summary
  • Abstract
  • Description
  • Claims
  • Application Information

AI Technical Summary

Benefits of technology

[0062]The invention further features a method for reducing the risk of bleeding or clotting in a subject fitted with a heart assist device, the method including: (i) evaluating the hemostatic condition of the subject using a method described herein; and (ii) on the basis of step (i), adjusting an operational parameter (e.g., speed, intensity, pressure, flow, pump volume, or filling volume) of the heart assist device to reduce the risk of bleeding or clotting in the subject. In particular embodiment, the heart assist device is selected from an extracorporeal cardiac bypass machines and implantable blood pumps, such as left ventricula...

Problems solved by technology

If the patient is tested only for anticoagulation and is treated accordingly, this patient may remain at risk due to not being treated with antifibrinolytic agents.
Inhibition of the GPIIb/IIIa receptor is an extremely potent form of antiplatelet therapy that can result...

Method used


Image

  • Nmr methods for monitoring blood clot formation
  • Nmr methods for monitoring blood clot formation
  • Nmr methods for monitoring blood clot formation

Examples


example 1

Monitoring the Blood Clotting Process Using Whole Blood Samples

[0232]The clotting process was monitored using fresh citrated or heparinized whole blood samples. Several different activation pathways were examined

[0233]For the kaolin activation pathway (CK pathway), 1 mL of citrated blood was added to a kaolin vial (PlateletMapping assay kit, Haemonetics). The vial was inverted five times to mix the sample. 34 μL of the blood / kaolin mix was transferred into a 200 μL PCR tube pre-heated at 37° C. 2 μL of the 0.2M CaCl2 was added to the PCR tube and the T2 measurement was started immediately.

[0234]For the activator pathway (A pathway), 1 μL of freshly prepared activator solution (A-P1, PlateletMapping assay kit, Haemonetics, also referred to herein as “RF”) was added to a 200 μL PCR tube pre-heated at 37° C. 36 μL of blood collected in a heparinase vial was added to the PCR tube and the sample was mixed with a pipette tip 3-4 times. The T2 measurement was started immediately.

[0235]For ...

example 2

Data Extraction Using an Algorithm for Interpreting Blood Clotting in a Sample

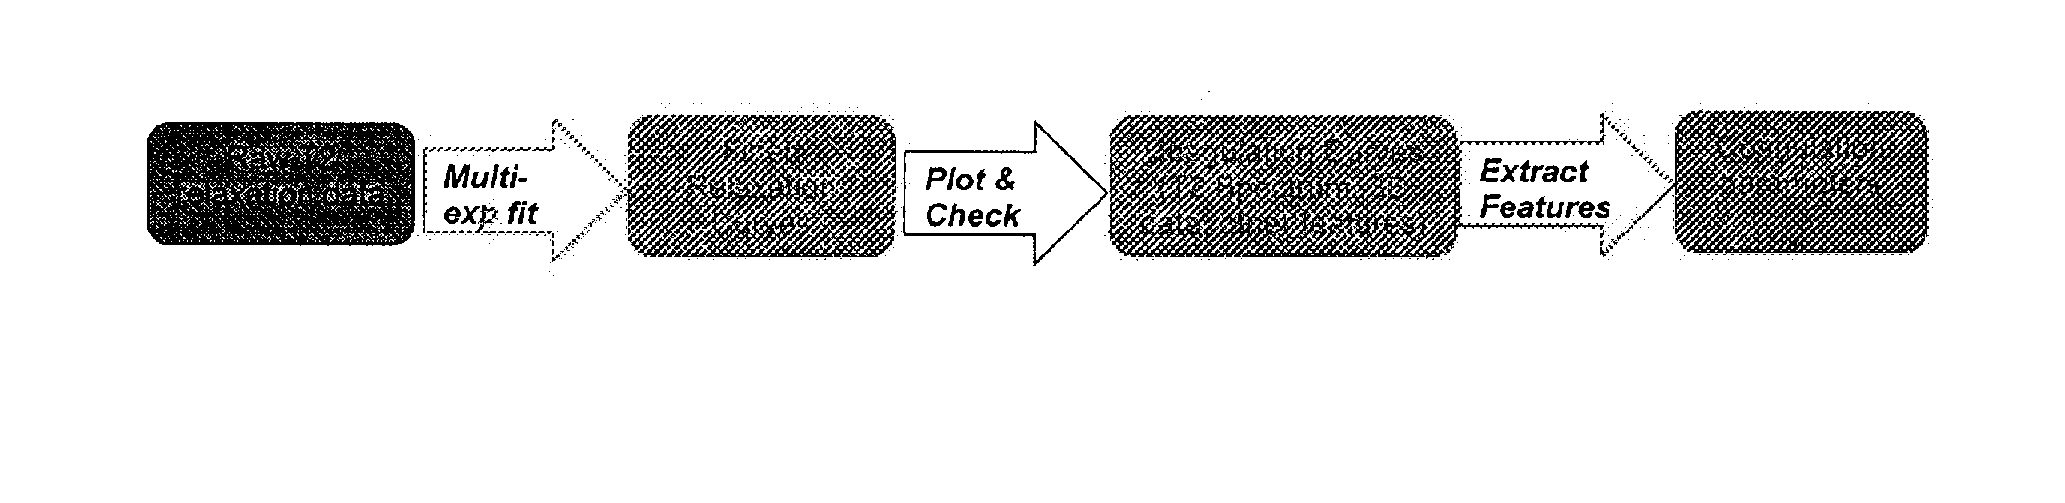
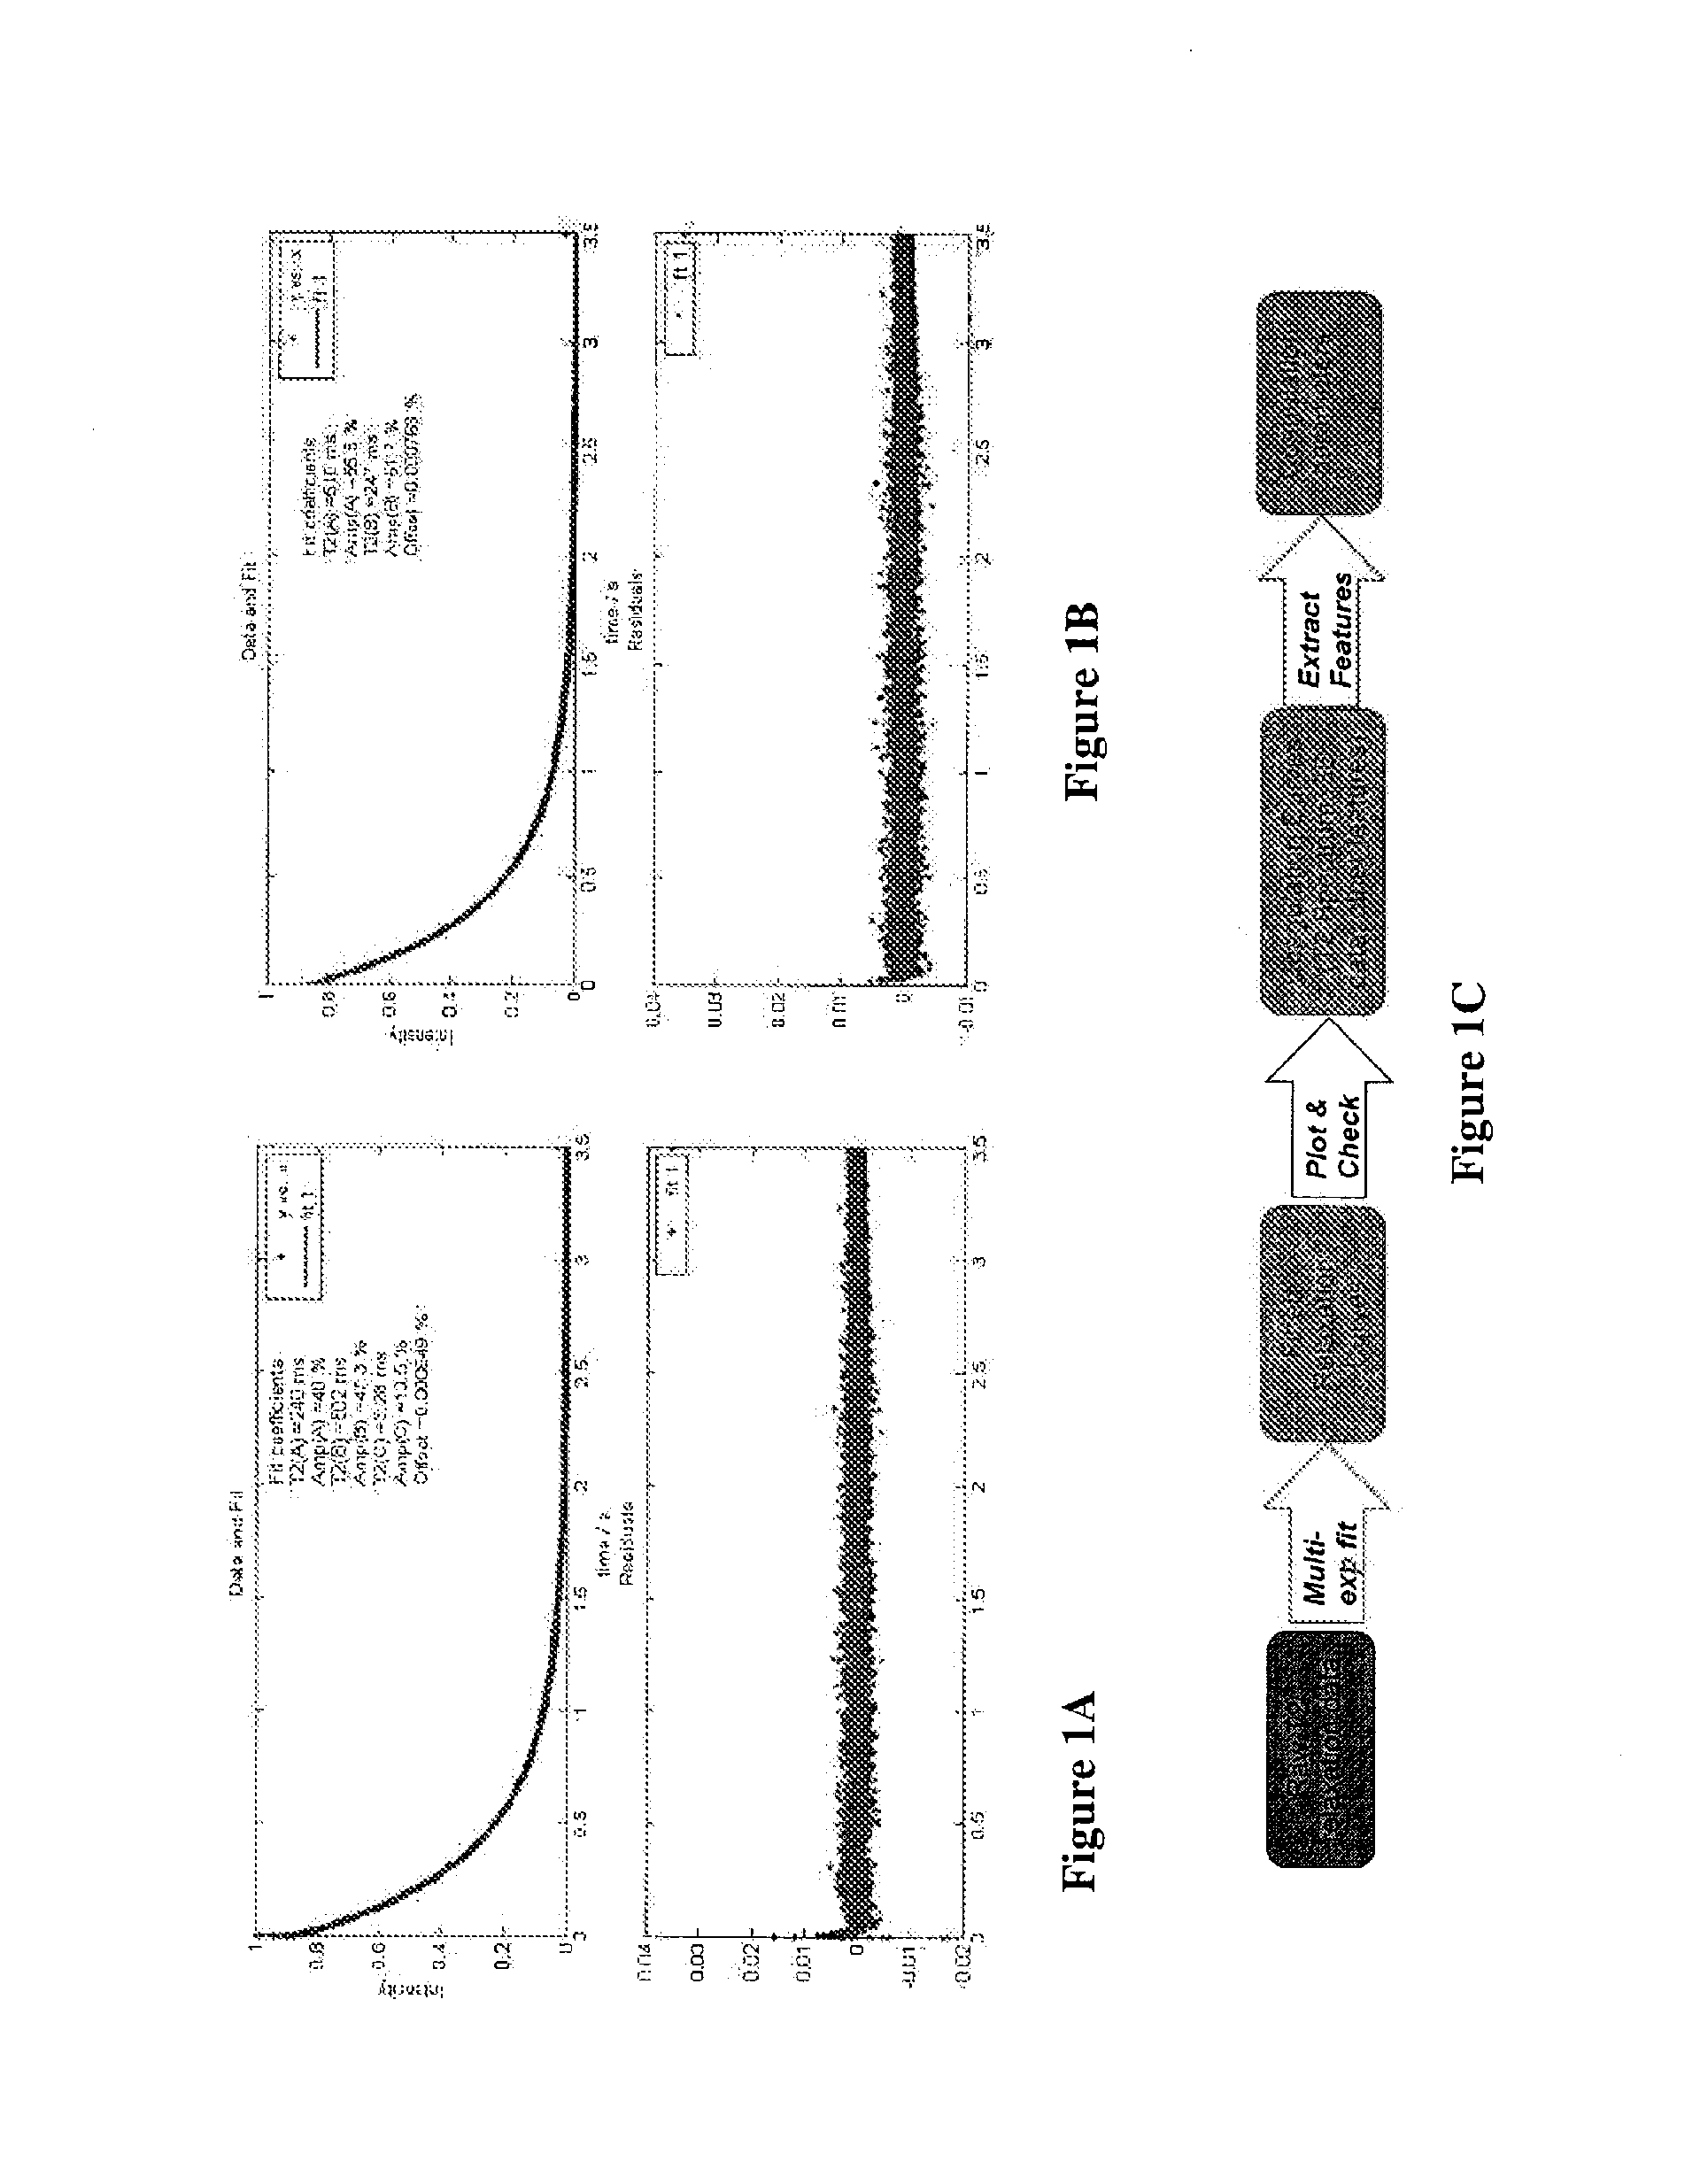
[0237]The data output from the T2reader of Example 1 was processed using a three-step method of performing a bi-exponential fit, plotting and checking, and feature extraction:

[0238]Bi-Exponential Fit

[0239]The read time was registered by NDXClient. The complex y data was converted to magnitude and normalized. The initial 25 milliseconds of x and y was removed. Each relaxation curve was fit using the default non-linear least square method. The curves were fitted to a bi-exponential equation using start points (e.g., seeds) for AmpA, AmpB, T2A, and T2B with fixed seeds used for the first five time points. The seed for the sixth time point was obtained from the average of the first five time points. Generally, time points were seeded with output from the previous time point. Negative values for parameters were not allowed. Alternatively, the data can be fit initially in the middle of the time series, working s...

example 3

Use of a Capillary Method for Measuring Clotting Behaviors

[0244]A capillary tube was used to collect a 2- to 5-μL blood sample from a patient. The blood sample was collected from a fingerstick using a lance, and the sample was collected into a heparinized capillary tube and capped with clay. Alternatively the blood was collected in a pyrex tube and capped with clay. Alternatively the blood sample was collected in a glass Dagan capillary tube and capped with clay and did not contain an activator. Data for T2 NMR relaxation rate was recorded from the capillary sample using a T2reader. It was determined that the collected data was monoexponential and that this may reflect a different clot structure than is present in standard CK curves. Presumably, the surface of the capillary induces blood clotting.


PUM


Abstract

The invention features a method of monitoring a clotting process by measuring a signal characteristic of the NMR relaxation of water in a sample undergoing clotting to produce NMR relaxation data and determining from the NMR relaxation data a magnetic resonance parameter of water in the sample characteristic of the clots being formed.

Description

CROSS-REFERENCE TO RELATED APPLICATIONS[0001]This application claims benefit of U.S. Provisional Application No. 61 / 507,307, filed Jul. 13, 2011; U.S. Provisional Application No. 61 / 537,396, filed Sep. 21, 2011; U.S. Provisional Application No. 61 / 538,257, filed Sep. 23, 2011; U.S. Provisional Application No. 61 / 560,920, filed Nov. 17, 2011; U.S. Provisional Application No. 61 / 596,445, filed Feb. 8, 2012; and U.S. Provisional Application No. 61 / 625,945, filed Apr. 18, 2012, all of which are hereby incorporated by reference.BACKGROUND OF THE INVENTION[0002]The invention features methods for monitoring rheological changes in an aqueous sample.[0003]Blood is the circulating tissue of an organism that carries oxygen and nutritive materials to the tissues and removes carbon dioxide and various metabolic products for excretion. Whole blood consists of a pale yellow or gray yellow fluid, plasma, in which are suspended red blood cells, white blood cells, and platelets.[0004]An accurate meas...

Claims


Application Information

Patent Timeline
IPC IPC(8): G01N33/86A61M1/10A61M60/117A61M60/122A61M60/178A61M60/216A61M60/508
CPCA61M1/1086G01N33/86G01N24/08G01R33/448A61B5/7246A61B5/02007A61B5/0263A61M2205/33A61M2205/3303A61M2230/20A61M2230/207Y02A90/10A61M60/122A61M60/148A61M60/508A61M60/117A61M60/216A61M60/178G01N24/088G01N2800/226G01N2800/52
Inventor LOWERY, JR., THOMAS J.PAPKOV, VYACHESLAVMASSEFSKI, JR., WALTER W.DHANDA, RAHUL K.THAYER, EDWARD C.
Owner T2 BIOSYST
Why Eureka
Try Eureka