Quantitative elemental profiling in optical emission spectroscopy

a technology of optical emission spectroscopy and elemental profiling, applied in the field ofspectral analysis, can solve the problems of user or operator, measure of confidence prevents complete trust, and quantitative evaluation of the quality of this assignment, and achieves the effect of facilitating the spectrum being a more accurate multimodal probabilistic distribution

Active Publication Date: 2015-06-04
UNIV OF CENT FLORIDA RES FOUND INC
View PDF13 Cites 27 Cited by
  • Summary
  • Abstract
  • Description
  • Claims
  • Application Information

AI Technical Summary

Benefits of technology

[0024]The methodology may further include correcting fir a background of the spectrum and extracting noise from the spectrum to facilitate the spectrum being a more accurate multimodal probabilistic distribution.
[0026]The methodology may further include correcting for a background of the spectrum and extracting noise from the spectrum to facilitate the spectrum being a more accurate multimodal probabilistic distribution.

Problems solved by technology

However, there is no quantitative evaluation of the quality of this assignment.
This lack of a measure of confidence prevents a complete trust in the case of low resolution and forces the user or operator to rely on the experience, training, and skill set of a practitioner.
However, conventional LIBS technology relies on low resolution spectra (10 pm), non-adapted databases, dynamic plasma (broadening and shifts of spectral lines [W. Hübert, G. Ankerhold, “Elemental misinterpretation in automated analysis of LIBS spectra”, Analytical and Bioanalytical Chemistry 400(10), 3273-3278 (2011)]), and a lack of protocol (i.e., the specimen type and apparatus used affects the resultant detection limits, and as such, accuracy and precision can change from test to test depending on these factors).
Even with attempts to increase this resolution by data processing [B. O'Leary, J. A. Kelley, “Utilization of the coherence function with Welch's method for signal analysis in low resolution laser-induced breakdown spectroscopy”, Applied Spectroscopy 64(4), 370-376 (2010)], the LIBS instruments then are not suitable for an indisputable line assignment.
As a result, spectral interferences are nearly unavoidable.
Additionally, there is a lack of precision in tables for spectral analysis since analysis is generally qualitative.
Furthermore, where a definition or use of a term in a reference, which is incorporated by reference herein, is inconsistent or contrary to the definition of that term provided herein, the definition of that term provided herein applies and the definition of that term in the reference does not apply.

Method used


Image

  • Quantitative elemental profiling in optical emission spectroscopy
  • Quantitative elemental profiling in optical emission spectroscopy
  • Quantitative elemental profiling in optical emission spectroscopy

Examples


example

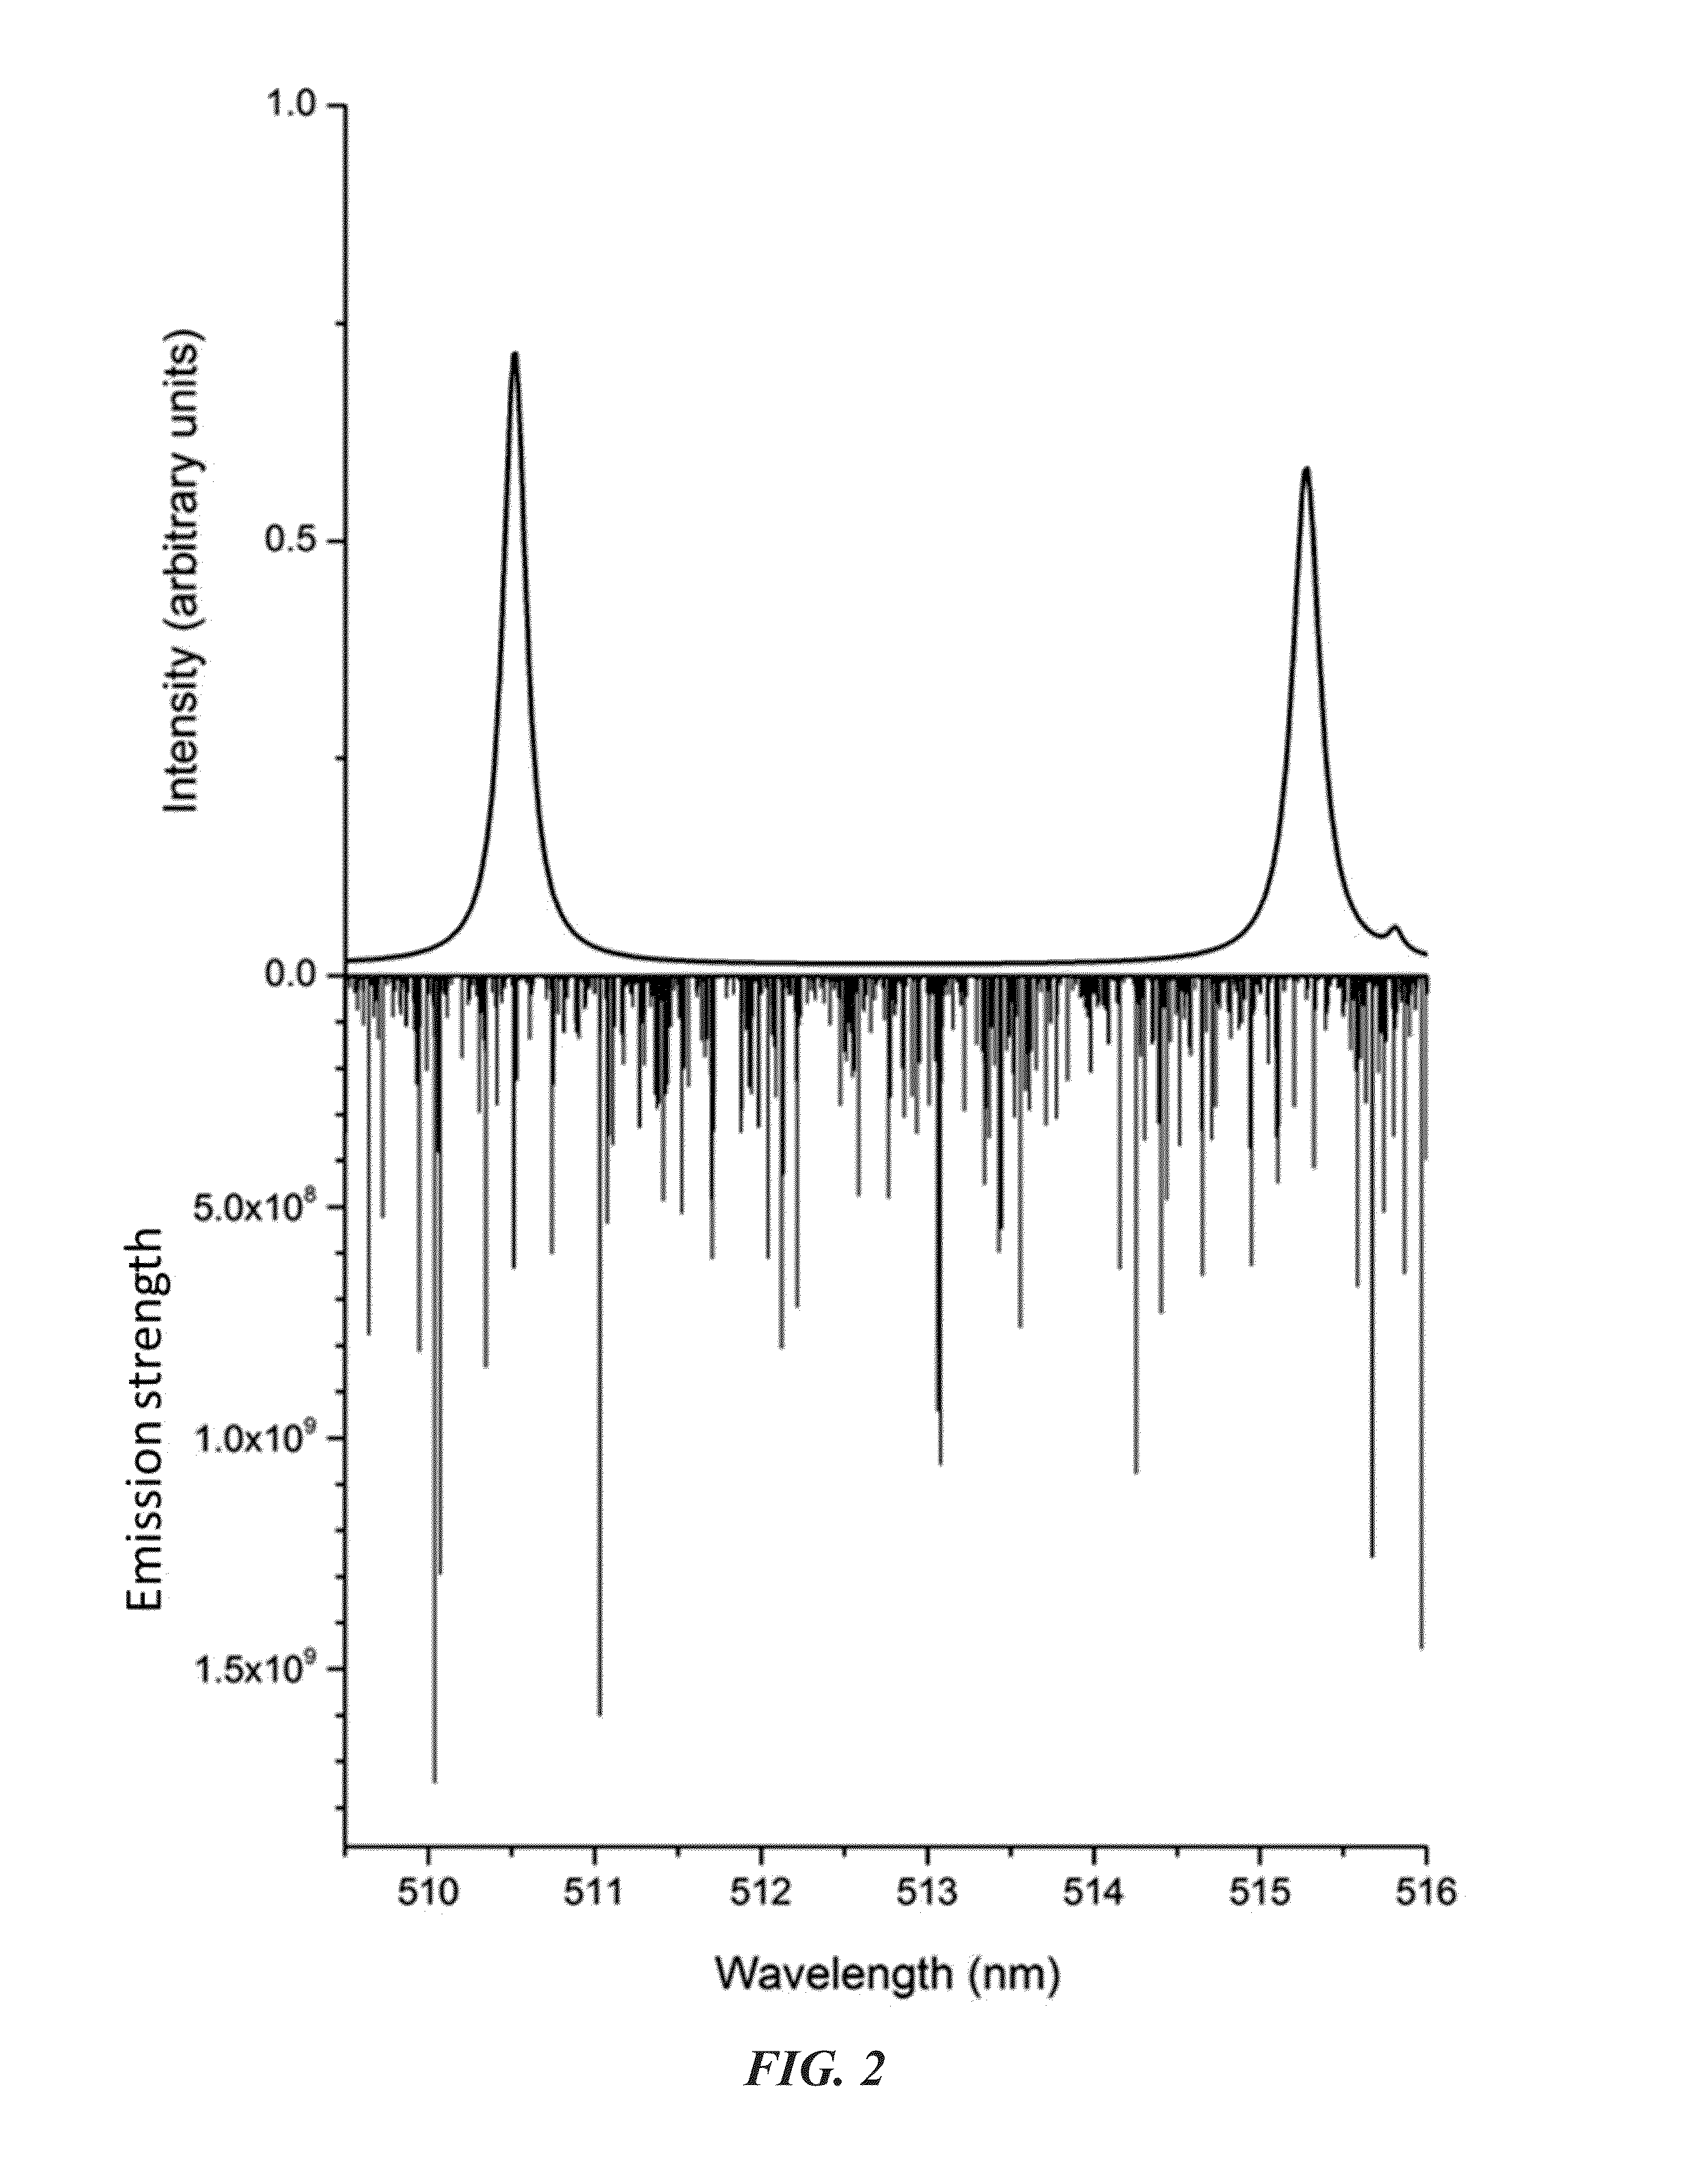
[0060]Upon receiving a spectrum (multimodal distribution over a list of emitters from a database), such as that seen in FIG. 2, individual distributions can be extracted by fitting spectral profiles (from the database) for each line (in the spectrum). The fitted spectral lines are background free, are noise free (in order to use the spectral lines later in determining level of confidence), have minimal to no overlaps (i.e., no effective amount of overlaps), and each have a line assignment. There is no assumption regarding the resolution of the spectrometers.

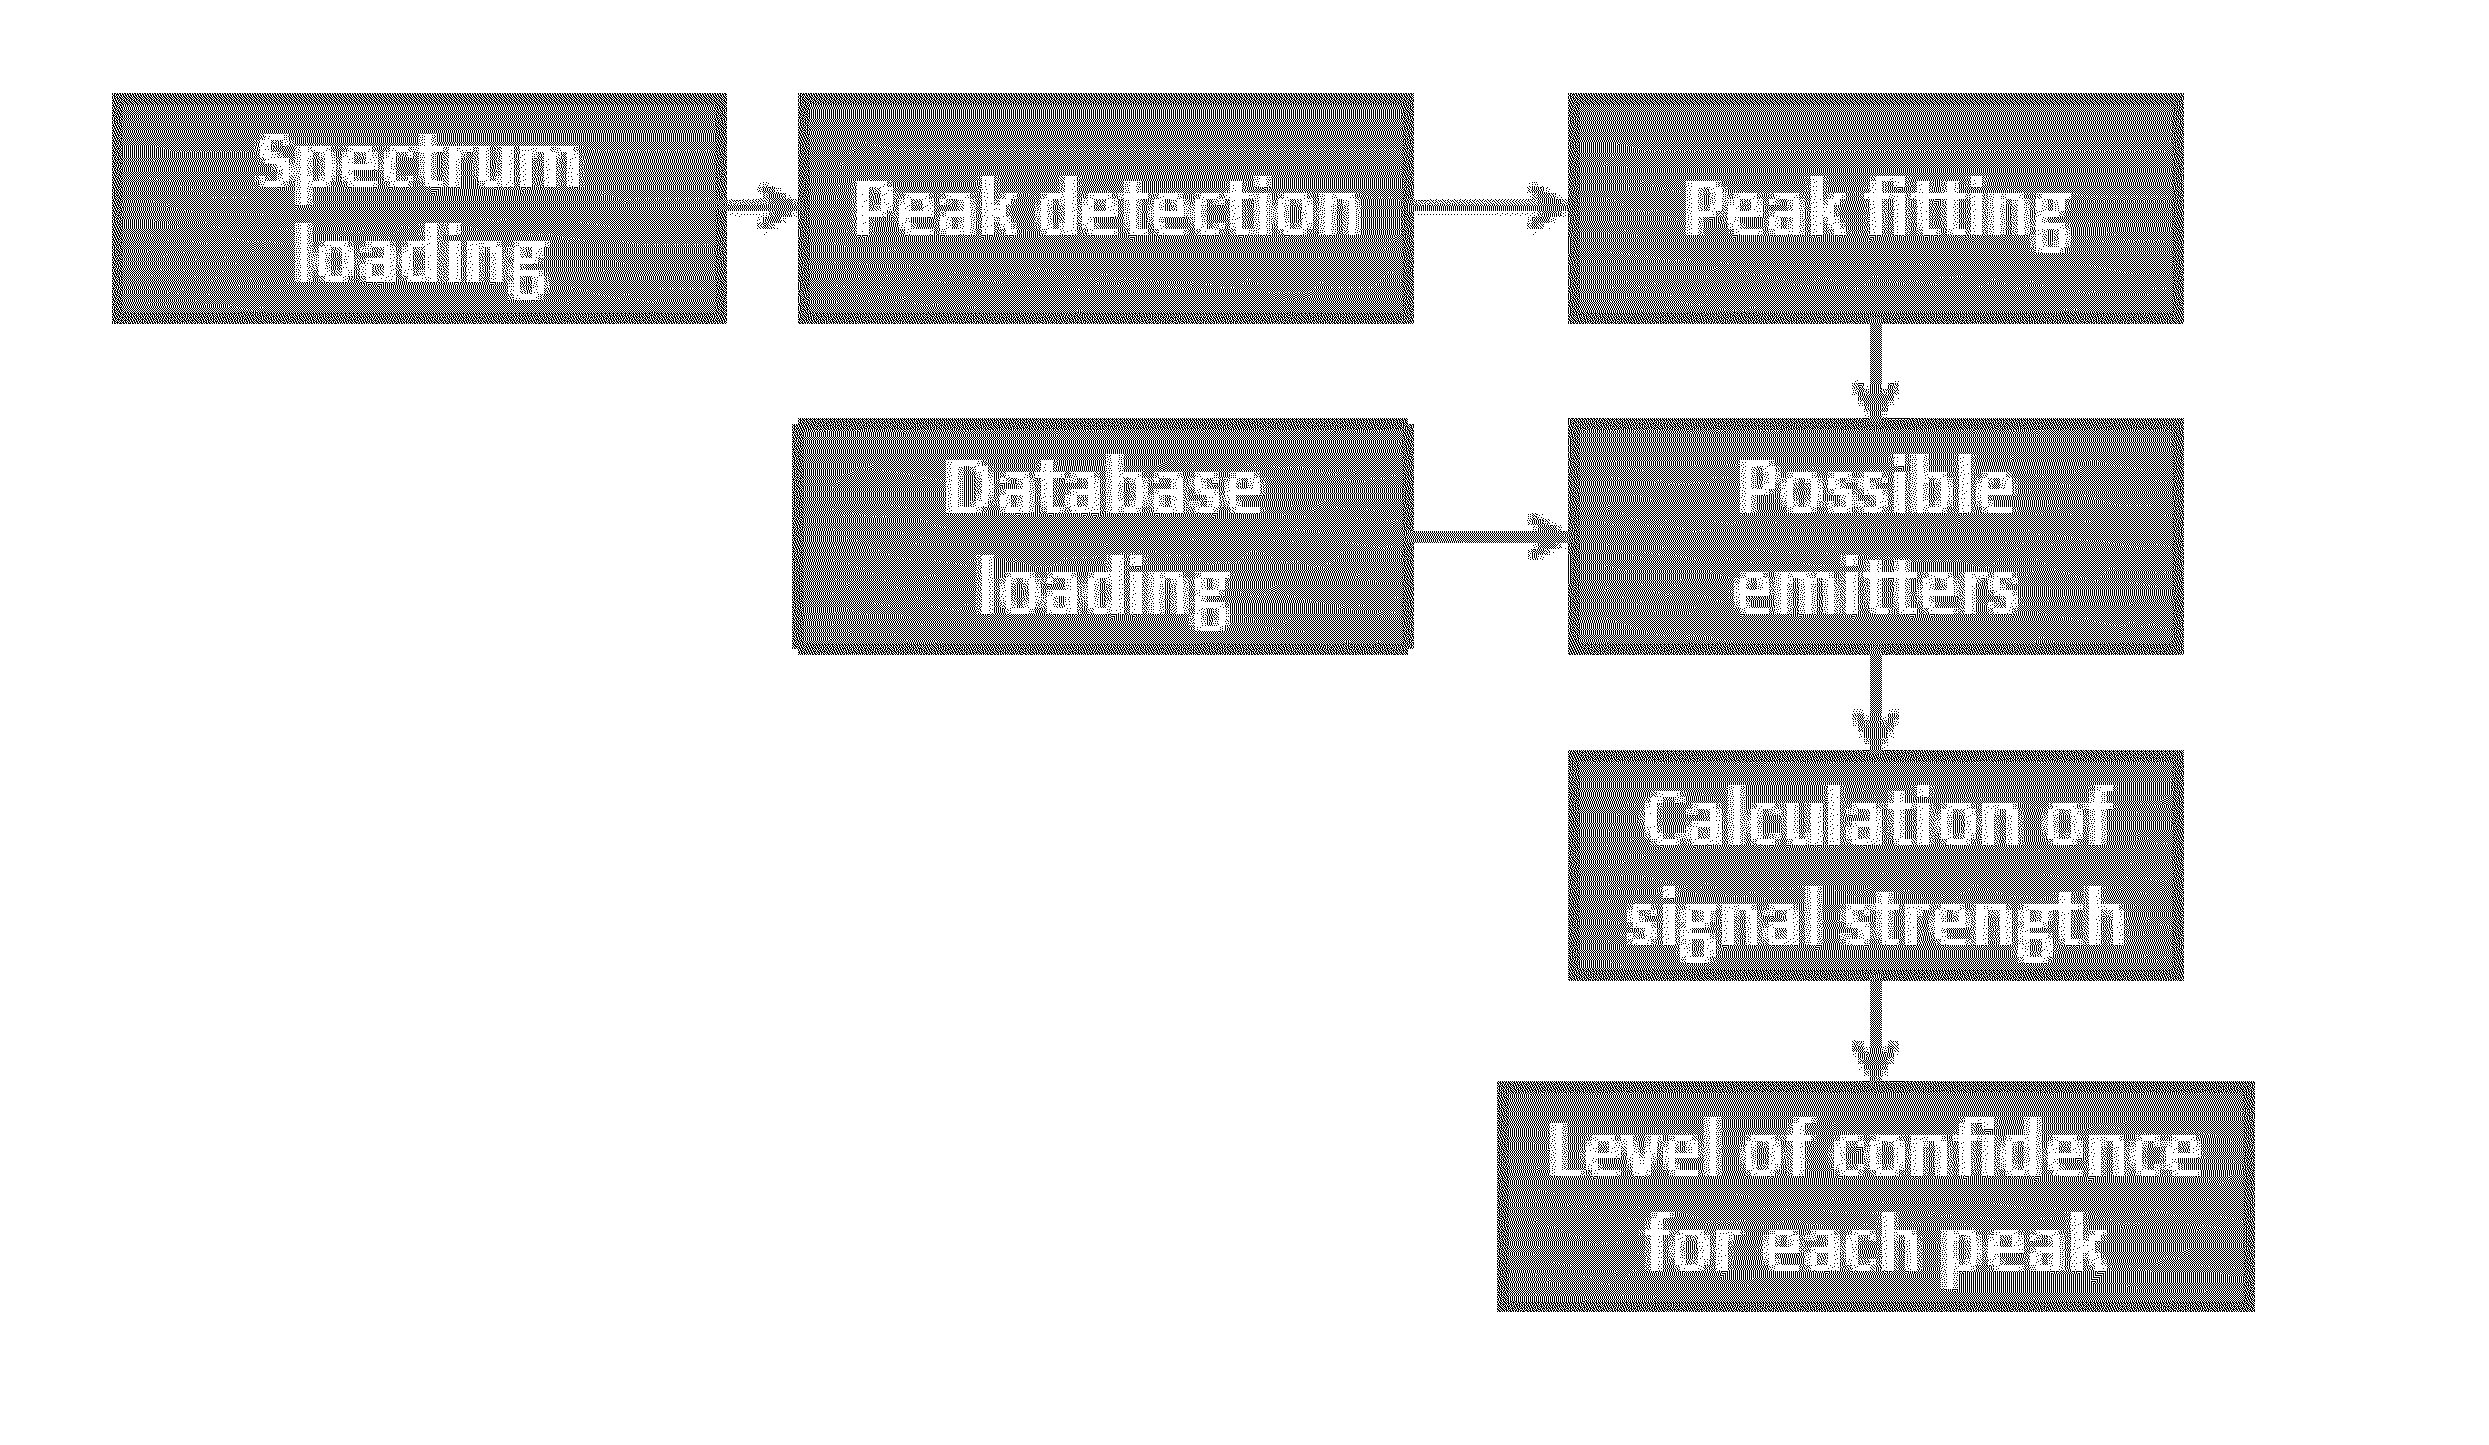
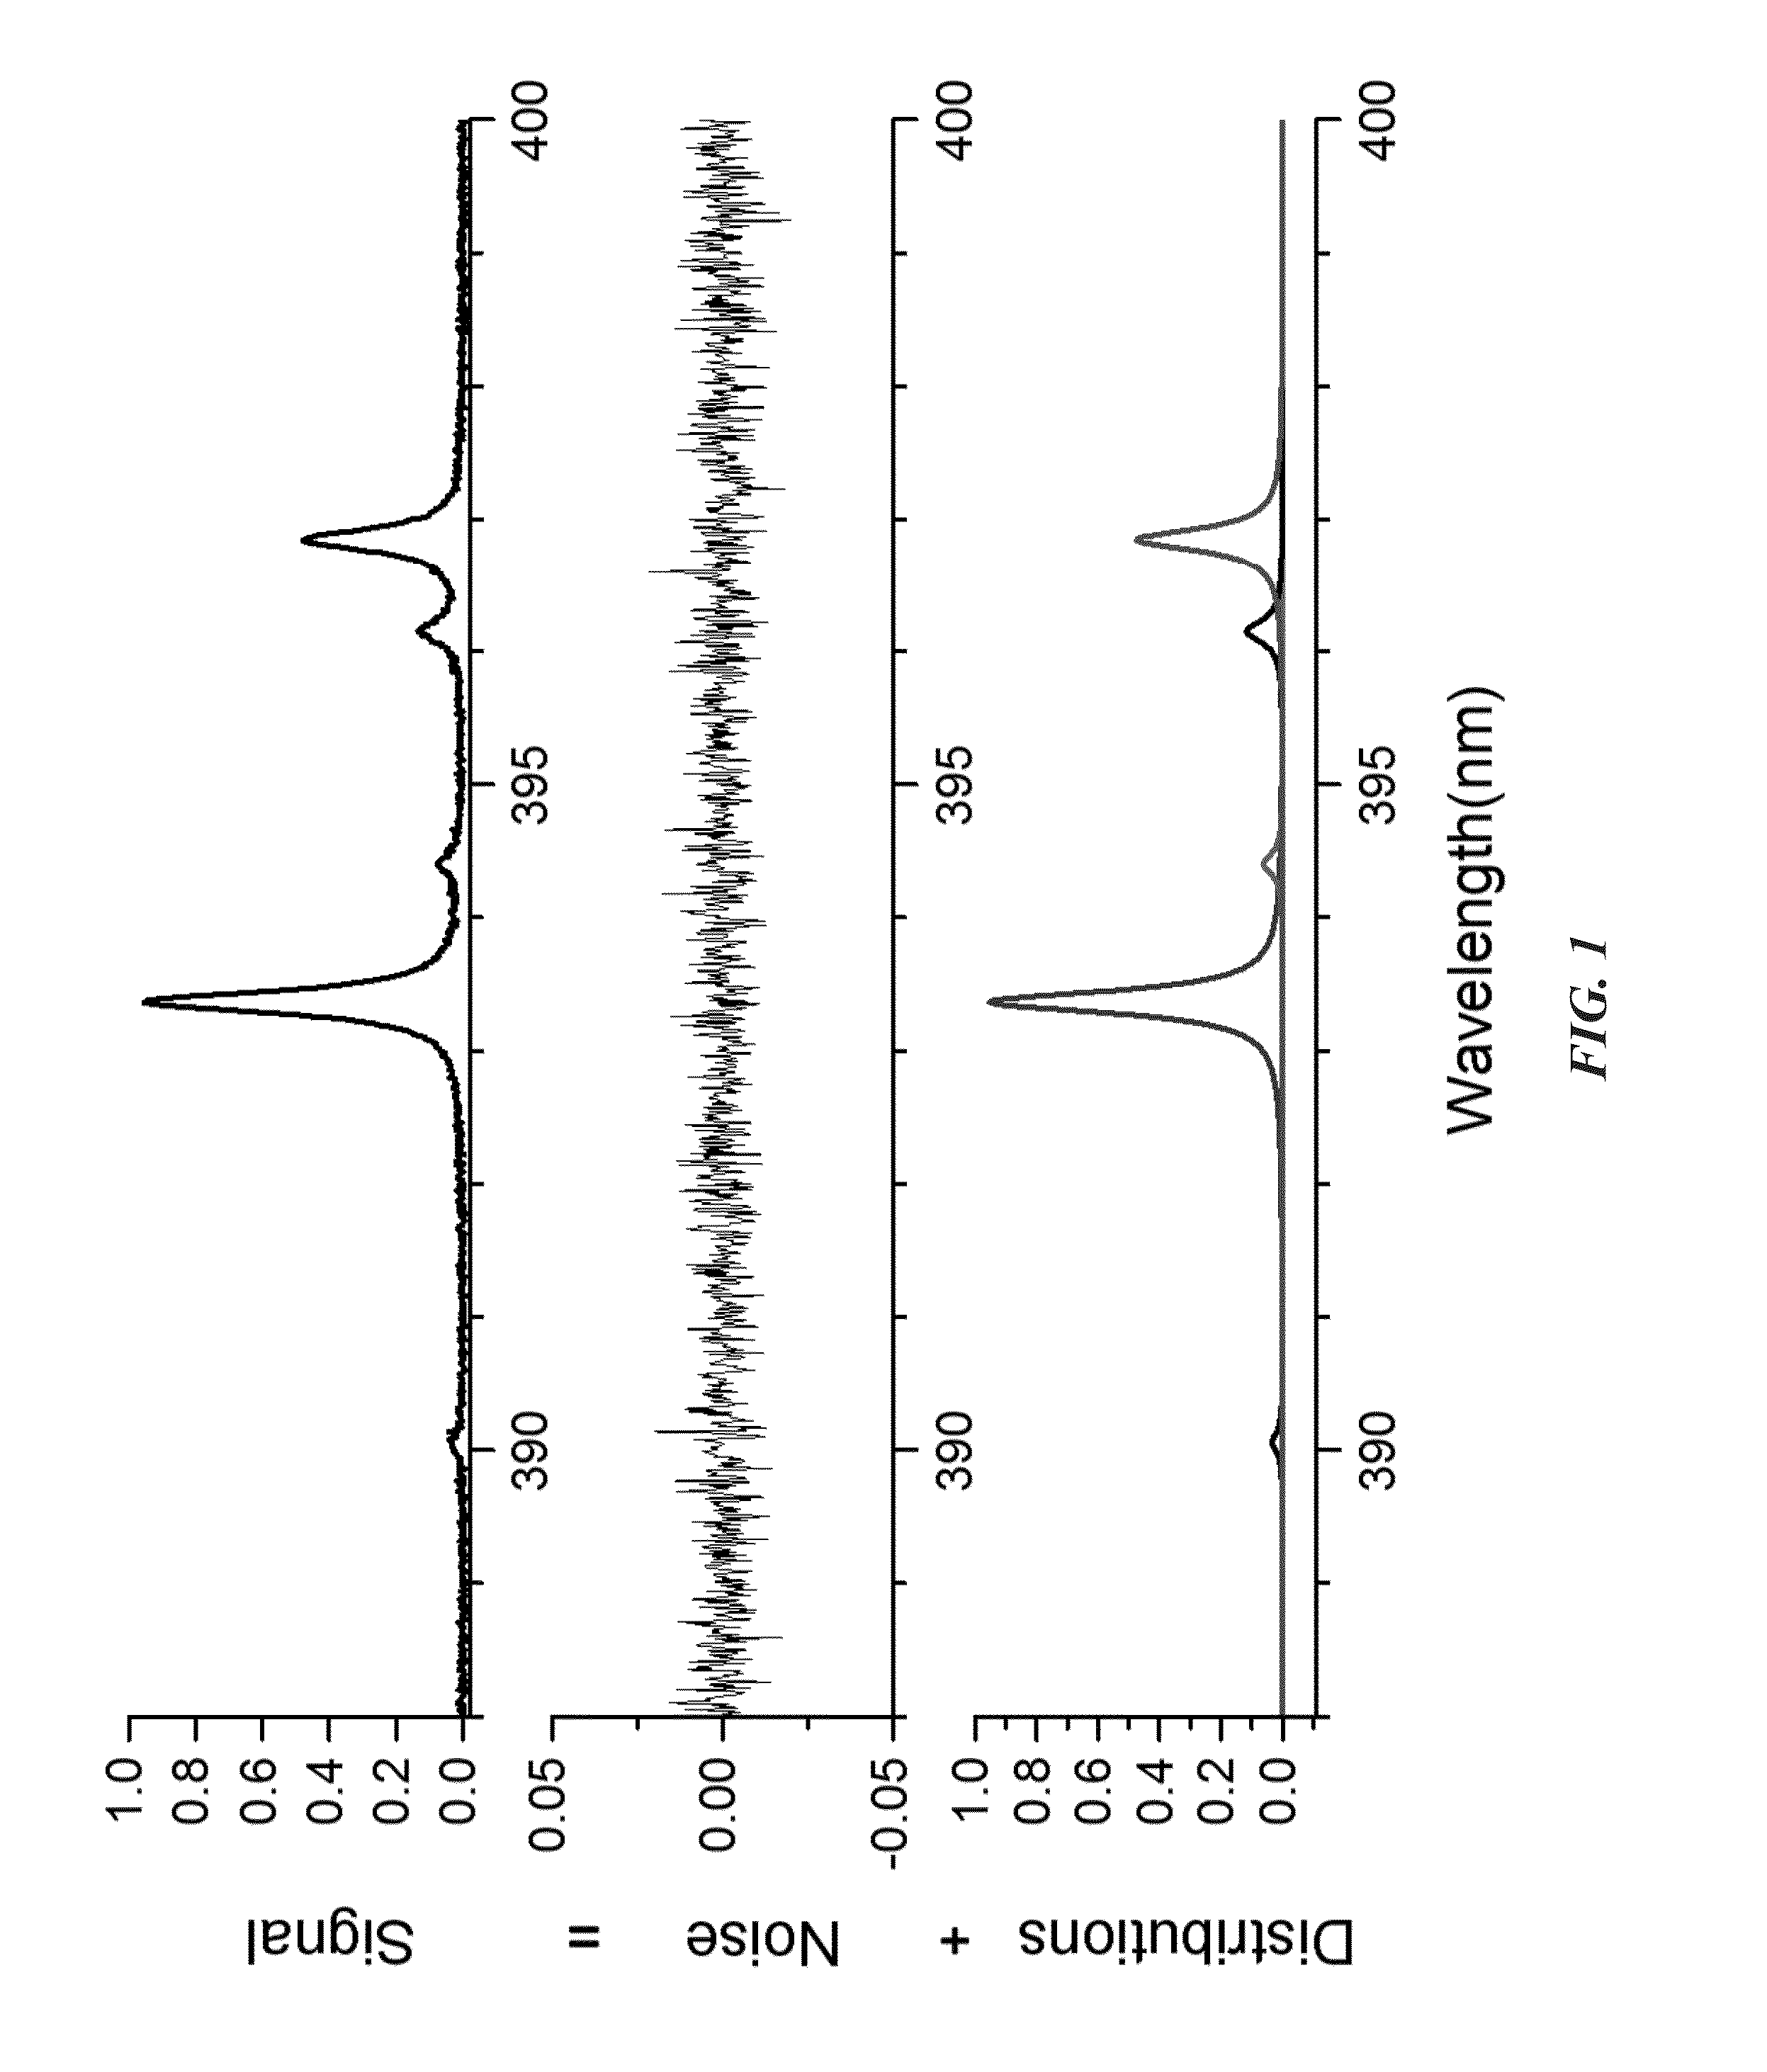
[0061]The process of extracting the distribution can be seen FIG. 1. In particular, the unprocessed spectrum includes a background that is corrected for, along with noise that is extracted, and also a probabilistic distribution. Thus, once the background is corrected and noise is extracted, the probabilistic distribution remains.

[0062]Each peak is attributed with a list of emitters, each of them having an emission strength, inter...


PUM


Abstract

The current invention considers the spectrum as a multimodal distribution over a list of structures containing the wavelength as the main entry and the other information mentioned above in the list as additional entries. Each line is then given a probability of contributing to the spectral line. In the case of multiple spectral lines, inference between spectral lines and their respective levels of confidence will provide a complete picture of the list of probable emitters with a probability factor for each line in order to provide a quantitative assignment of the spectral lines and profiling for a given spectrum.

Description

CROSS-REFERENCE TO RELATED APPLICATIONS[0001]This nonprovisional application is a continuation-in-part of and claims priority to U.S. Nonprovisional application Ser. No. 14 / 334,206, entitled “Quantitative Elemental Profiling in Optical Emission Spectroscopy”, filed Jul. 17, 2014, which is a continuation of and claims priority to provisional application No. 61 / 847,370, entitled “Quantitative Elemental Profiting in Optical Emission Spectroscopy”, filed Jul. 17, 2013, both of which are incorporated herein by reference in their entireties.FEDERALLY SPONSORED RESEARCH OR DEVELOPMENT[0002]This invention was made with Government support under Grant No. 2012DNBXK027 awarded by the National Institute of Justice. The government has certain rights in the invention.BACKGROUND OF THE INVENTION[0003]1. Field of the Invention[0004]This invention relates, generally, to spectral analysis. More specifically, it relates to the normalization of line assignments in spectral analysis to accurately determ...

Claims


Application Information

Patent Timeline
Patent Type & Authority Applications(United States)
IPC IPC(8): G01J3/28
CPCG01J2003/283G01J3/28G01N21/718G01N2021/3196
Inventor BAUDELET, MATTHIEU
Owner UNIV OF CENT FLORIDA RES FOUND INC
Why Eureka
Try Eureka