Endoscope objective lens and endoscope
- Summary
- Abstract
- Description
- Claims
- Application Information
AI Technical Summary
Benefits of technology
Problems solved by technology
Method used
Image
Examples
example 1
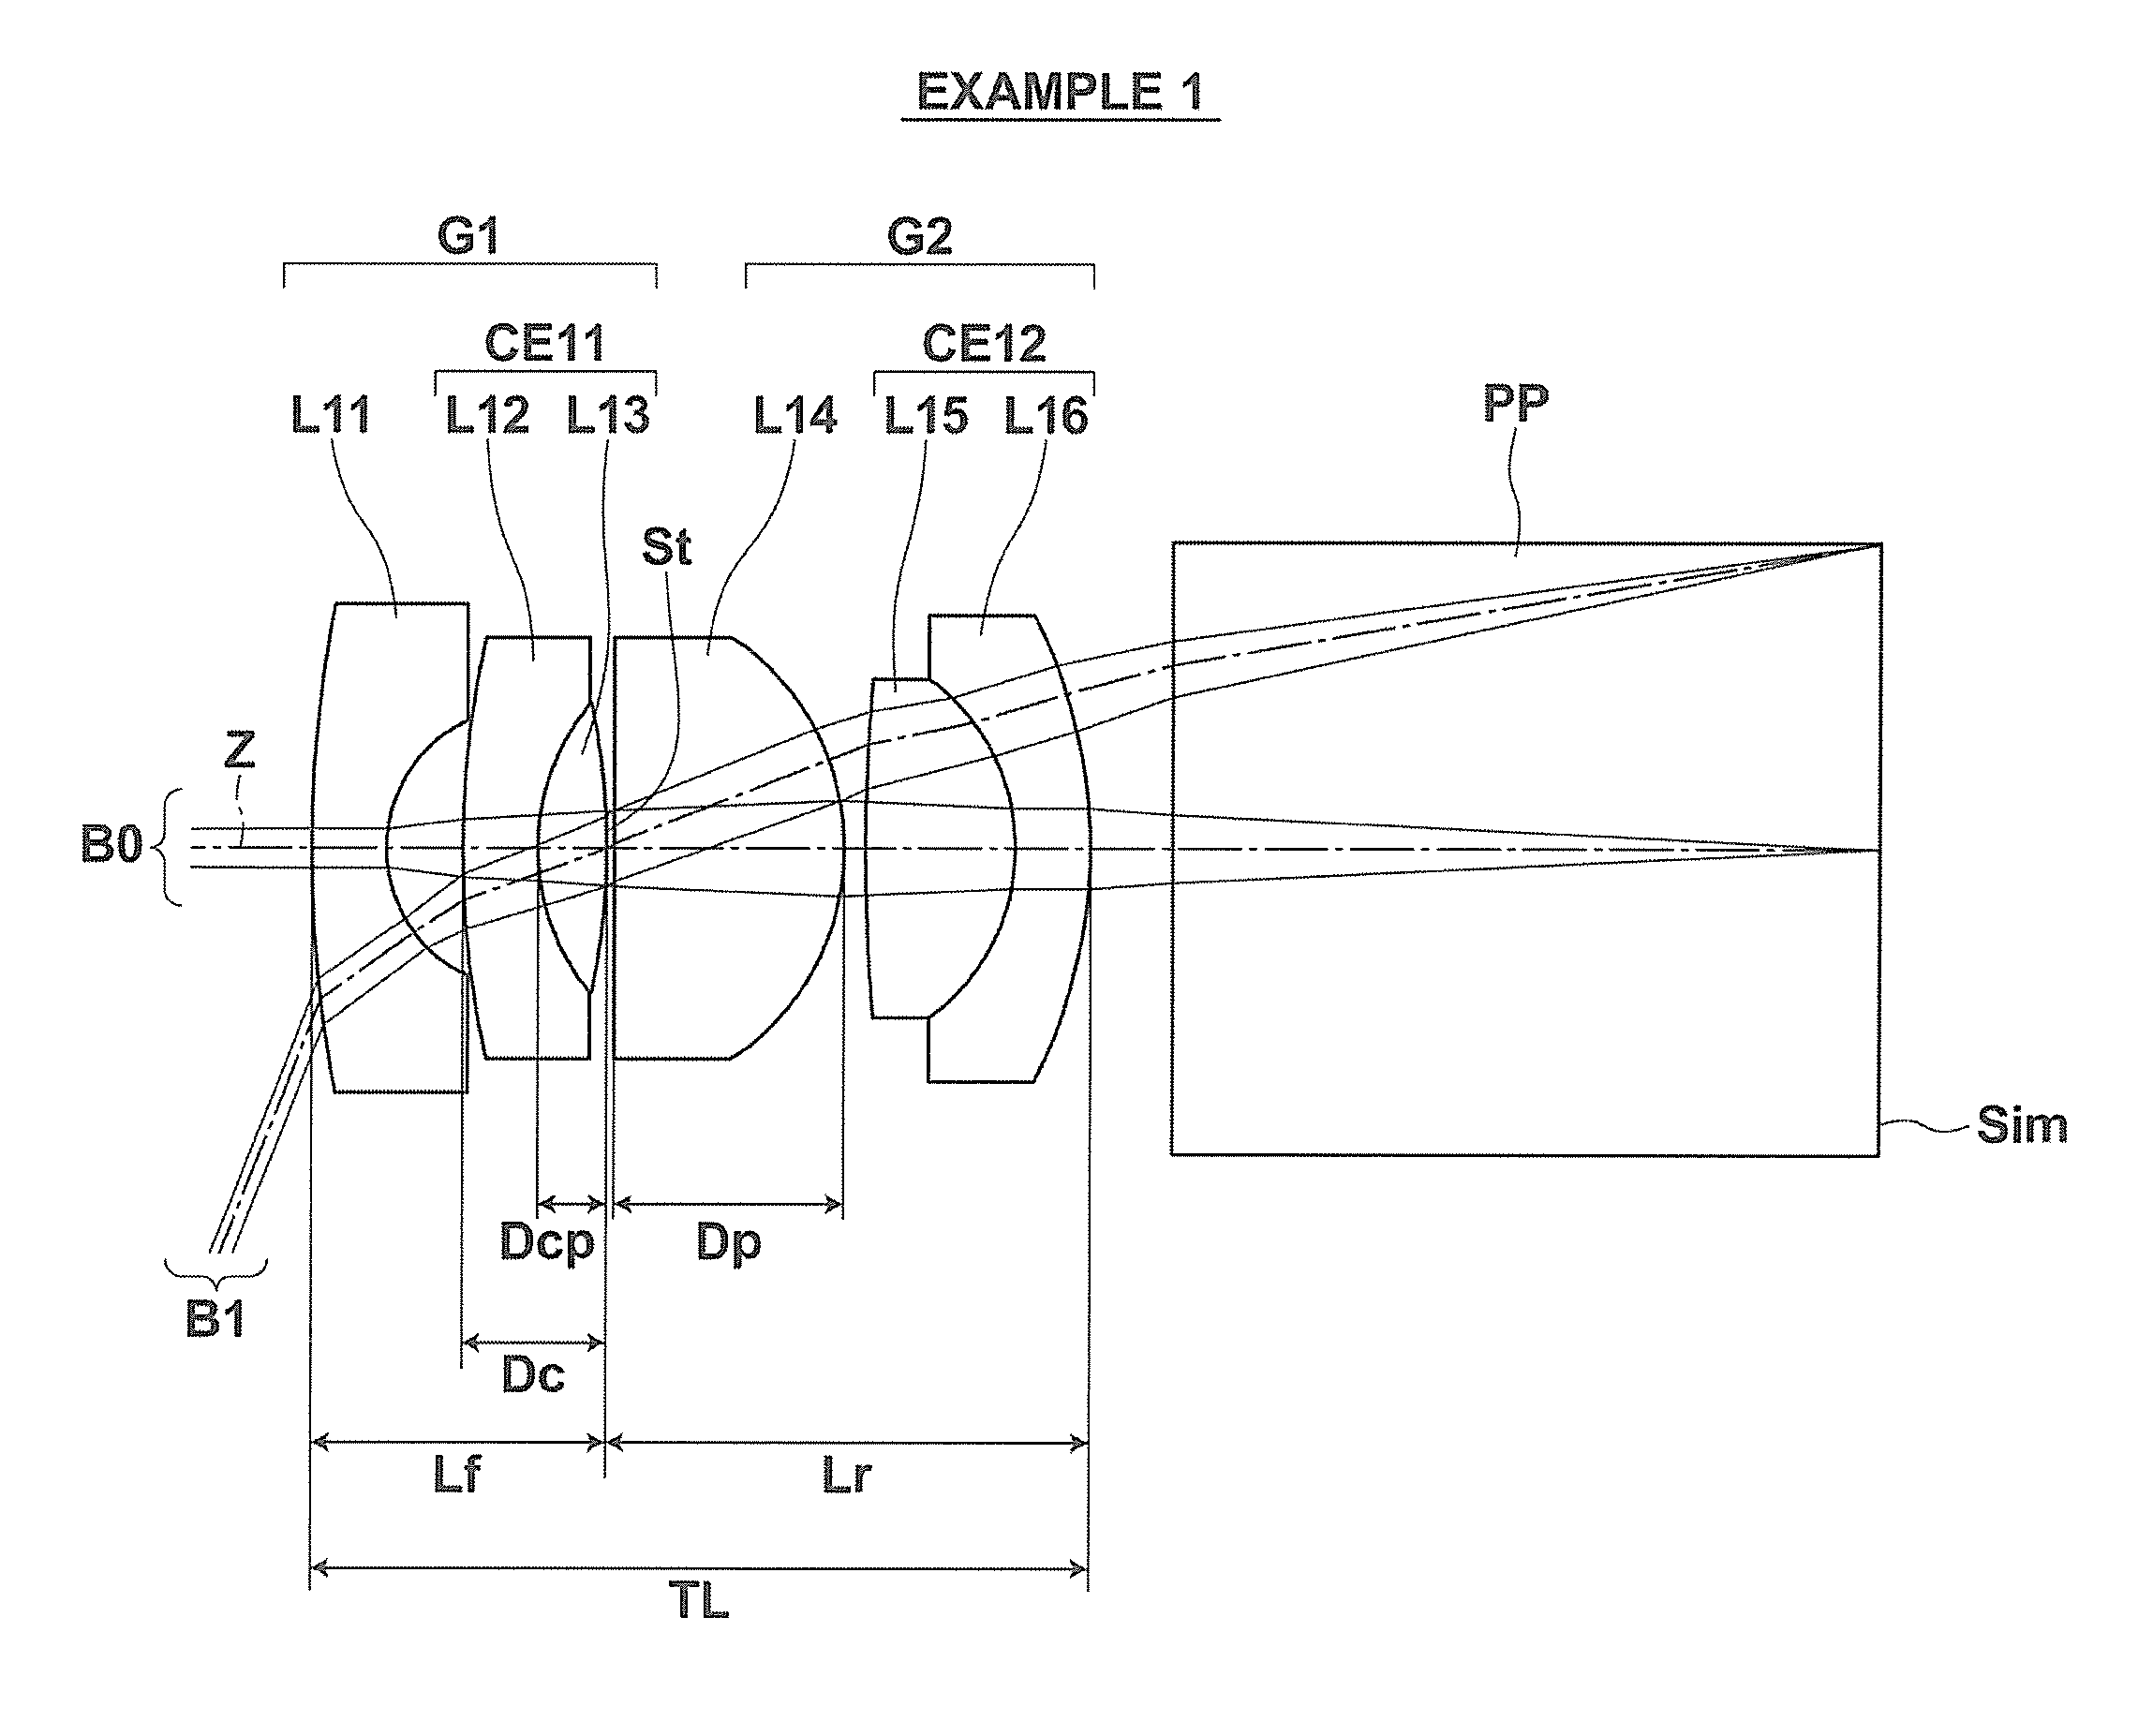
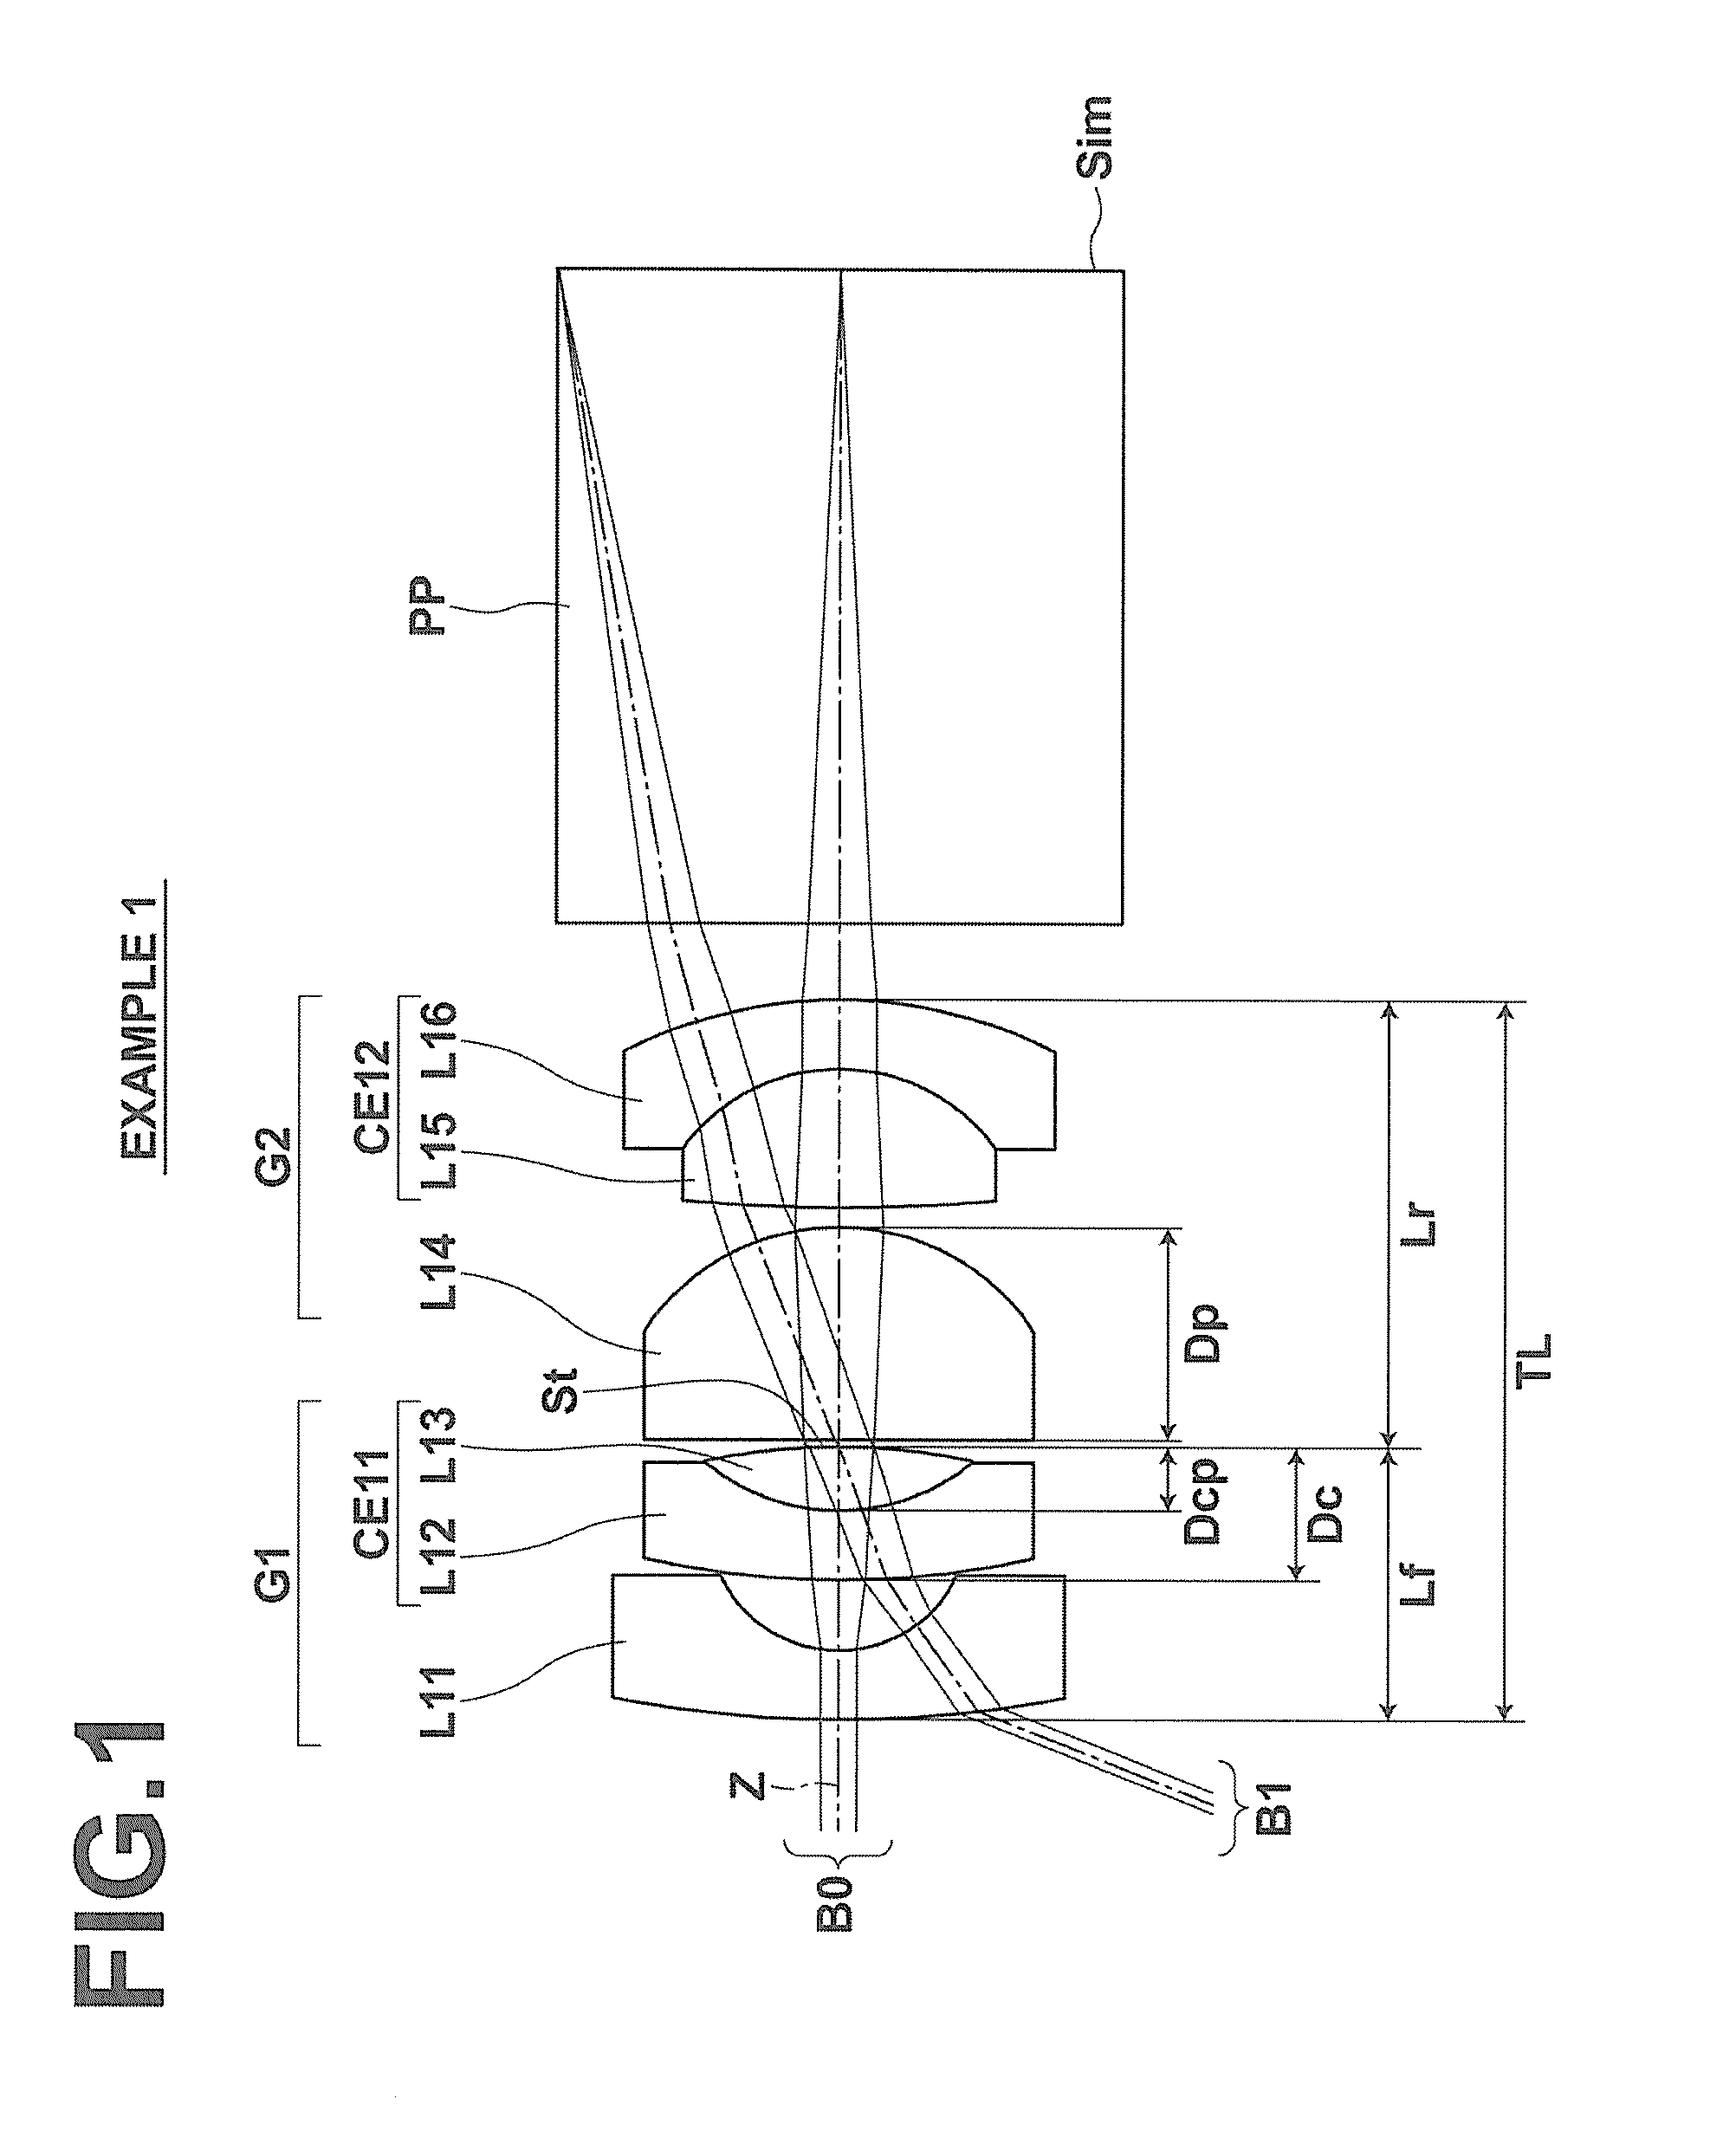
[0086]The lens configuration of and optical paths through an endoscope objective lens of Example 1 are as shown in FIG. 1, and the manner of illustration is as described above. Therefore the same explanations are not repeated here. Tables 1 and 2 show basic lens data and specifications of the endoscope objective lens of Example 1, respectively. In the table of basic lens data, each value in the column of “Si” represents the surface number of the i-th (i=1, 2, 3, . . . ) surface, where the object-side surface of the most object-side element is the 1st surface and the number is sequentially increased toward the image side; each value in the column of “Ri” represents the radius of curvature of the i-th surface; each value in the column of “Di” represents the surface distance between the i-th surface and the i+l-th surface along the optical axis Z; each value in the column of “Ndj” represents the refractive index with respect to the d-line (the wavelength of 587.56 nm) of the j-th (j=1,...
example 2
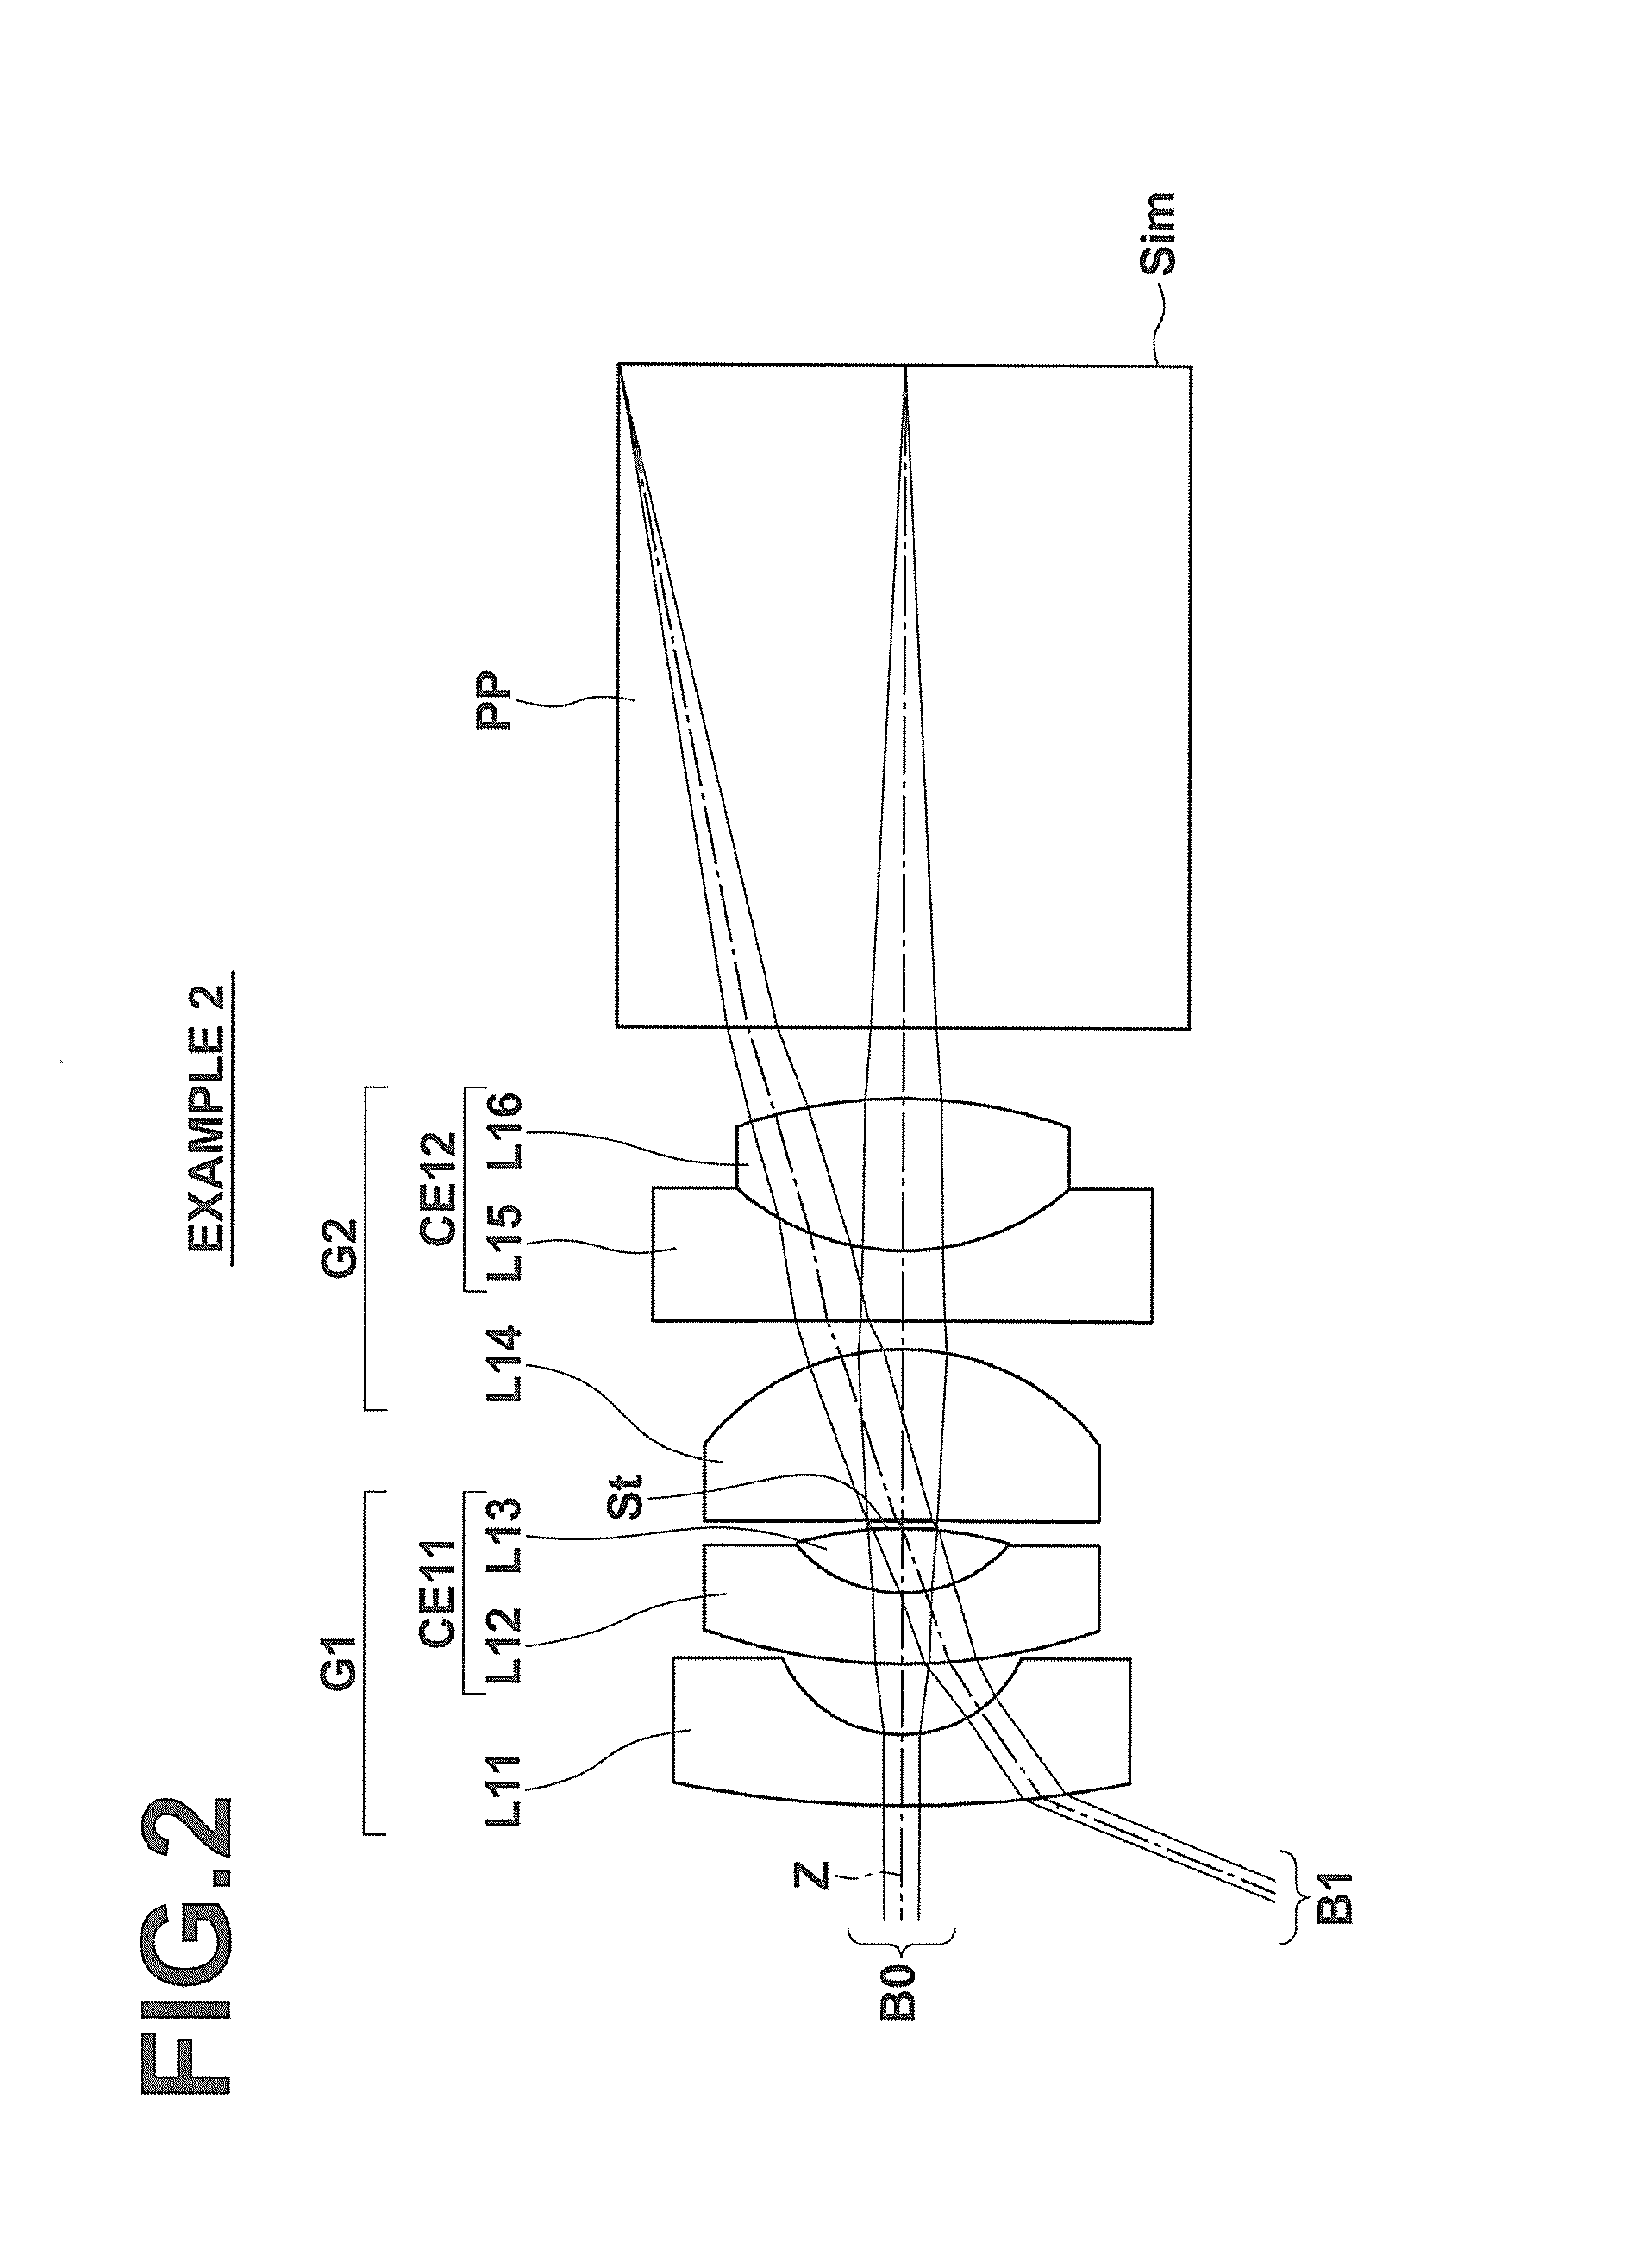
[0091]The lens configuration of the endoscope objective lens of Example 2 is shown in FIG. 2. Tables 3 and 4 show basic lens data and specifications of the endoscope objective lens of Example 2, respectively. FIG. 12 shows aberration diagrams of the endoscope objective lens of Example 2. The values of the basic lens data and the aberration diagrams of Example 2 are those when the object distance is 9.86.
TABLE 3Example 2 - Lens DataSiRiDiNdjνdj14.61140.28751.8830040.8020.51090.293132.29880.28751.9200136.0040.54760.26291.6882230.845−1.52340.00006(St)∞0.03697−3.80290.69821.8637524.968−0.97710.11639−158.04770.28751.9200119.00100.98380.61611.6849457.2511−1.93310.290912∞2.71071.5592053.9013∞0.0000
TABLE 4Example 2 - Specificationsf1.00Bf1.93FNo.6.702ω[°]134.6
example 3
[0092]The lens configuration of the endoscope objective lens of Example 3 is shown in FIG. 3. Tables 5 and 6 show basic lens data and specifications of the endoscope objective lens of Example 3, respectively. FIG. 13 shows aberration diagrams of the endoscope objective lens of Example 3. The values of the basic lens data and the aberration diagrams of Example 3 are those when the object distance is 9.60. In the basic lens data shown in Table 5, “*” is added to the surface number of each aspheric surface, and a numerical value of the paraxial radius of curvature is shown as the radius of curvature of each aspheric surface. Table 7 shows aspheric coefficients of each aspheric surface. In Table 7, the symbol “E-n” (where n is an integer) following the numerical value of each aspheric coefficient means “×10−n”. The aspheric coefficients are coefficients KA and Am (where m=3, 4, 5, . . . ) in the formula of aspheric surface shown below. The above-explained manner of description of the as...
PUM
 Abstract
Description
Claims
Application Information
 - R&D
- Intellectual Property
- Life Sciences
- Materials
- Tech Scout
- Unparalleled Data Quality
- Higher Quality Content
- 60% Fewer Hallucinations
Browse by: Latest US Patents, China's latest patents, Technical Efficacy Thesaurus, Application Domain, Technology Topic, Popular Technical Reports.
© 2025 PatSnap. All rights reserved.Legal|Privacy policy|Modern Slavery Act Transparency Statement|Sitemap|About US| Contact US: help@patsnap.com


