Air quality inference using multiple data sources

a data source and air quality technology, applied in probabilistic networks, instruments, computing models, etc., can solve the problems of many obstacles to setting up an adequate number of air quality monitor stations, high cost of building these stations, and high cost of building them. , to achieve the effect of saving monetary and energy

Inactive Publication Date: 2016-05-05
MICROSOFT TECH LICENSING LLC
View PDF3 Cites 43 Cited by
  • Summary
  • Abstract
  • Description
  • Claims
  • Application Information

AI Technical Summary

Benefits of technology

[0007]Accordingly, the techniques may provide air quality data, such as air quality indices for a particular pollutant, for multiple areas without the installation of additional air quality monitor stations in those areas. Such reduction or elimination of the necessity to build air quality stations may provide monetary and energy savings. Further, the techniques may be used to determine areas at which future air quality monitor stations are to be established, such as in areas which the techniques predict worse than expected air quality.

Problems solved by technology

For example, industrial and commercial areas tend to generate more air pollution than residential areas.
Thus, monitoring air quality in an urban environment may require a large number of air quality monitor stations that are distributed throughout the urban environment.
However, there are many obstacles to setting up an adequate number of air quality monitor stations.
One obstacle is the cost of building these stations, as well as the cost of permanently staffing and maintaining these air quality monitor stations.
Another obstacle is the limited availability of land in an urban environment for the construction of such air quality monitor stations.
For example, acquiring land for the construction of air quality monitor stations may be prohibitively expensive or infeasible due to the existing use of the land.
An additional obstacle may be the amount of environmental cost associated with the operation of the air quality monitor stations.
While the energy consumption of a single air quality monitor station may be small, operating a network of air quality monitor stations may consume a relatively large quantity of energy, and thus may contribute to the very pollution that degrades air quality.

Method used


Image

  • Air quality inference using multiple data sources
  • Air quality inference using multiple data sources
  • Air quality inference using multiple data sources

Examples


example scheme

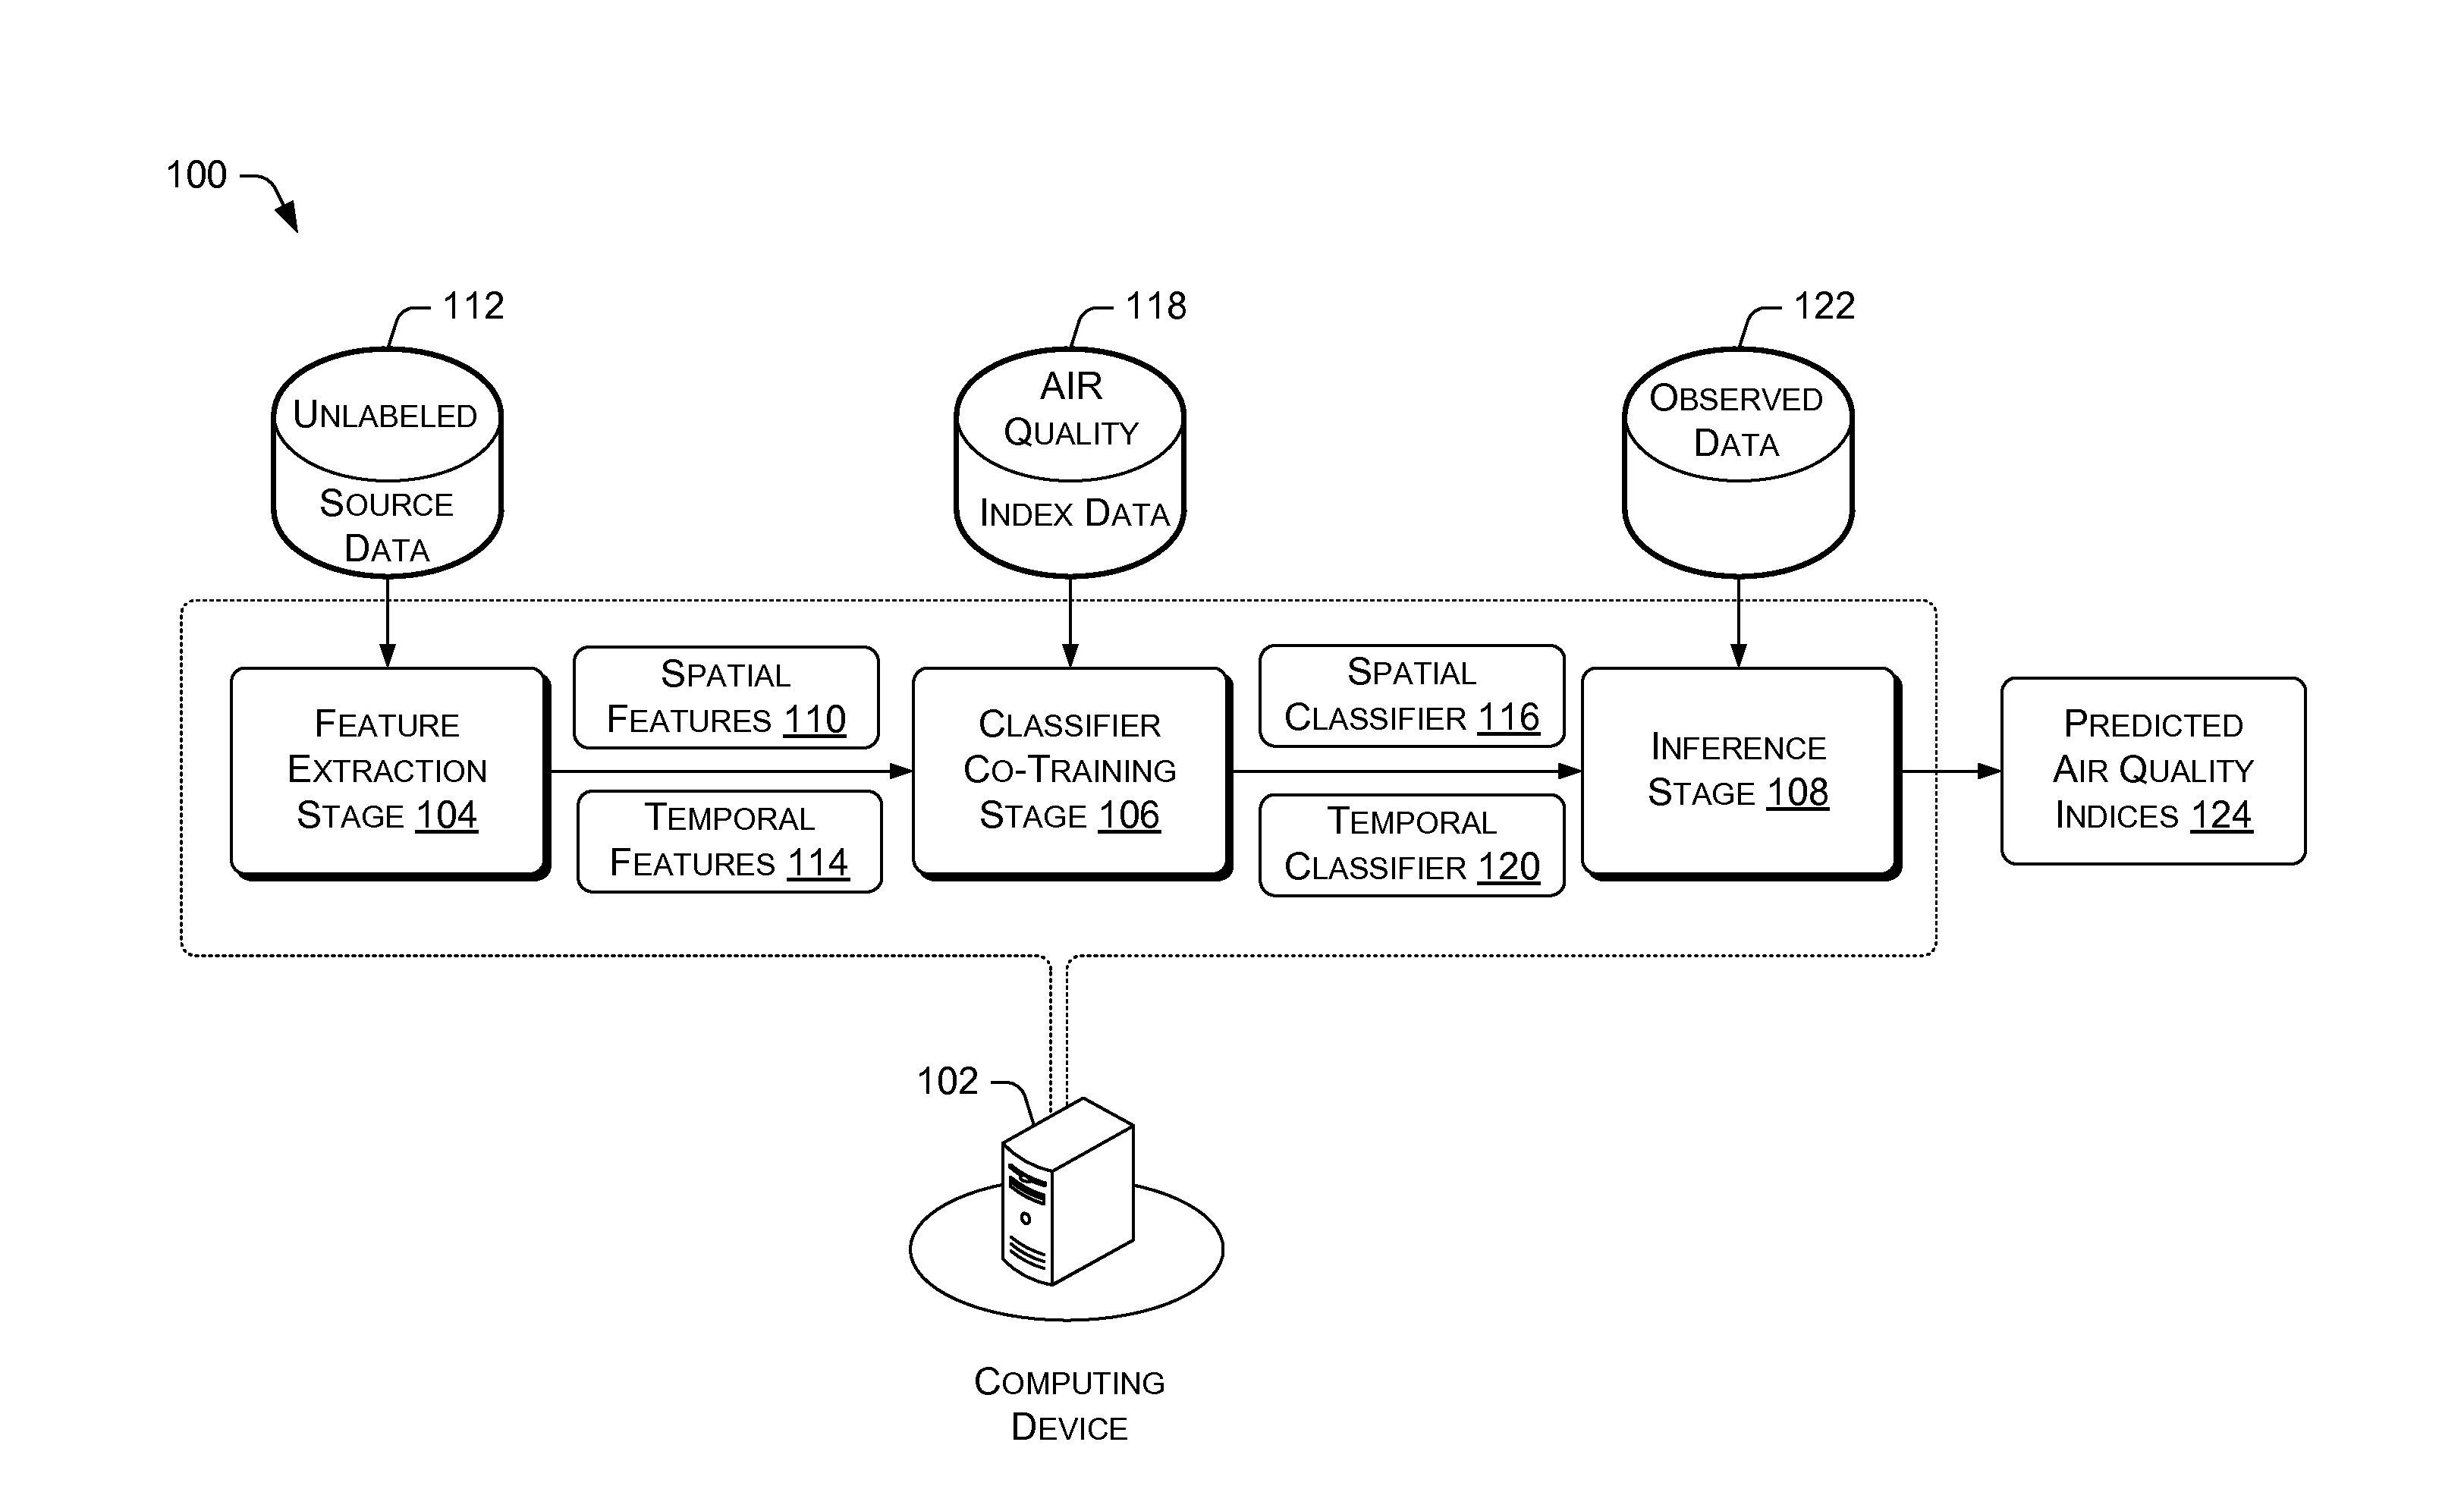
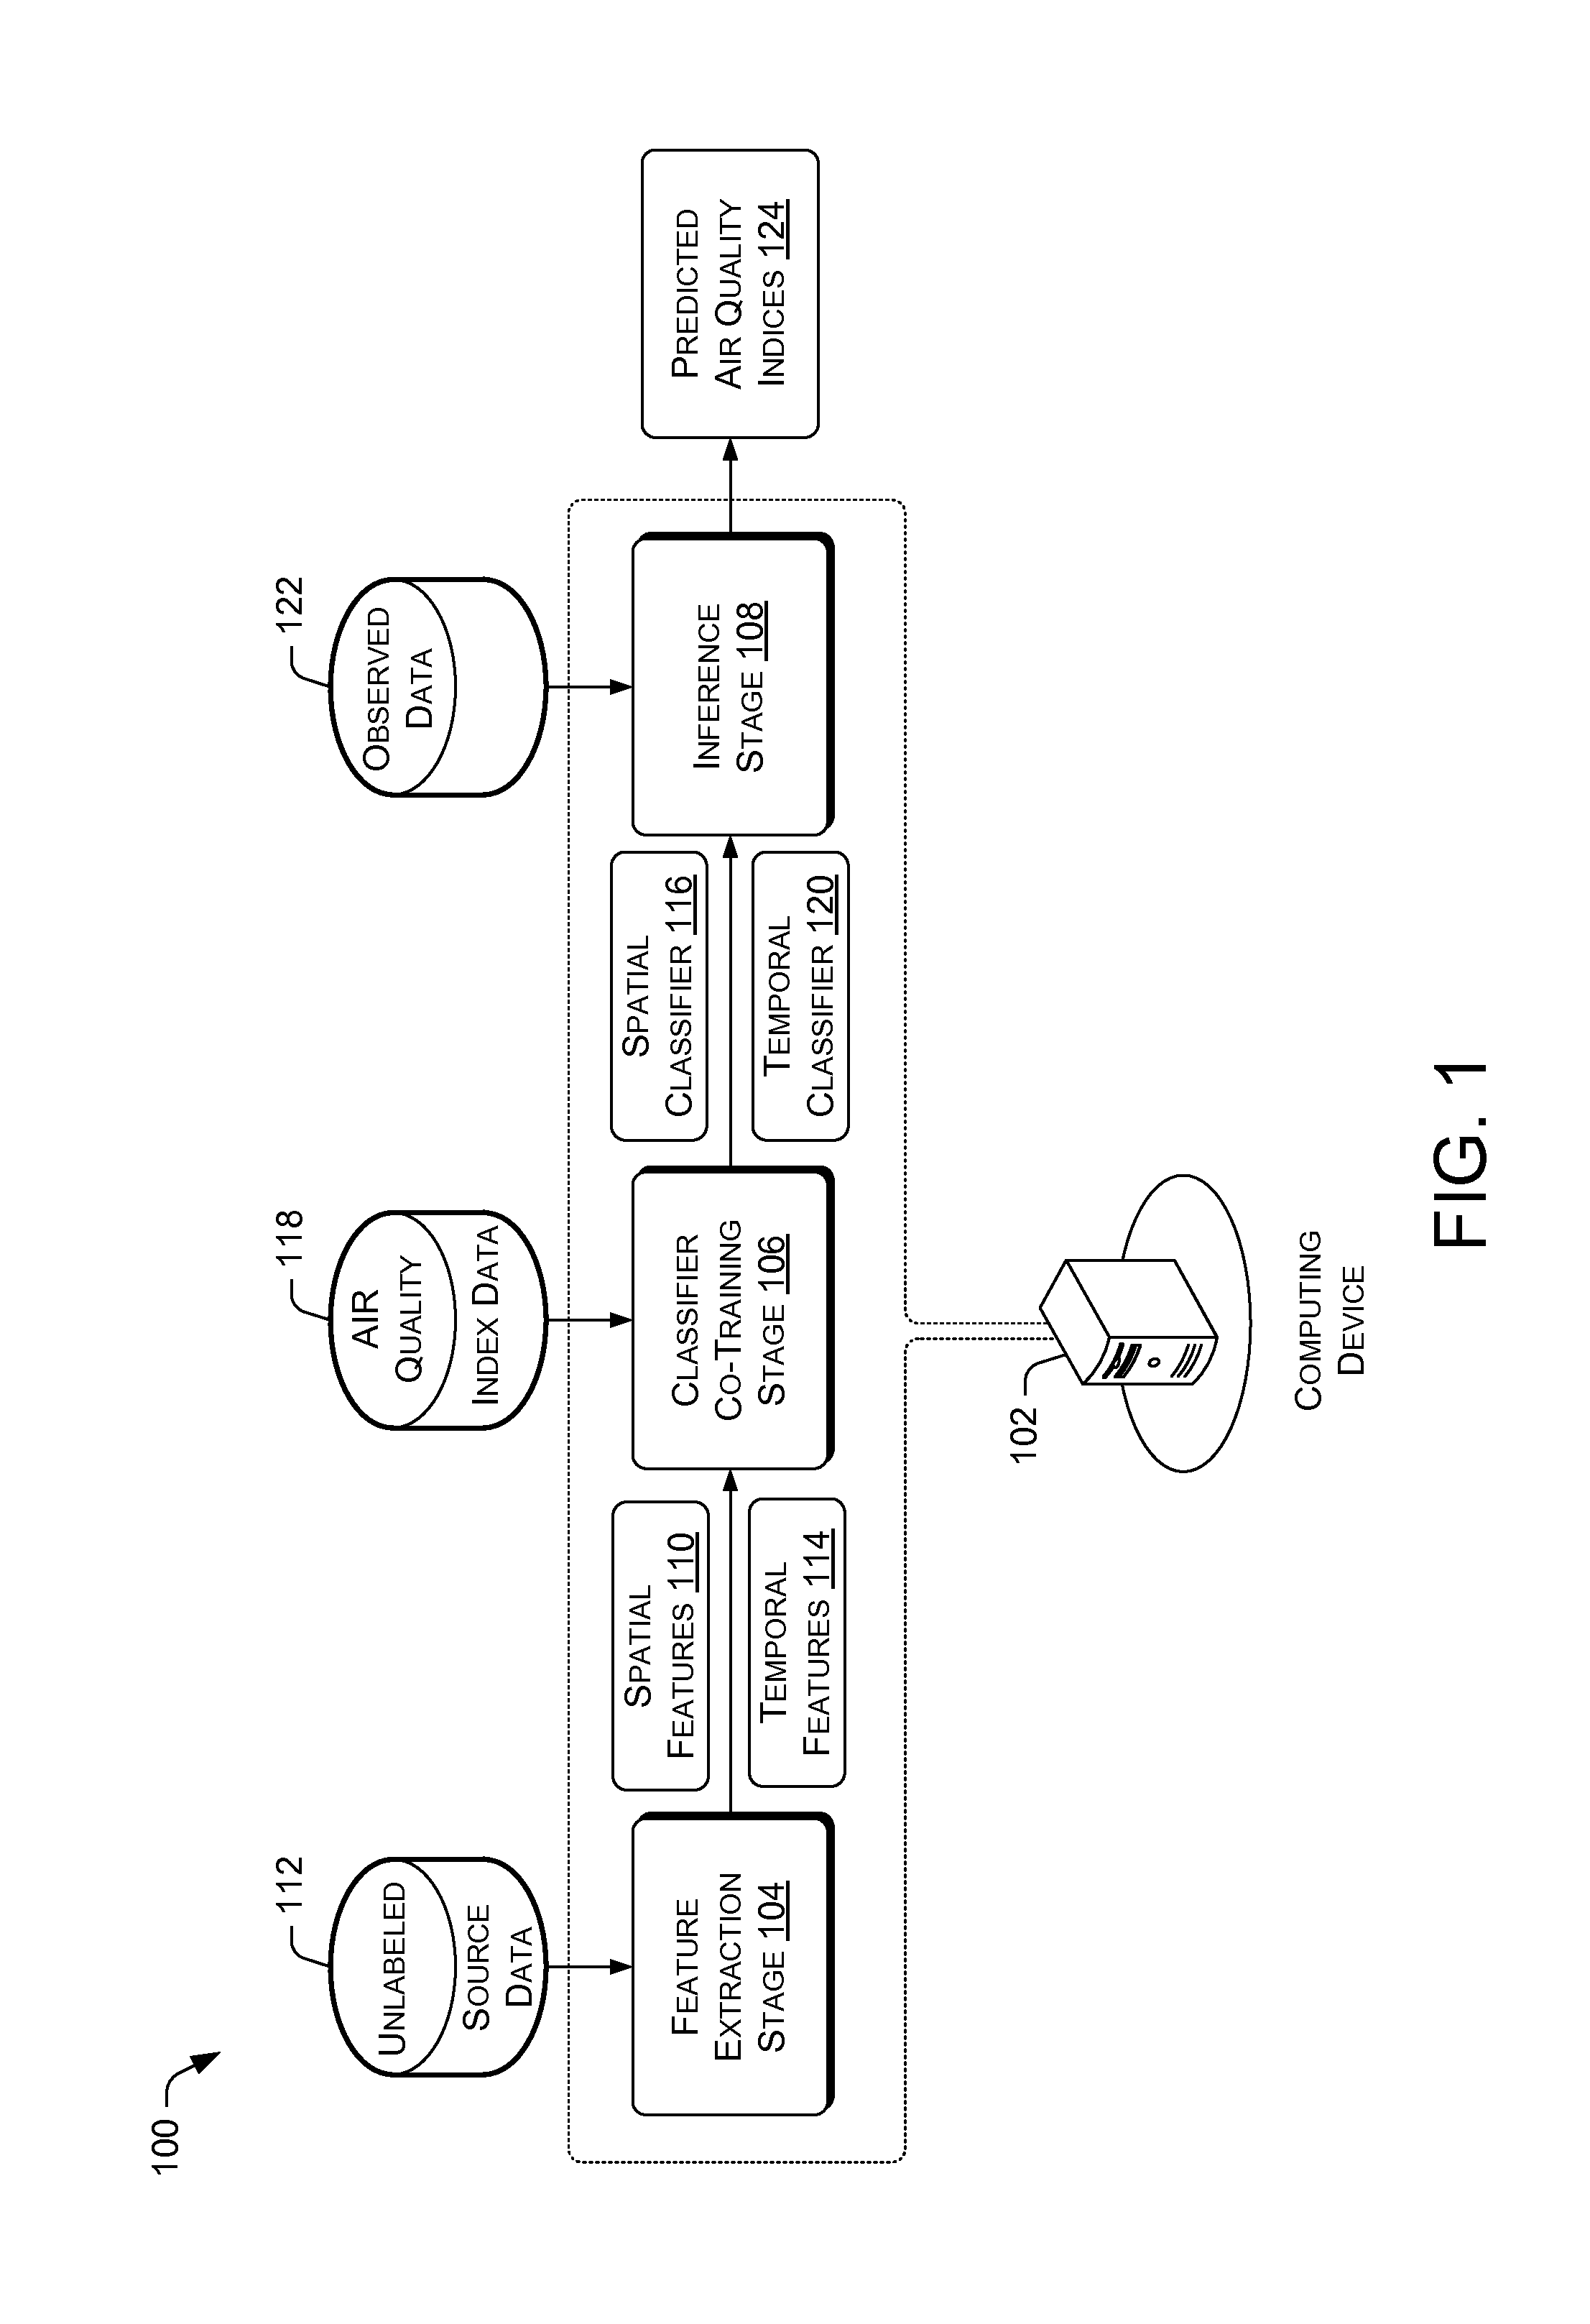
[0020]FIG. 1 is a block diagram that illustrates an example scheme 100 for using spatial and temporal classifiers to infer air quality indices (AQIs) for multiple areas in a region based on multiple sources of data. The multiple areas for which AQIs are inferred may lack air quality monitor stations. Further, a corresponding AQI may be inferred for each of multiple pollutants that can be present in a particular area. For example, a first AQI may be inferred for the pollutant SO2 in an area, while a second AQI may be inferred for the pollutant NO2 in the same area. The example scheme 100 may be implemented by a computing device 102. The computing device 102 may be a general purpose computer, such as a desktop computer, a tablet computer, a laptop computer, one or more servers, and so forth.

[0021]The example scheme 100 may include a feature extraction stage 104, a classifier co-training stage 106, and an inference stage 108. During feature extraction stage 104, spatial features 110 ma...

example components

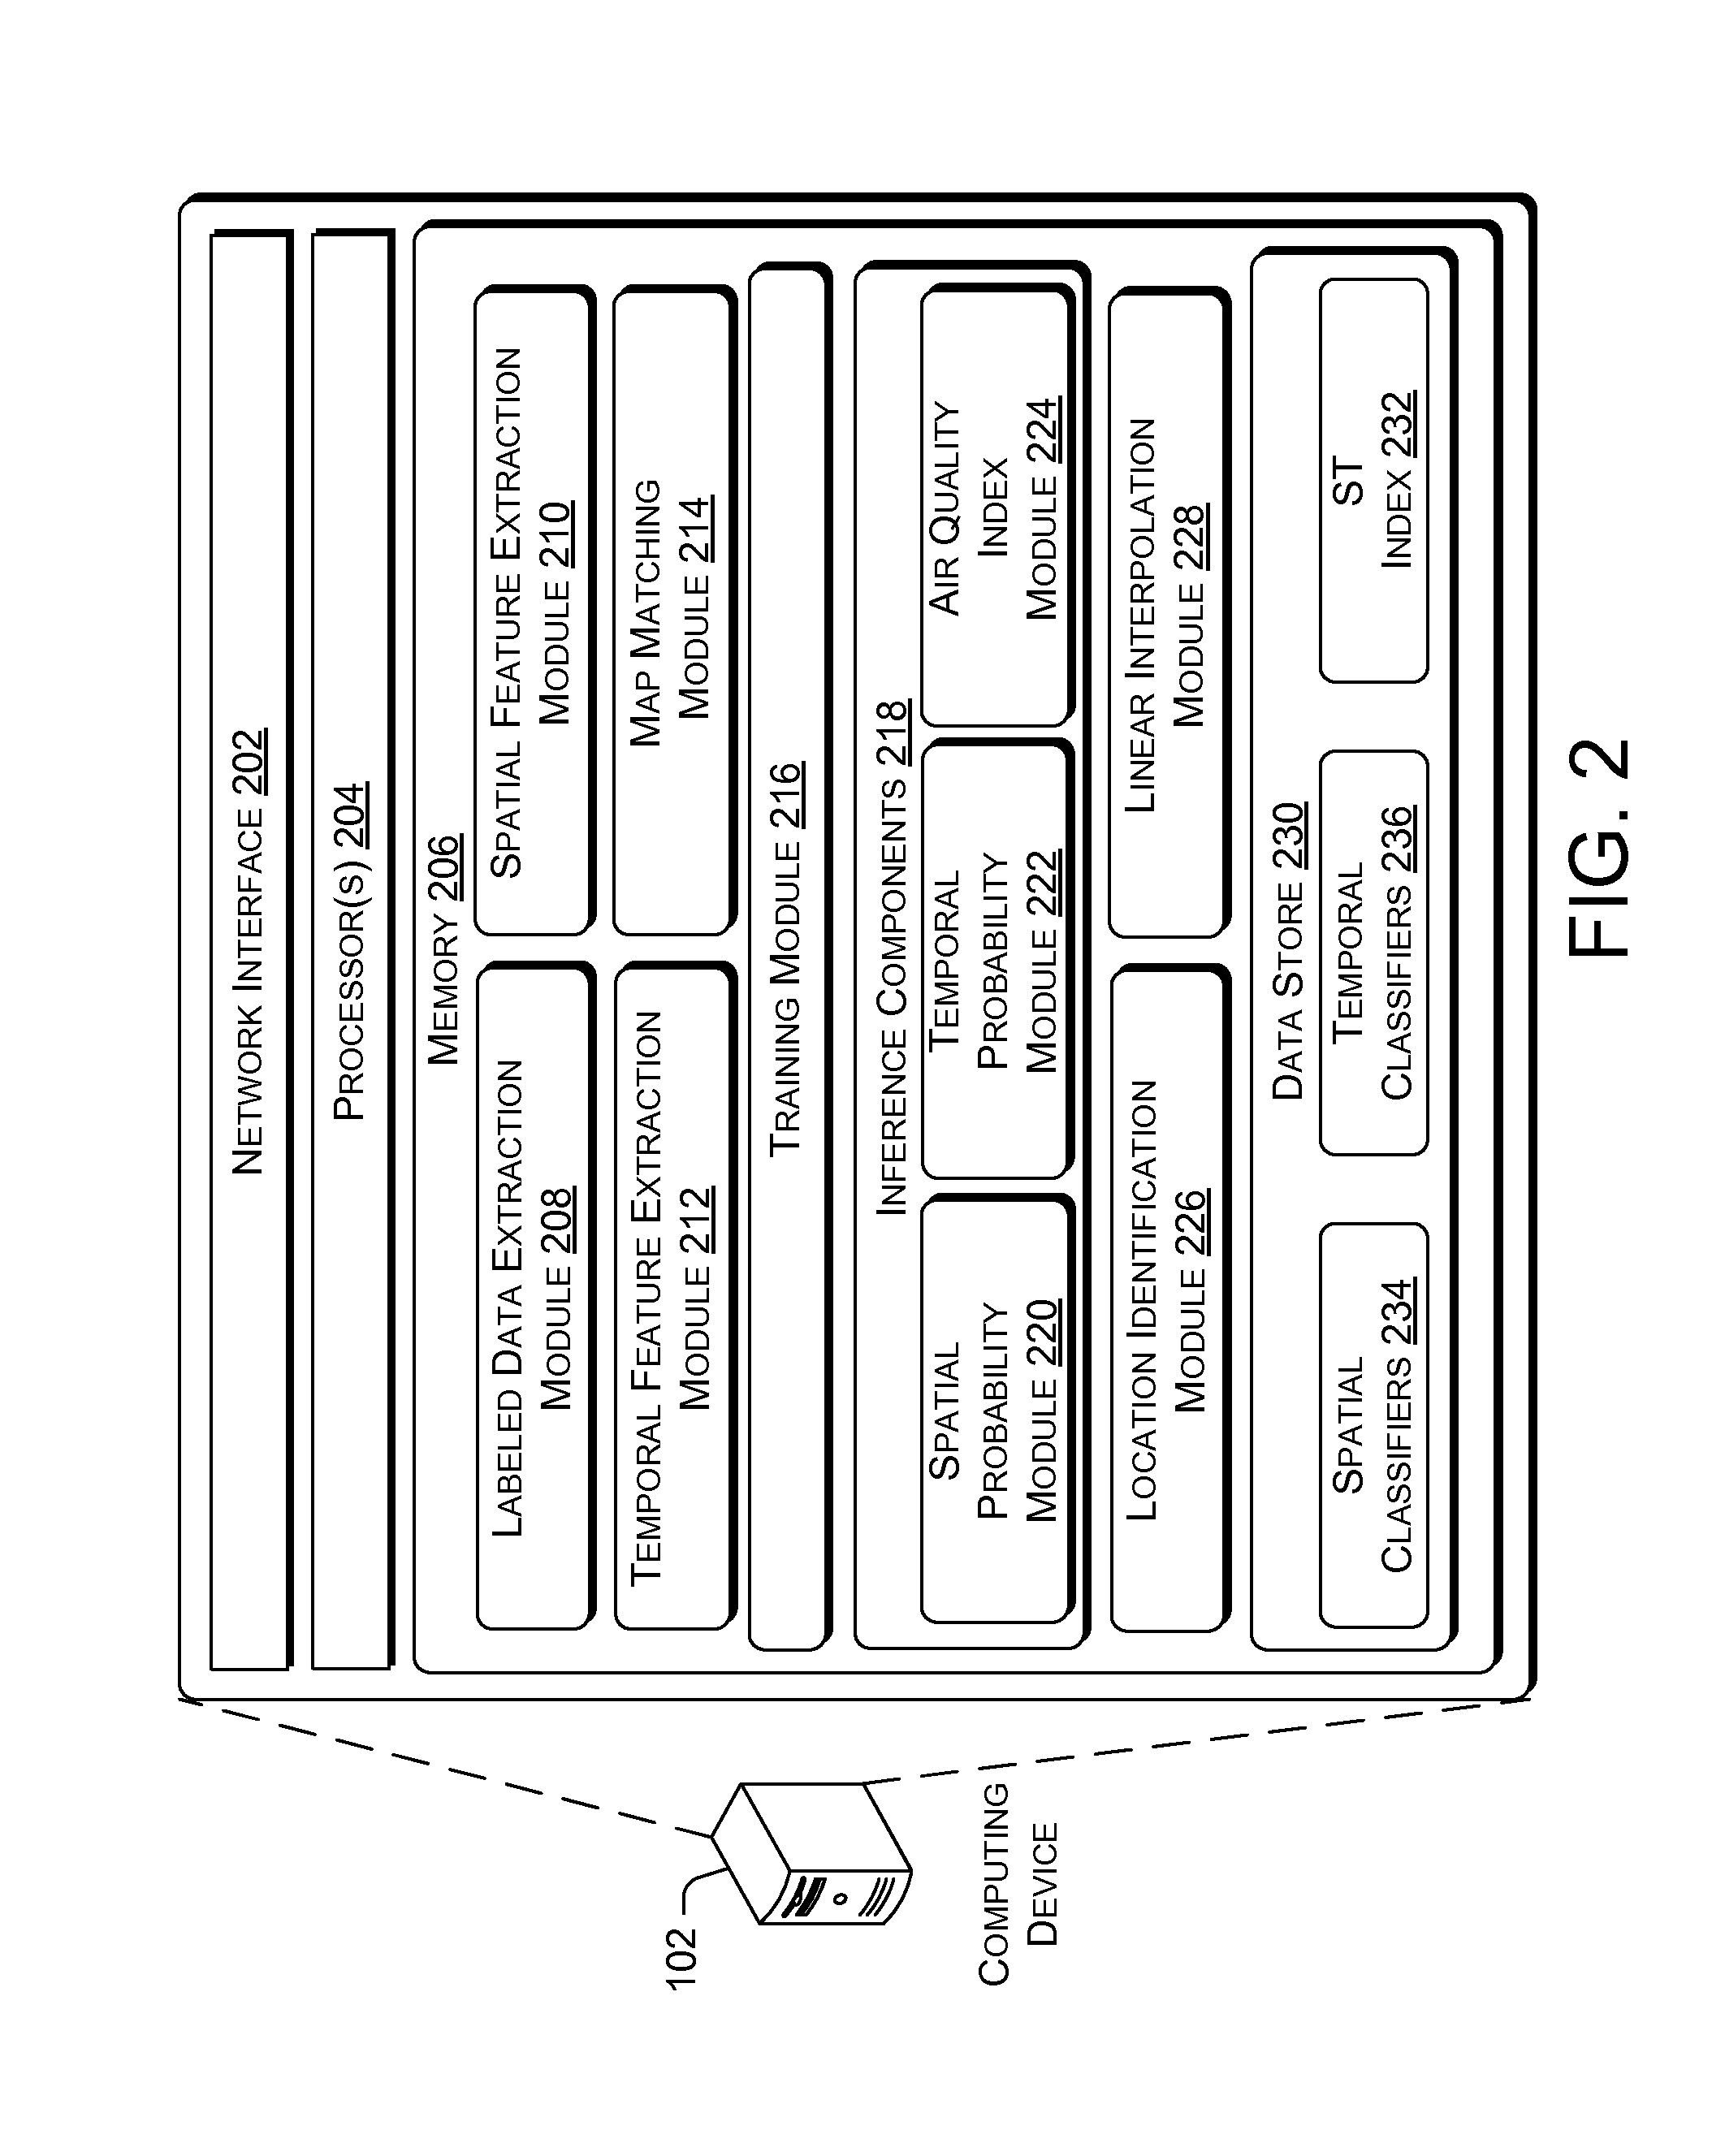
[0026]FIG. 2 is an illustrative diagram that shows example components of a computing device that supports the inference of air quality indices for multiple areas in a region based on multiple sources of data. In various embodiments, the computing device 102 may be a server, a group of servers, a general purpose computer, such as a desktop computer, a tablet computer, a laptop computer, and so forth. However, in other embodiments, the computing device 102 may be one of a smart phone, a game console, a personal digital assistant (PDA), and so forth.

[0027]Example computing device 102 includes a network interface 202, one or more processors 204, memory 206, and / or user interfaces that enable a user to interact with the computing device. The network interface 202 may include wired and / or wireless communication interface components that enable the computing device 102 to transmit and receive data via a network. The user interfaces may include a data output device (e.g., visual display, au...

example processes

[0080]FIGS. 5-7 describe various example processes for using spatial and temporal features to infer air quality information for areas without air quality monitor stations. The order in which the operations are described in each example process is not intended to be construed as a limitation, and any number of the described operations may be combined in any order and / or in parallel to implement each process. Moreover, the operations in each of the FIGS. 5-7 may be implemented in hardware, software, and / or a combination thereof. In the context of software, the operations may represent computer-executable instructions that, when executed by one or more processors, cause one or more processors to perform the recited operations. The one or more processors may be included in individual computing devices or included in multiple computing devices that are, for example, part of a cloud. Generally, computer-executable instructions include routines, programs, objects, components, data structur...


PUM


Abstract

The use of data from multiple data source provides inferred air quality indices with respect to a particular pollutant for multiple areas without the addition of air quality monitor stations to those areas. Labeled air quality index data for a pollutant in a region may be obtained from one or more air quality monitor stations. Spatial features for the region may be extracted from spatially-related data for the region. The spatially-related data may include information on fixed infrastructures in the region. Likewise, temporal features for the region may be extracted from temporally-related data for the region that changes over time. A co-training based learning framework may be further applied to co-train a spatial classifier and a temporal classifier based at least on the labeled air quality index data, the spatial features for the region, and the temporal features for the region.

Description

BACKGROUND[0001]Information about urban air quality, such as the concentration of SO2 and NO2, plays a role in protecting human health and controlling air pollution. Air quality may vary greatly in urban spaces as air quality is affected by multiple factors, such as meteorology, automobile traffic volume and patterns, and land use in different areas. For example, industrial and commercial areas tend to generate more air pollution than residential areas. Thus, monitoring air quality in an urban environment may require a large number of air quality monitor stations that are distributed throughout the urban environment.[0002]However, there are many obstacles to setting up an adequate number of air quality monitor stations. One obstacle is the cost of building these stations, as well as the cost of permanently staffing and maintaining these air quality monitor stations. Another obstacle is the limited availability of land in an urban environment for the construction of such air quality ...

Claims


Application Information

Patent Timeline
Patent Type & Authority Applications(United States)
IPC IPC(8): G06N7/00G06N3/08G06N99/00G06N20/00
CPCG06N7/005G06N3/08G06N99/005G06N20/00G06N7/01
Inventor ZHENG, YUXIE, XINGMA, WEI-YINGHON, HSIAO-WUENCHANG, ERIC I-CHAO
Owner MICROSOFT TECH LICENSING LLC
Why Eureka
Try Eureka