Method and markers for assessing the risk of having colorectal cancer
- Summary
- Abstract
- Description
- Claims
- Application Information
AI Technical Summary
Benefits of technology
Problems solved by technology
Method used
Image
Examples
experimental example 1
The Assessment Method may be used for Assessing the Risk of Having Colorectal Cancer for an Individual
[0068]Assessment Objects and Stool Samples
[0069]In this experimental example, stool samples of 144 colorectal cancer (CRC) patients and 390 healthy individuals were collected from Chang Gung Memorial Hospital in Taiwan, and the expression level of each microRNA listed in Table 1 is analyzed. Cancer is staged according to the 2009 American Joint Committee on Cancer staging criteria (7th edition), and clinicopathological factors are recorded simultaneously, including age, sex, and immunological fecal occult blood test (iFOBT) data. For sample collection, CRC patients donate their stool residuum samples which are leftovers of routine iFOBT before any kind of treatment. For the healthy control group, stool samples were obtained from a Healthy-Check Center in Taoyuan Chang Gung Memorial Hospital. Participants undergo colonoscopy and all have negative findings defined by absence of neopla...
experimental example 2
The Comparison of Effects between the Assessment Method and the Immunological Fecal Occult Blood Test
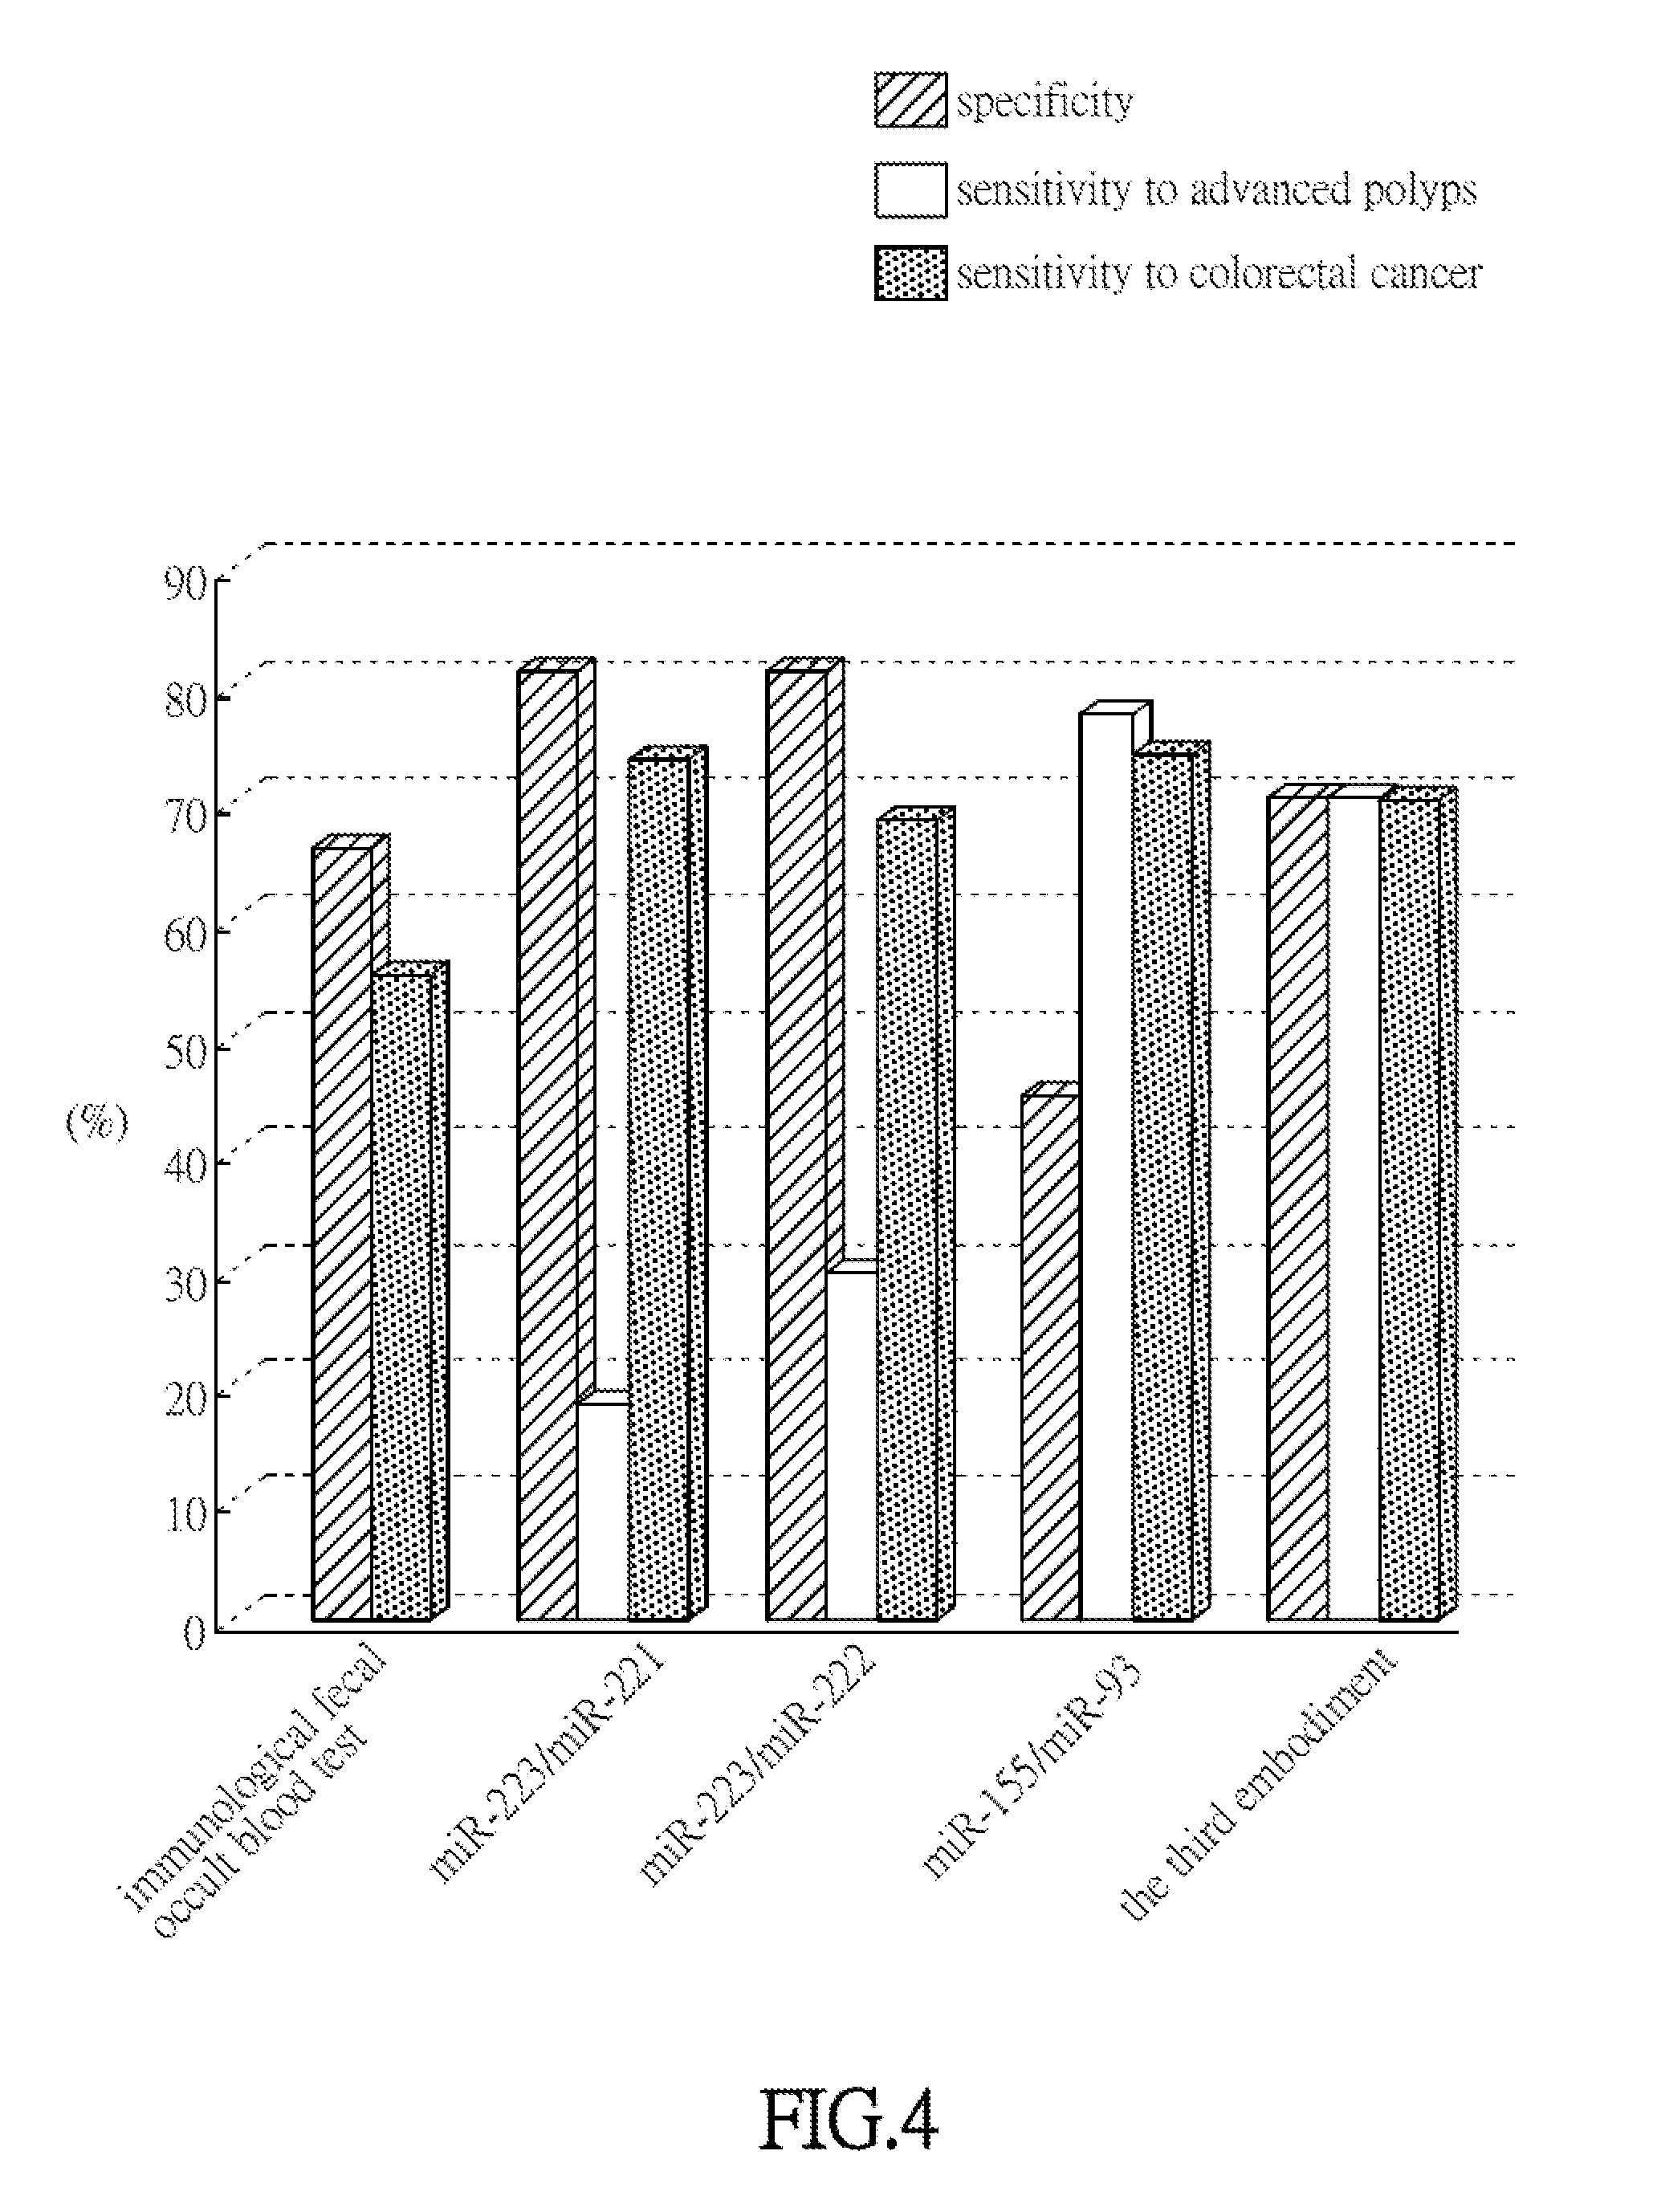
[0080]In Experimental example 2, the concentrations (expression levels) of the first microRNAs and the second microRNAs listed in Table 1 in the stool samples are detected according to the collection method and the method for detecting the expression level of Experimental example 1, and the stool samples are collected from 390 healthy individuals and 144 patients with diagnosed colorectal cancer in Experimental example 1.
[0081]Subsequently, receiver operating characteristic curves (ROC curves) are plotted with PASW Statistics 18.0 using the ratios between the first microRNAs and the second microRNAs in different combinations according to Table 2 and the source of each stool sample which is from an individual in the healthy control group or a colorectal cancer patient. Then, the area under the ROC curve (AUC) is calculated to obtain corresponding Youden Index acting as the detection t...
experimental example 3
The Comparison of Effects between the Assessment Method and Using a Single microRNA for Assessment
[0087]The experimental process and data calculation of Experimental example 3 may both refer to Experimental example 2 mentioned above. In this experimental example, compared with using an expression level of a single microRNA (first microRNA or second microRNA) for assessment, using the ratio between expression levels of the first microRNA and the second microRNA shown in Table 2 has better result. For example, the obtained AUC values (diagnostic accuracy) of miR-223 / miR-221, miR-223 / miR-222, miR-223 / miR-21, miR-223 / miR-93, miR-25 / miR-221, miR-25 / miR-222, miR-25 / miR-21, miR-25 / miR-93, miR-25 / miR-141, miR-25 / miR-200c, and miR-25 / miR-191 are greater than the AUC values (diagnostic accuracy) of using the first microRNA (miR-223 or miR-25) only or using the second microRNA (miR-221, miR-222, miR-21, miR-93, miR-141, miR-200c, or miR-191) only. It shows that using the ratios between the exp...
PUM
| Property | Measurement | Unit |
|---|---|---|
| Level | aaaaa | aaaaa |
Abstract
Description
Claims
Application Information
 - R&D
- Intellectual Property
- Life Sciences
- Materials
- Tech Scout
- Unparalleled Data Quality
- Higher Quality Content
- 60% Fewer Hallucinations
Browse by: Latest US Patents, China's latest patents, Technical Efficacy Thesaurus, Application Domain, Technology Topic, Popular Technical Reports.
© 2025 PatSnap. All rights reserved.Legal|Privacy policy|Modern Slavery Act Transparency Statement|Sitemap|About US| Contact US: help@patsnap.com


