System and method for assessing smart power grid networks

a smart power grid and vulnerability assessment technology, applied in the field of smart power grid networks, can solve problems such as unplanned stressors and outages in the infrastructure of spgns

Inactive Publication Date: 2017-07-27
NORTH CAROLINA AGRICULTURAL AND TECHNICAL STATE UNIVERSITY
View PDF0 Cites 14 Cited by
  • Summary
  • Abstract
  • Description
  • Claims
  • Application Information

AI Technical Summary

Benefits of technology

[0011]A computer-readable storage medium is provided for determining a centrality score for a bus in a network of buses in a smart power grid network, the computer-readable storage medium being non-transitory and having computer readable program code portions stored therein that, in response to execution by one or more central processing units (CPUs) and or more additional CPUs, cause a computer system to at least process a network vulnerability characterization for evaluating the bus, the network vulnerability characterization being selected from line susceptance, modified line susceptance, power traffic, and / or power loss, and analyze the selected network vulnerability characterization to arrive at the centrality score based on a calculation matrix selected from a pseudo-degree matrix, pseudo-Laplacian matrix, and / or a pseudo-adjacency matrix.

Problems solved by technology

However, as with all types of electrical grid networks, the infrastructure of SPGNs is vulnerable to unplanned stressors and outages resulting from both intentional and unintentional acts, such as targeted attacks, weather-related events, and other emergency situations.

Method used


Image

  • System and method for assessing smart power grid networks
  • System and method for assessing smart power grid networks
  • System and method for assessing smart power grid networks

Examples


example 1

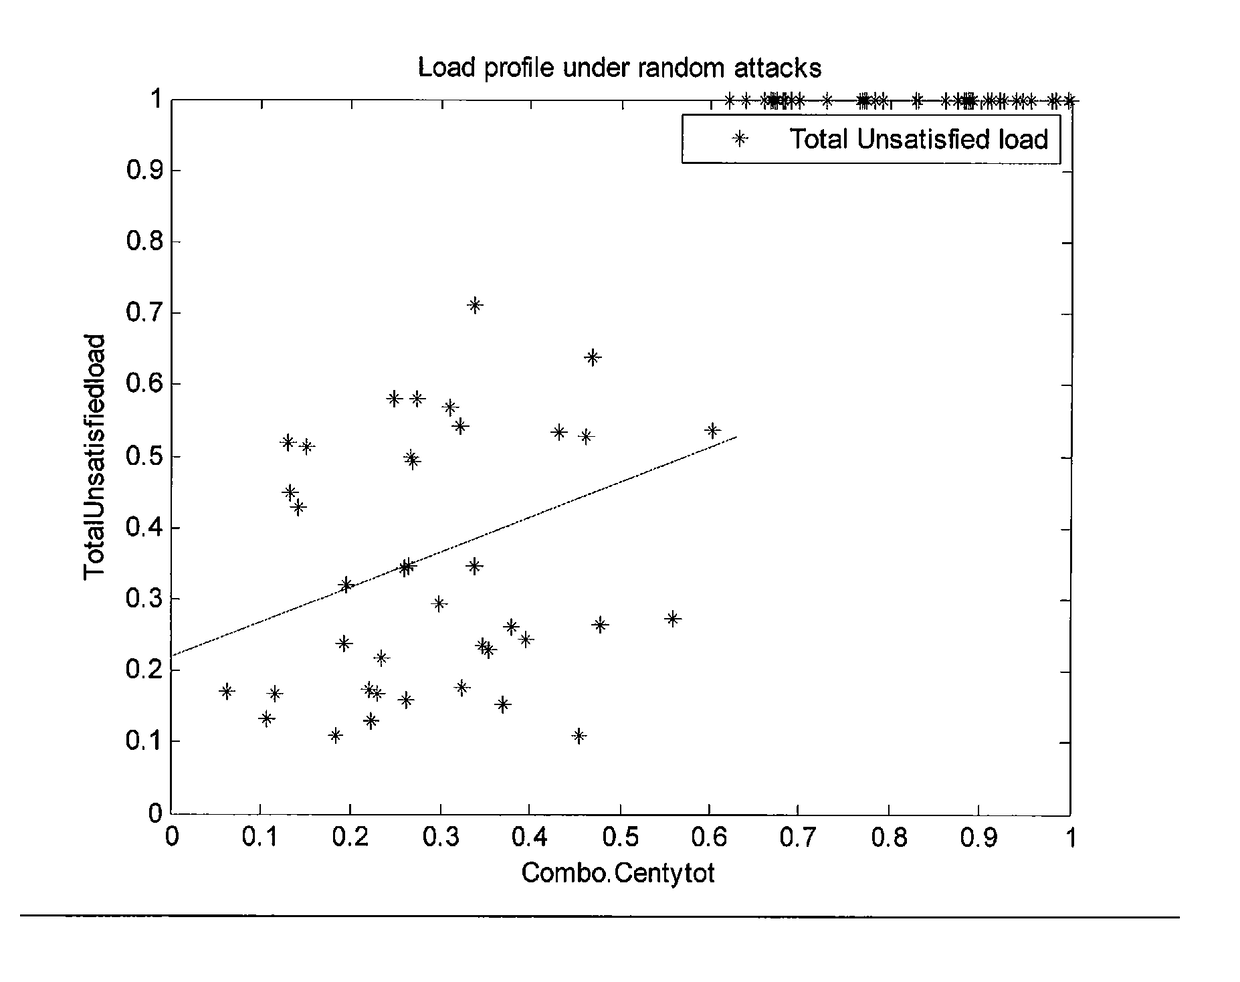
[0030]An example of a random attack causing brownout / blackout applied to the IEEE-57 bus network using centrality based on power traffic eigenvector is considered below. Here, 20 buses were removed but no generator buses were removed. The power flow was computed using the Newton Raphson method with a maximum number of iterations of 50. One hundred Monte Carlo simulations were conducted. For every simulation, the proportion of total unsatisfied load is plotted against the total centrality score of all buses removed.

example 2

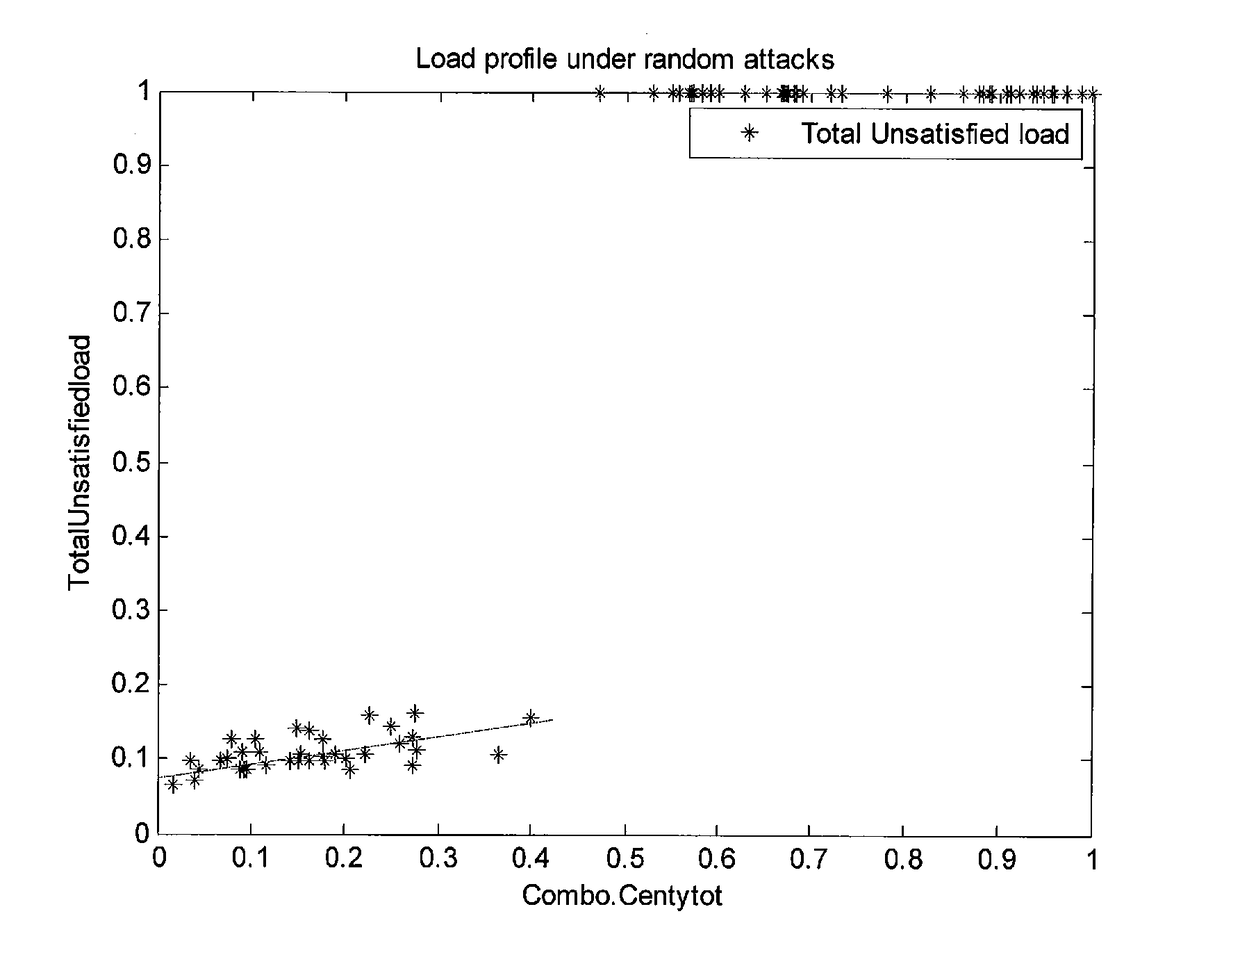
[0031]A similar example of a random attack causing brownout / blackout applied to the IEEE-57 bus network using centrality based on power traffic eigenvector is considered below. In contrast with Example 1, the twenty buses removed included generator buses. The power flow was computed using the Newton Raphson method with a maximum number of iterations of 50. One hundred Monte Carlo simulations were conducted. For every simulation, the proportion of total unsatisfied load is plotted against the total centrality score of all buses removed. The proposed algorithms make sharper predictions in this case, as generator buses tend to be more important than connection buses.

example 3

[0032]When the attack is by a malicious knowledgeable party, highly central and crucial buses are likely to be attacked first, hence leading to greater vulnerability to brownout / blackout. In this example, applied to the IEEE-57 bus network with centrality based on power traffic degree; between 1 and 3 buses were removed in a step-wise fashion, based on their centrality score. For instance, when 2 buses are removed at a time, buses ranked #1 and #2 (according to centrality) are first removed from the original complete network. In the next step, buses ranked #2 and #3 are removed from the original complete network; in the next step, buses ranked #3 and #4 are removed from the original complete network and so on. Analogously, when 3 buses are removed at a time, buses ranked according to centrality #1, #2 and #3 are removed in a first step, buses ranked #2, #3, and #4 are removed in a subsequent step, and so on.

[0033]For each case, the Newton Raphson method is used to compute the power ...


PUM


Abstract

A method, system, and software for predicting a brownout or blackout in a smart power grid network. A network vulnerability characterization is selected among line susceptance, modified line susceptance, power traffic, and power loss. The selected characterization is analyzed based on a calculation matrix such as a pseudo-degree matrix, pseudo-Laplacian matrix, or a pseudo-adjacency matrix. A centrality score, such as degree centrality or eigenvector centrality, is determined for at least one bus in the network based on the selected network vulnerability characterization and the corresponding calculation matrix. A series of network simulations are performed based on removal of at least one bus in the network. The network simulations are specific to the selected vulnerability characterization and corresponding calculation matrix.

Description

RELATED APPLICATION DATA[0001]This application claims priority under 35 U.S.C. §119(e) to U.S. Provisional Patent Application No. 62 / 020,129 filed Jul. 2, 2014, the disclosure of which is incorporated herein by reference in its entirety.STATEMENT OF GOVERNMENT RIGHTS[0002]This invention was made with government support under HDTRA1-03-1-0010 awarded by the Defense Threat Reduction Agency. The government has certain rights in the invention.TECHNOLOGICAL FIELD[0003]The present invention is directed towards smart power grid networks and, more particularly, a system and method for assessing the vulnerability of smart power grid networks.BACKGROUND[0004]Smart power grid networks (SPGNs) are known in the art as modernized electrical power grids that utilize computer-based remote control and automation. The SPGNs manage electricity demand in a more sustainable, reliable, and economic manner. However, as with all types of electrical grid networks, the infrastructure of SPGNs is vulnerable t...

Claims


Application Information

Patent Timeline
Patent Type & Authority Applications(United States)
IPC IPC(8): H02J3/00G06N5/02G01R21/00G05B15/02
CPCH02J3/00G05B15/02H02J2003/007G01R21/00G06N5/02G01R19/2513H02J2203/20Y02E60/00Y04S40/20
Inventor CHOPADE, PRAVIN VISHWASRAOBIKDASH, MARWAN U.
Owner NORTH CAROLINA AGRICULTURAL AND TECHNICAL STATE UNIVERSITY
Why Eureka
Try Eureka