

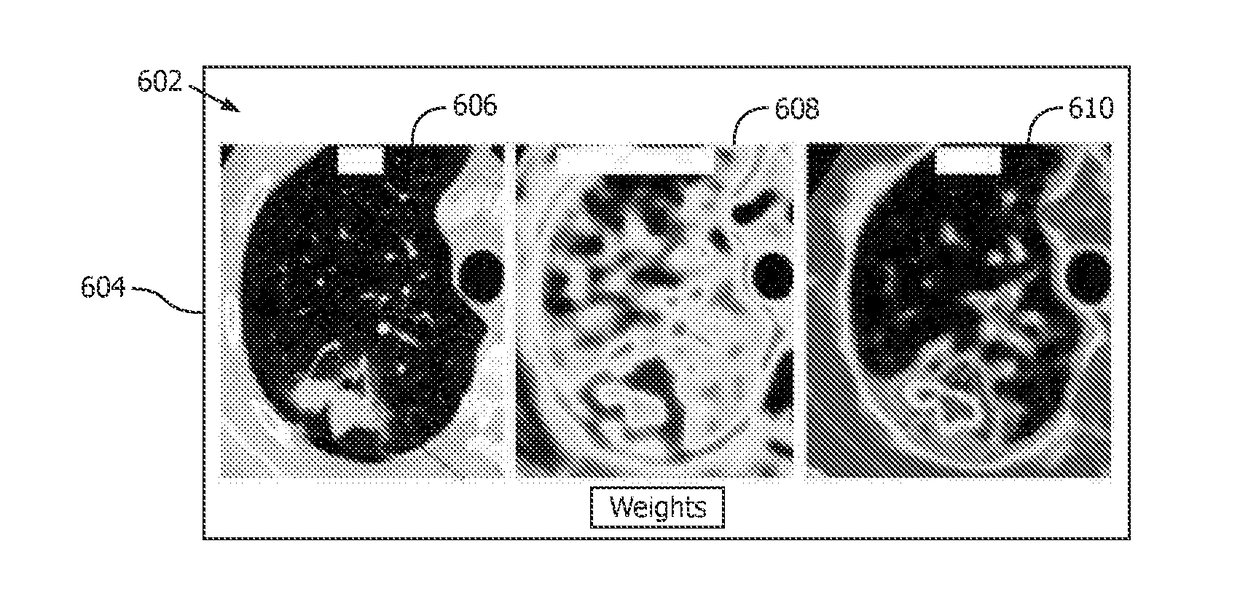
Texture analysis map for image data
a texture analysis and image data technology, applied in the field of image data, can solve the problems of ct volumetric image data, volumetric image data does not reflect, and is not possible with conventional (non-spectral) texture analysis techniques
- Summary
- Abstract
- Description
- Claims
- Application Information
AI Technical Summary
Benefits of technology
Problems solved by technology
Method used
Image

Examples
Embodiment Construction
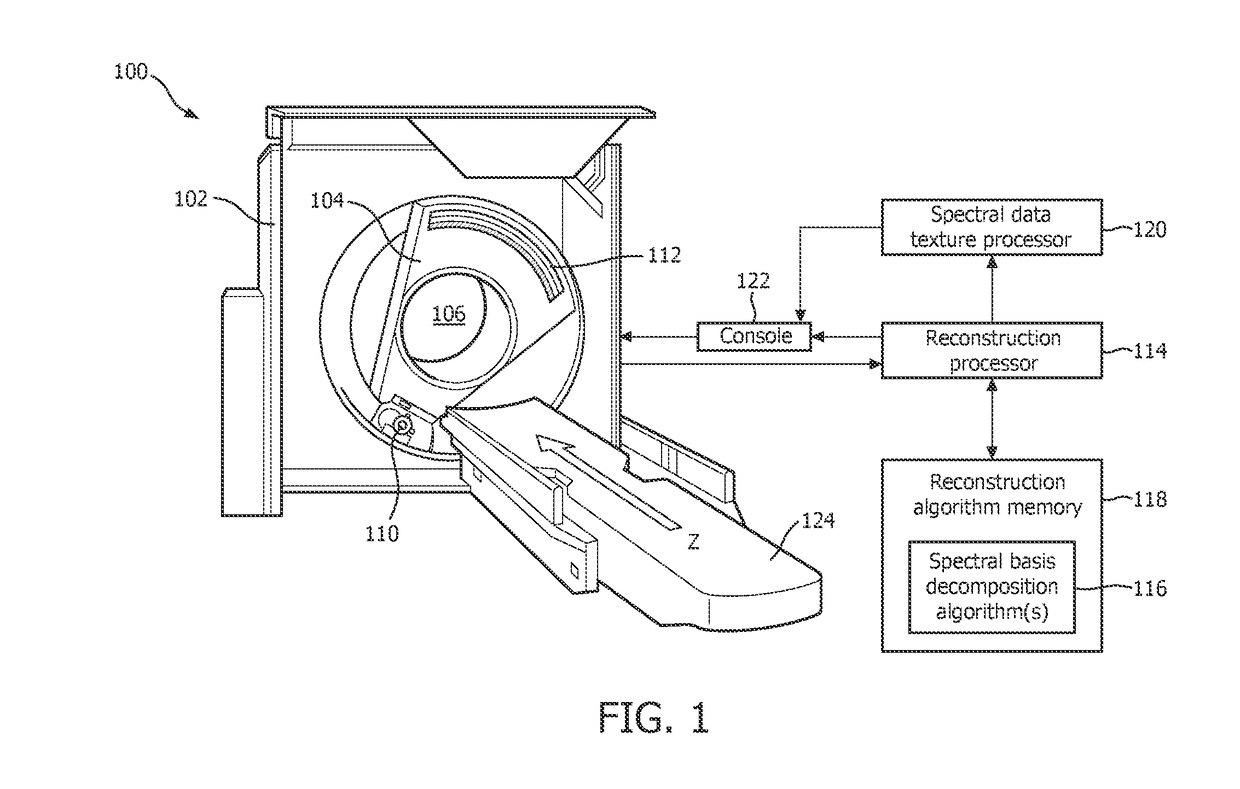
[0021]FIG. 1 illustrates an example imaging system 100. Suitable imaging modalities include CT, MR, SPECT, PET, US, etc. For sake of brevity and clarity, the following describes embodiments herein in connection with CT. However, the skilled artisan (e.g., in the field of medical imaging and / or other field) will understand, from at least solely the description herein, modifications and / or alterations for the other suitable imaging modalities without undue experimentation. The illustrated imaging system 100 includes a stationary gantry 102 and a rotating gantry 104, which is rotatably supported by the stationary gantry 102. The rotating gantry 104 rotates around an examination region 106 about a longitudinal or z-axis “Z”.
[0022]A radiation source 110, such as an x-ray tube, is rotatably supported by the rotating gantry 104, rotates with the rotating gantry 104, and emits x-ray radiation that traverses the examination region 106. In one instance, the radiation source 110 is configured ...
PUM
 Abstract
Description
Claims
Application Information