Tumor proximity measure
- Summary
- Abstract
- Description
- Claims
- Application Information
AI Technical Summary
Benefits of technology
Problems solved by technology
Method used
Image
Examples
Embodiment Construction
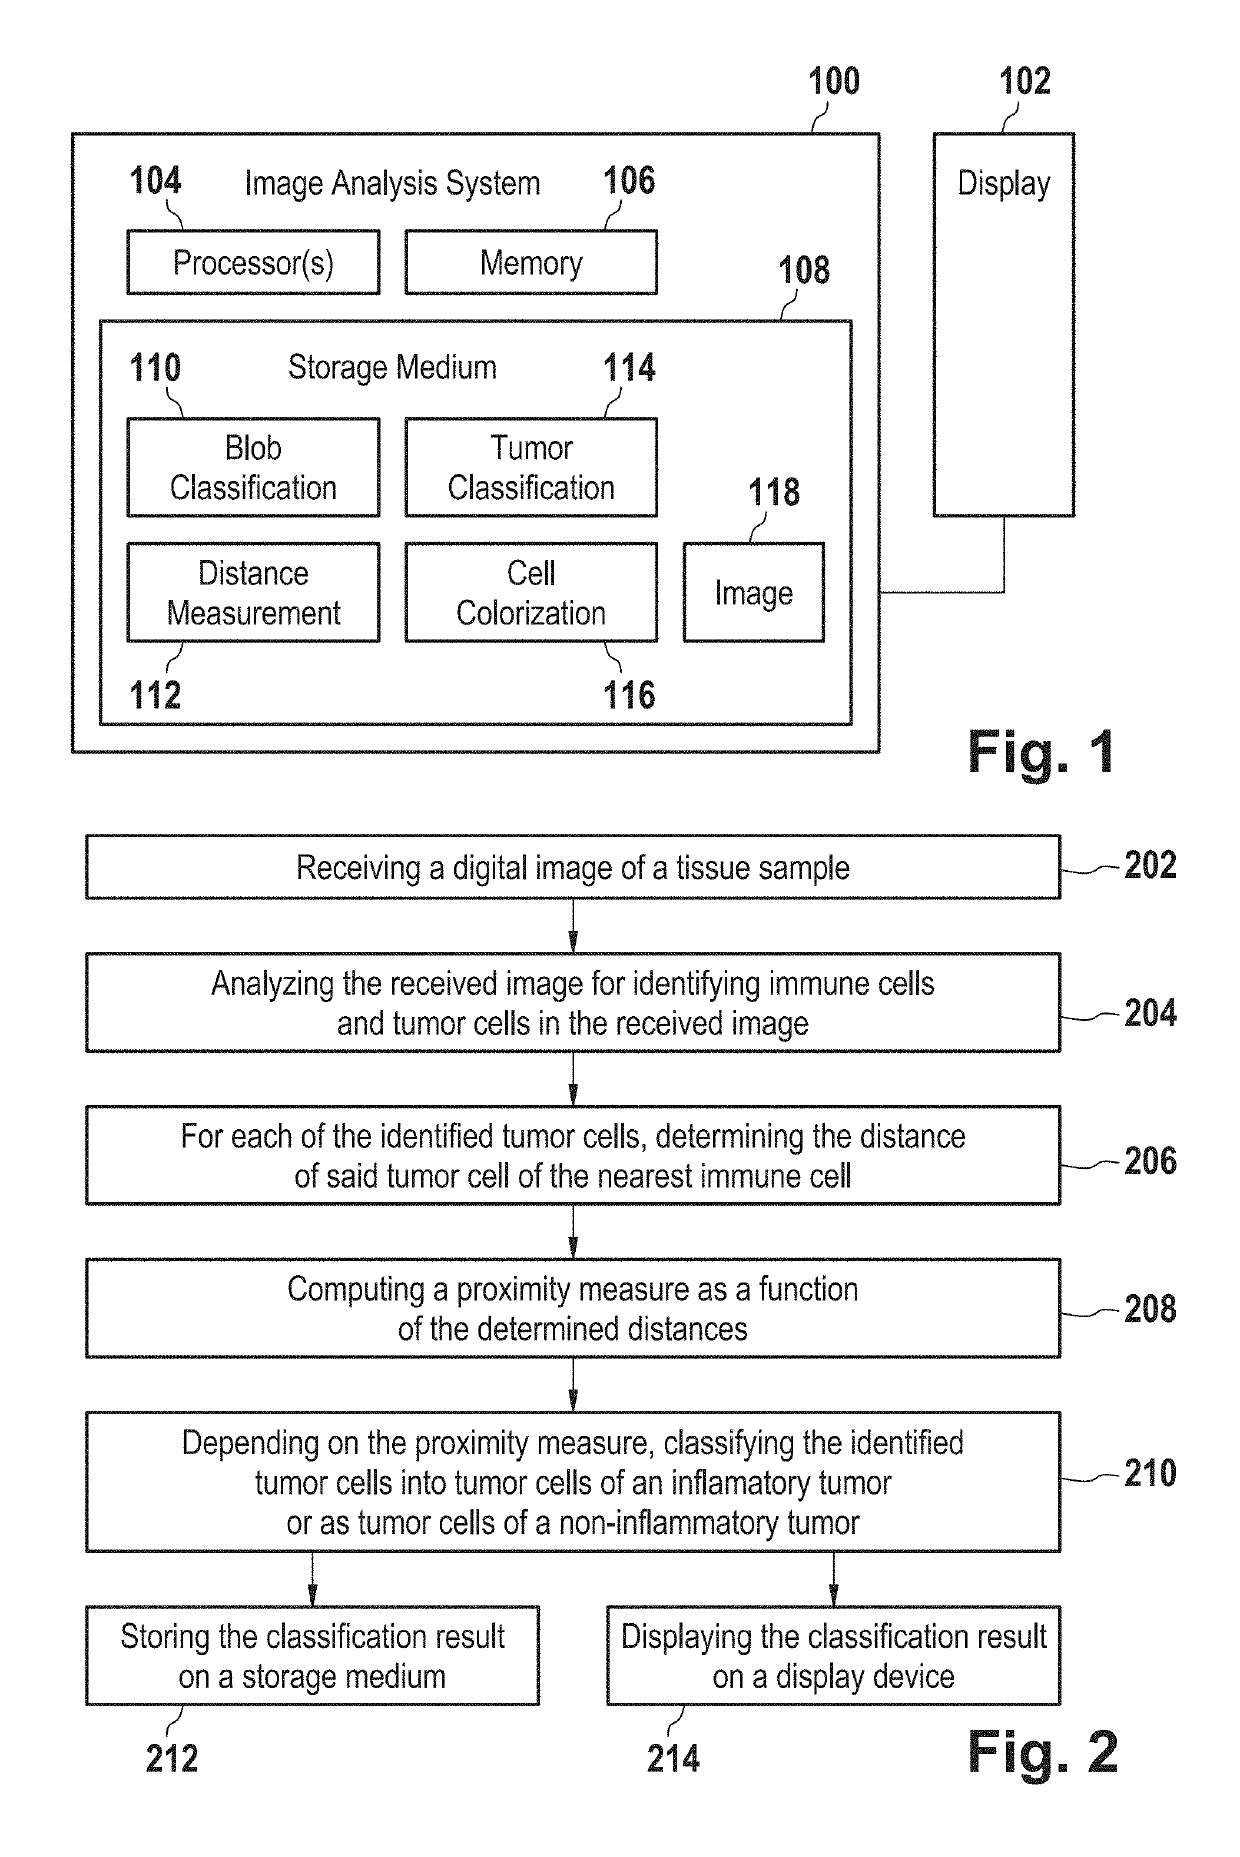
[0131]FIG. 1 is a block diagram of an image analysis system;
[0132]FIG. 2 is a flow chart of an image analysis method for classifying tumors;
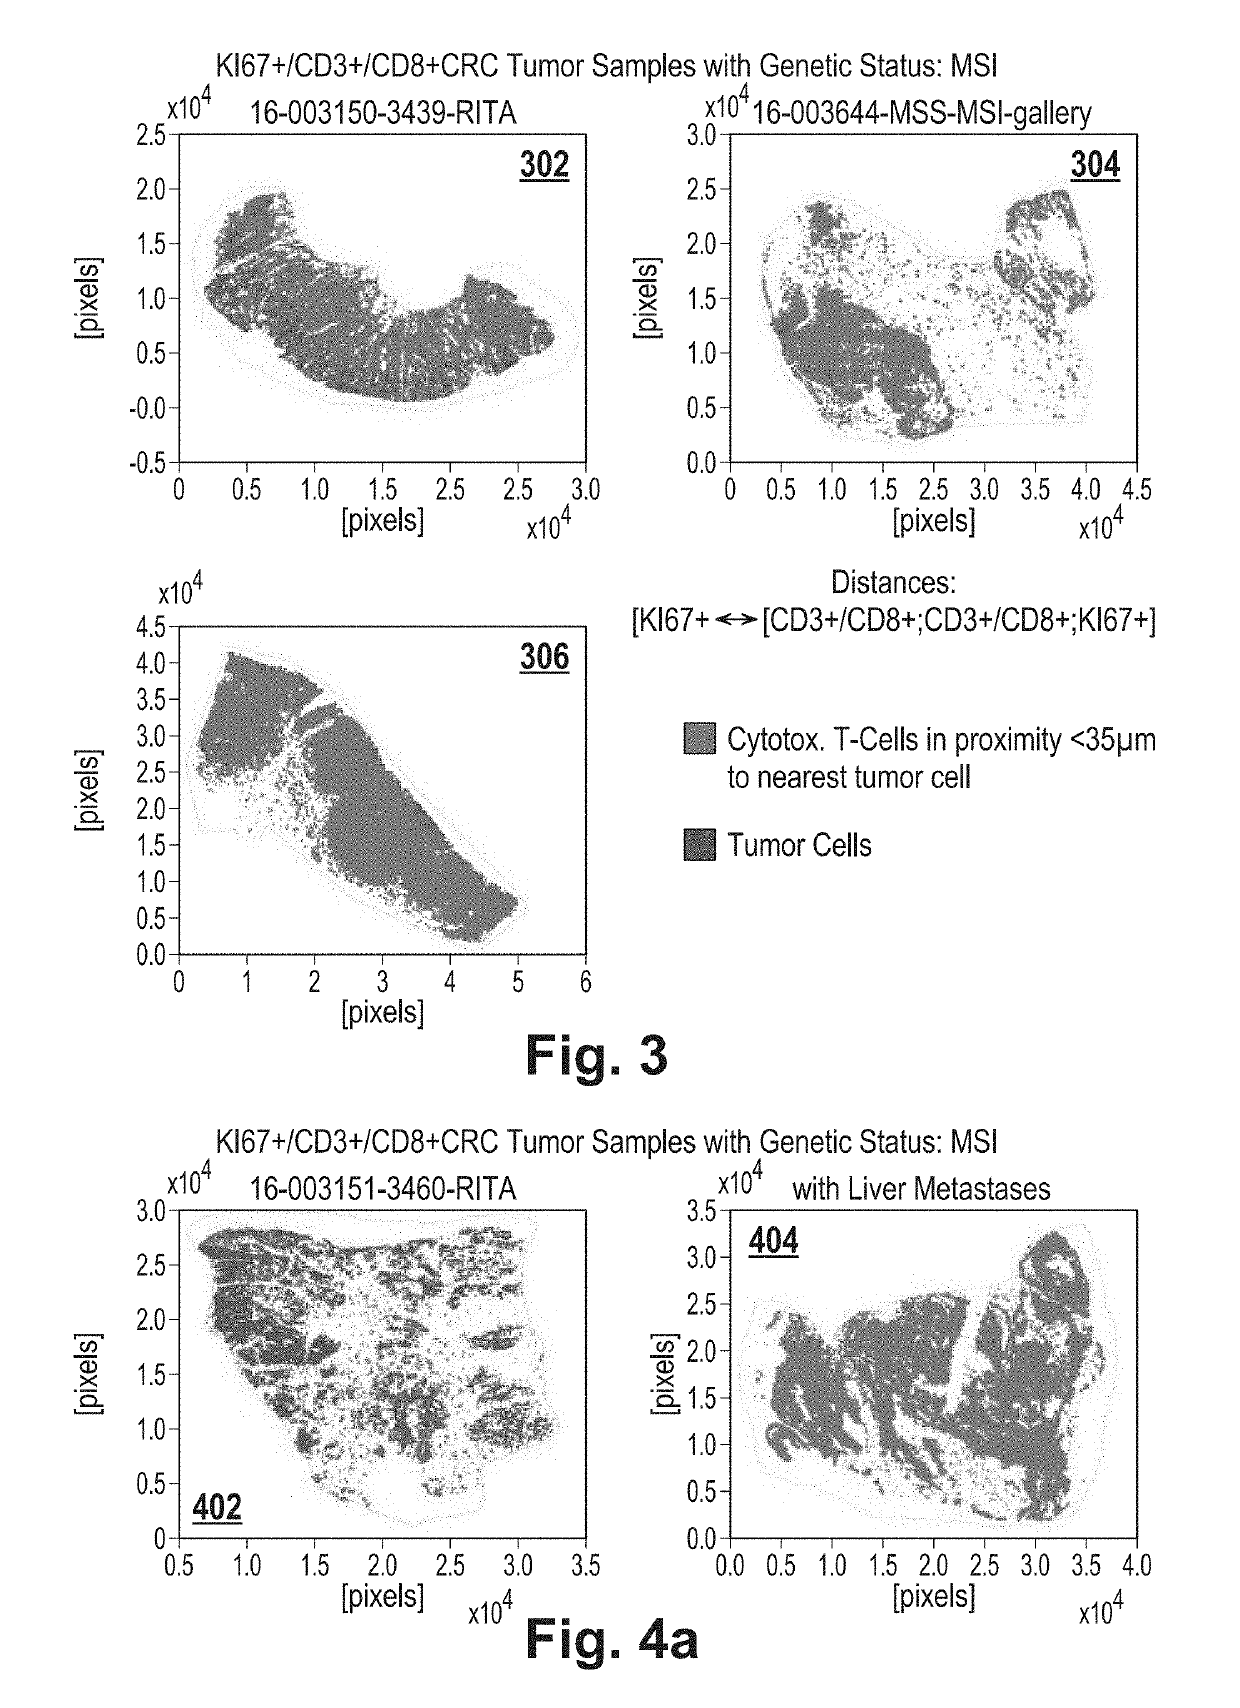
[0133]FIG. 3 depicts three overlay images derived from respective MSI tumor samples, the image comprising a first layer with tumor cells and a second layer with differently colored immune cells lying within a maximum distance from the nearest tumor cell;
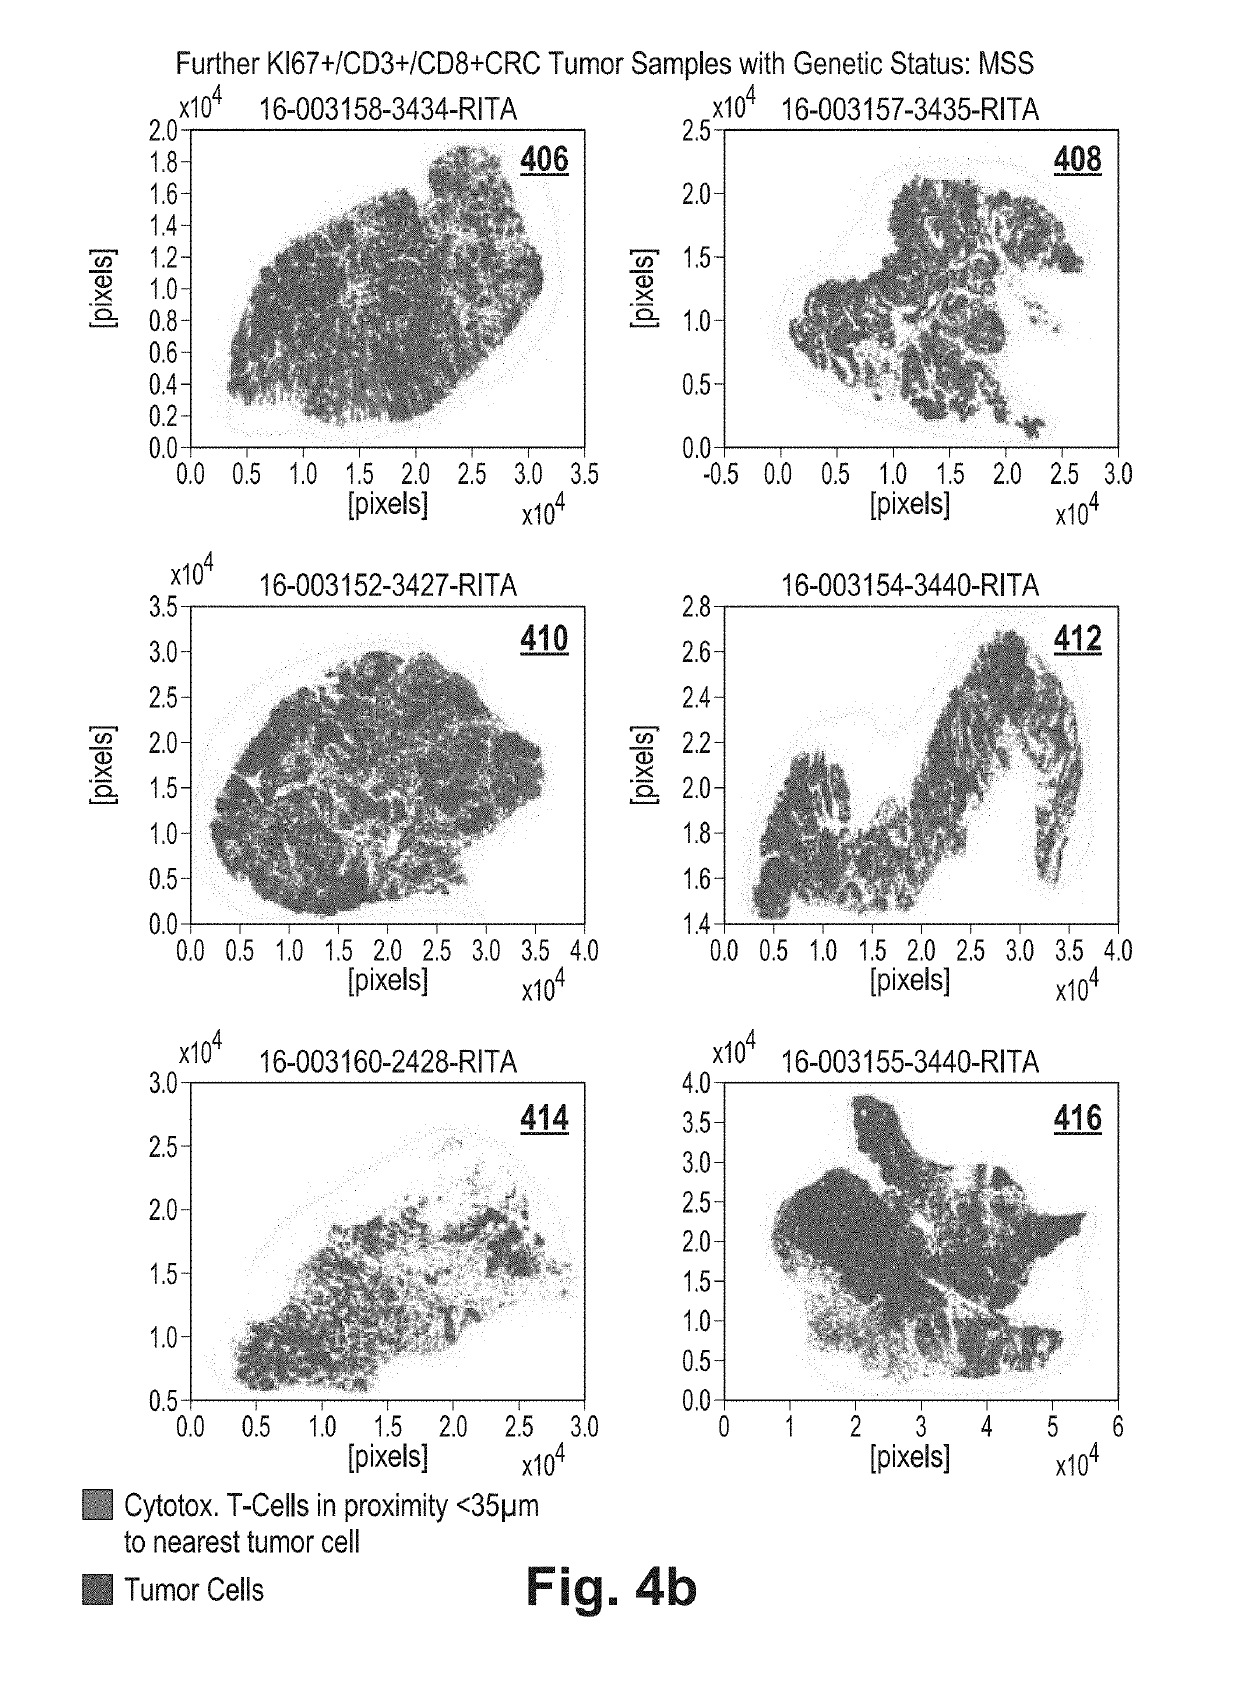
[0134]FIG. 4 depicts 8 overlay images derived from respective MSS tumor samples;
[0135]FIG. 5 depicts three histograms derived from the three MSI tissue samples depicted in FIG. 3;
[0136]FIG. 6 depicts 8 histograms derived from the 8 MSS tissue samples depicted in FIG. 4;
[0137]FIG. 7 depicts three IHC fluorescent images of the three MSI tissue samples depicted in FIG. 3;
[0138]FIG. 8 depicts 8 fluorescent images of the 8 MSS tissue samples depicted in FIG. 4;
[0139]FIG. 9 depicts a comparison of the overlay image, the IHC fluorescent image and the histogram generated for a MSI sample (left column) an...
PUM
 Abstract
Description
Claims
Application Information
 - R&D
- Intellectual Property
- Life Sciences
- Materials
- Tech Scout
- Unparalleled Data Quality
- Higher Quality Content
- 60% Fewer Hallucinations
Browse by: Latest US Patents, China's latest patents, Technical Efficacy Thesaurus, Application Domain, Technology Topic, Popular Technical Reports.
© 2025 PatSnap. All rights reserved.Legal|Privacy policy|Modern Slavery Act Transparency Statement|Sitemap|About US| Contact US: help@patsnap.com


