
Pipeline interchange/transmix

a technology of pipelines and interchanges, applied in the direction of instrumentation, programme control, optical radiation measurement, etc., can solve the problems of unsatisfactory, expensive pipeline stoppage, and extreme complexity of refineries

Active Publication Date: 2021-08-19
PHILLIPS 66 CO
View PDF0 Cites 4 Cited by
  • Summary
  • Abstract
  • Description
  • Claims
  • Application Information

AI Technical Summary

Benefits of technology

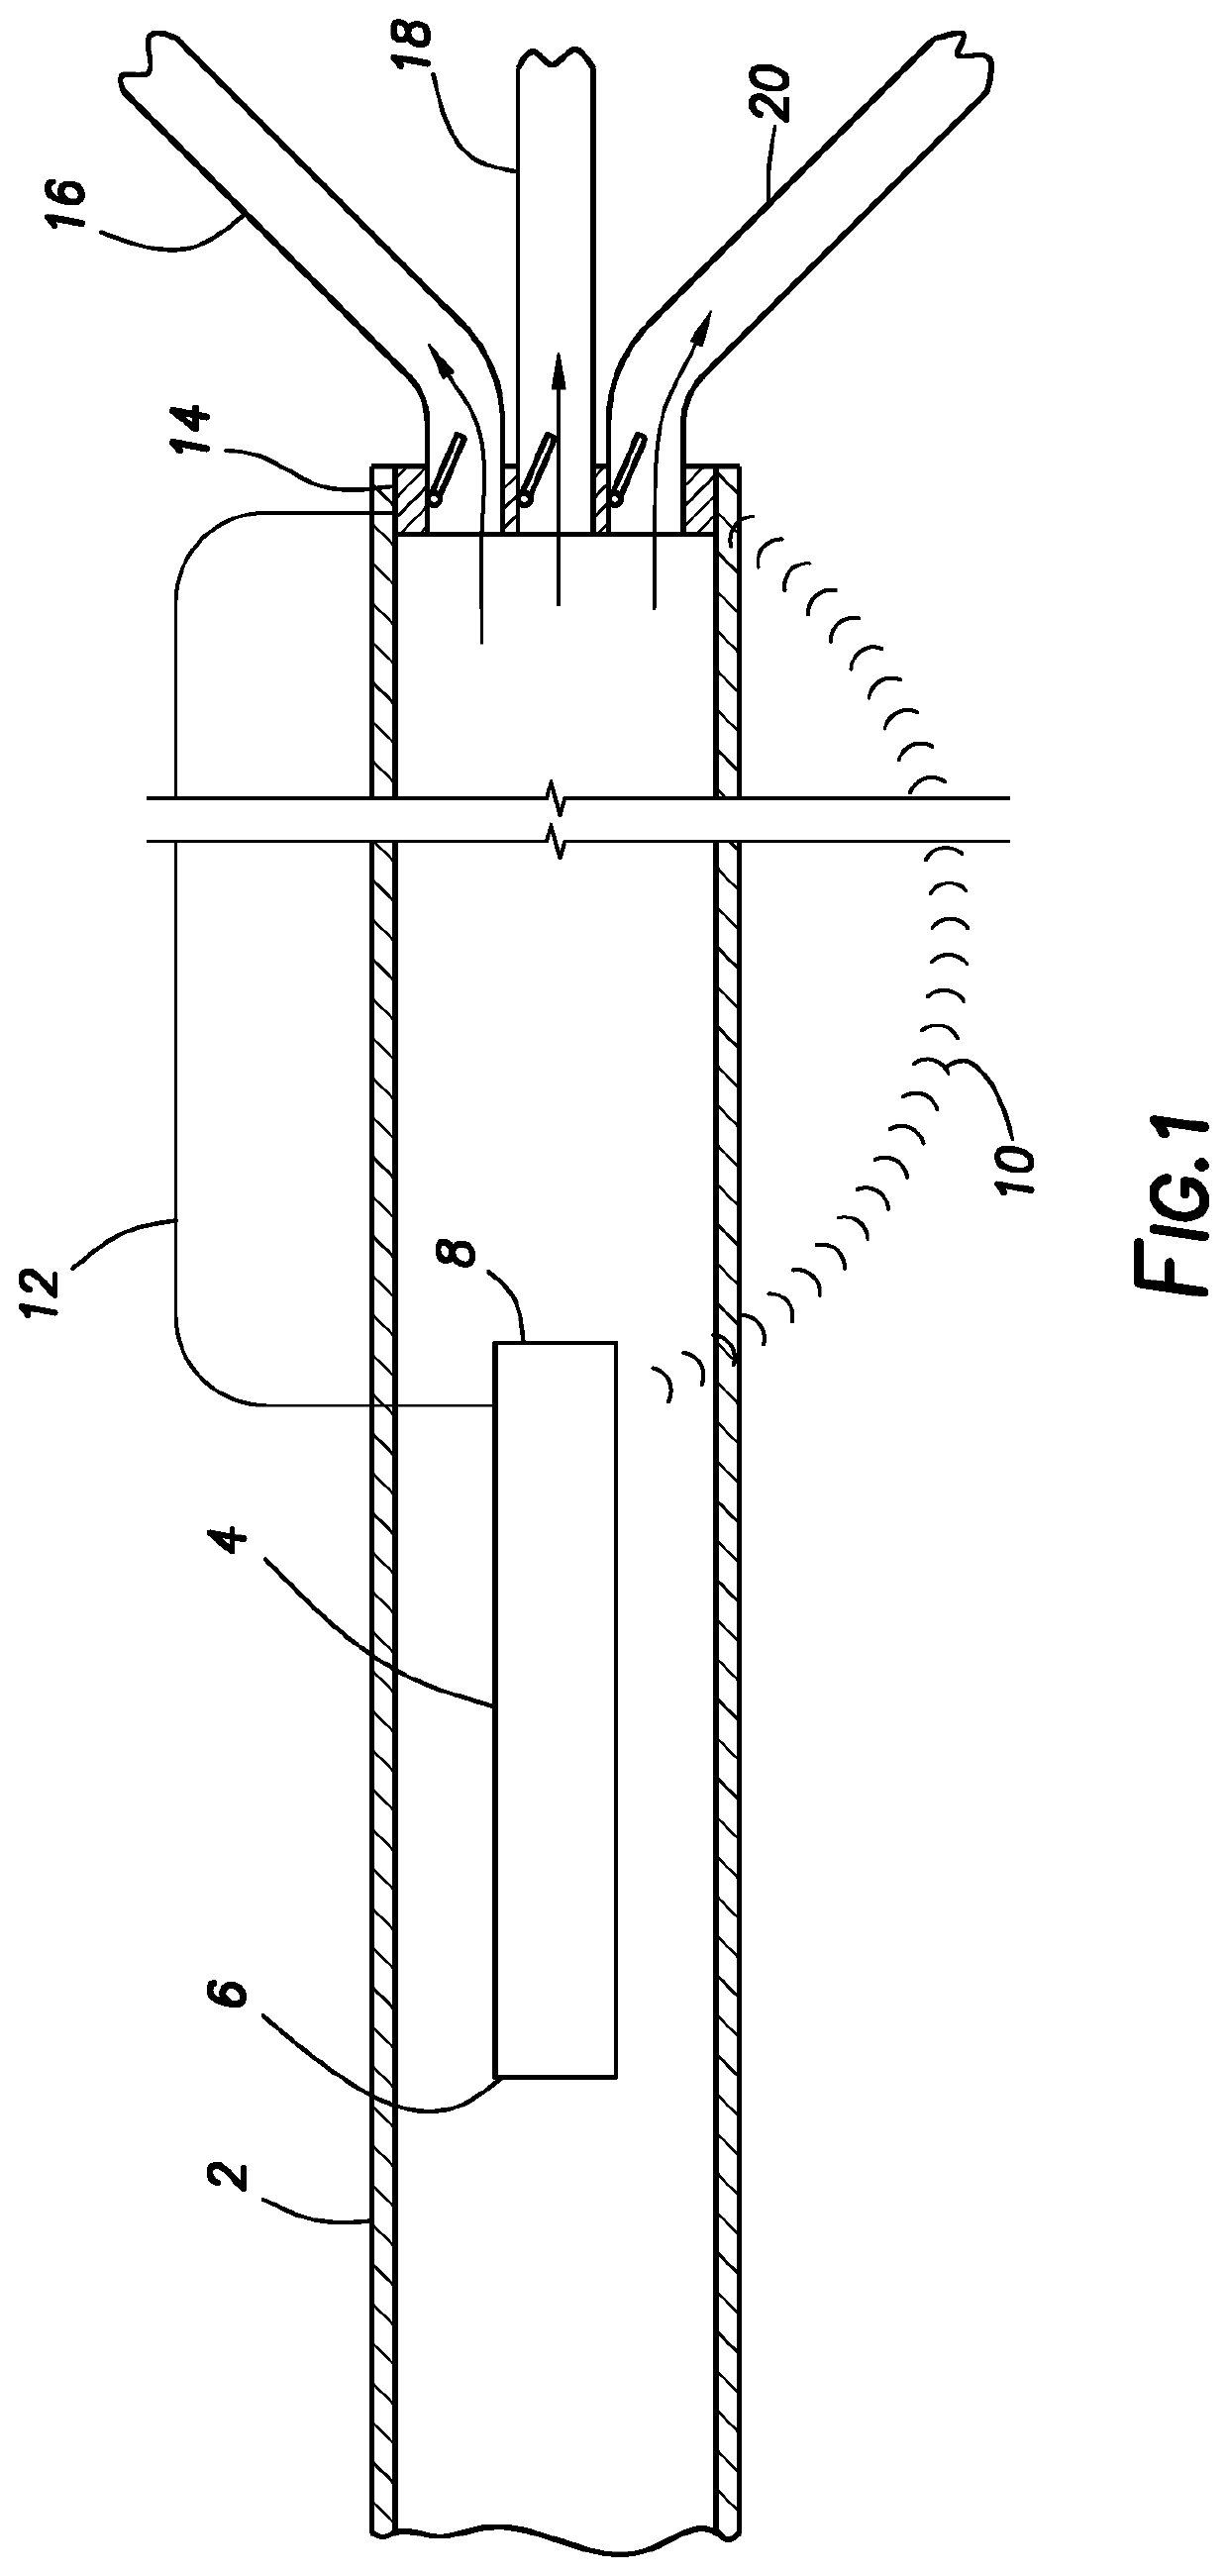
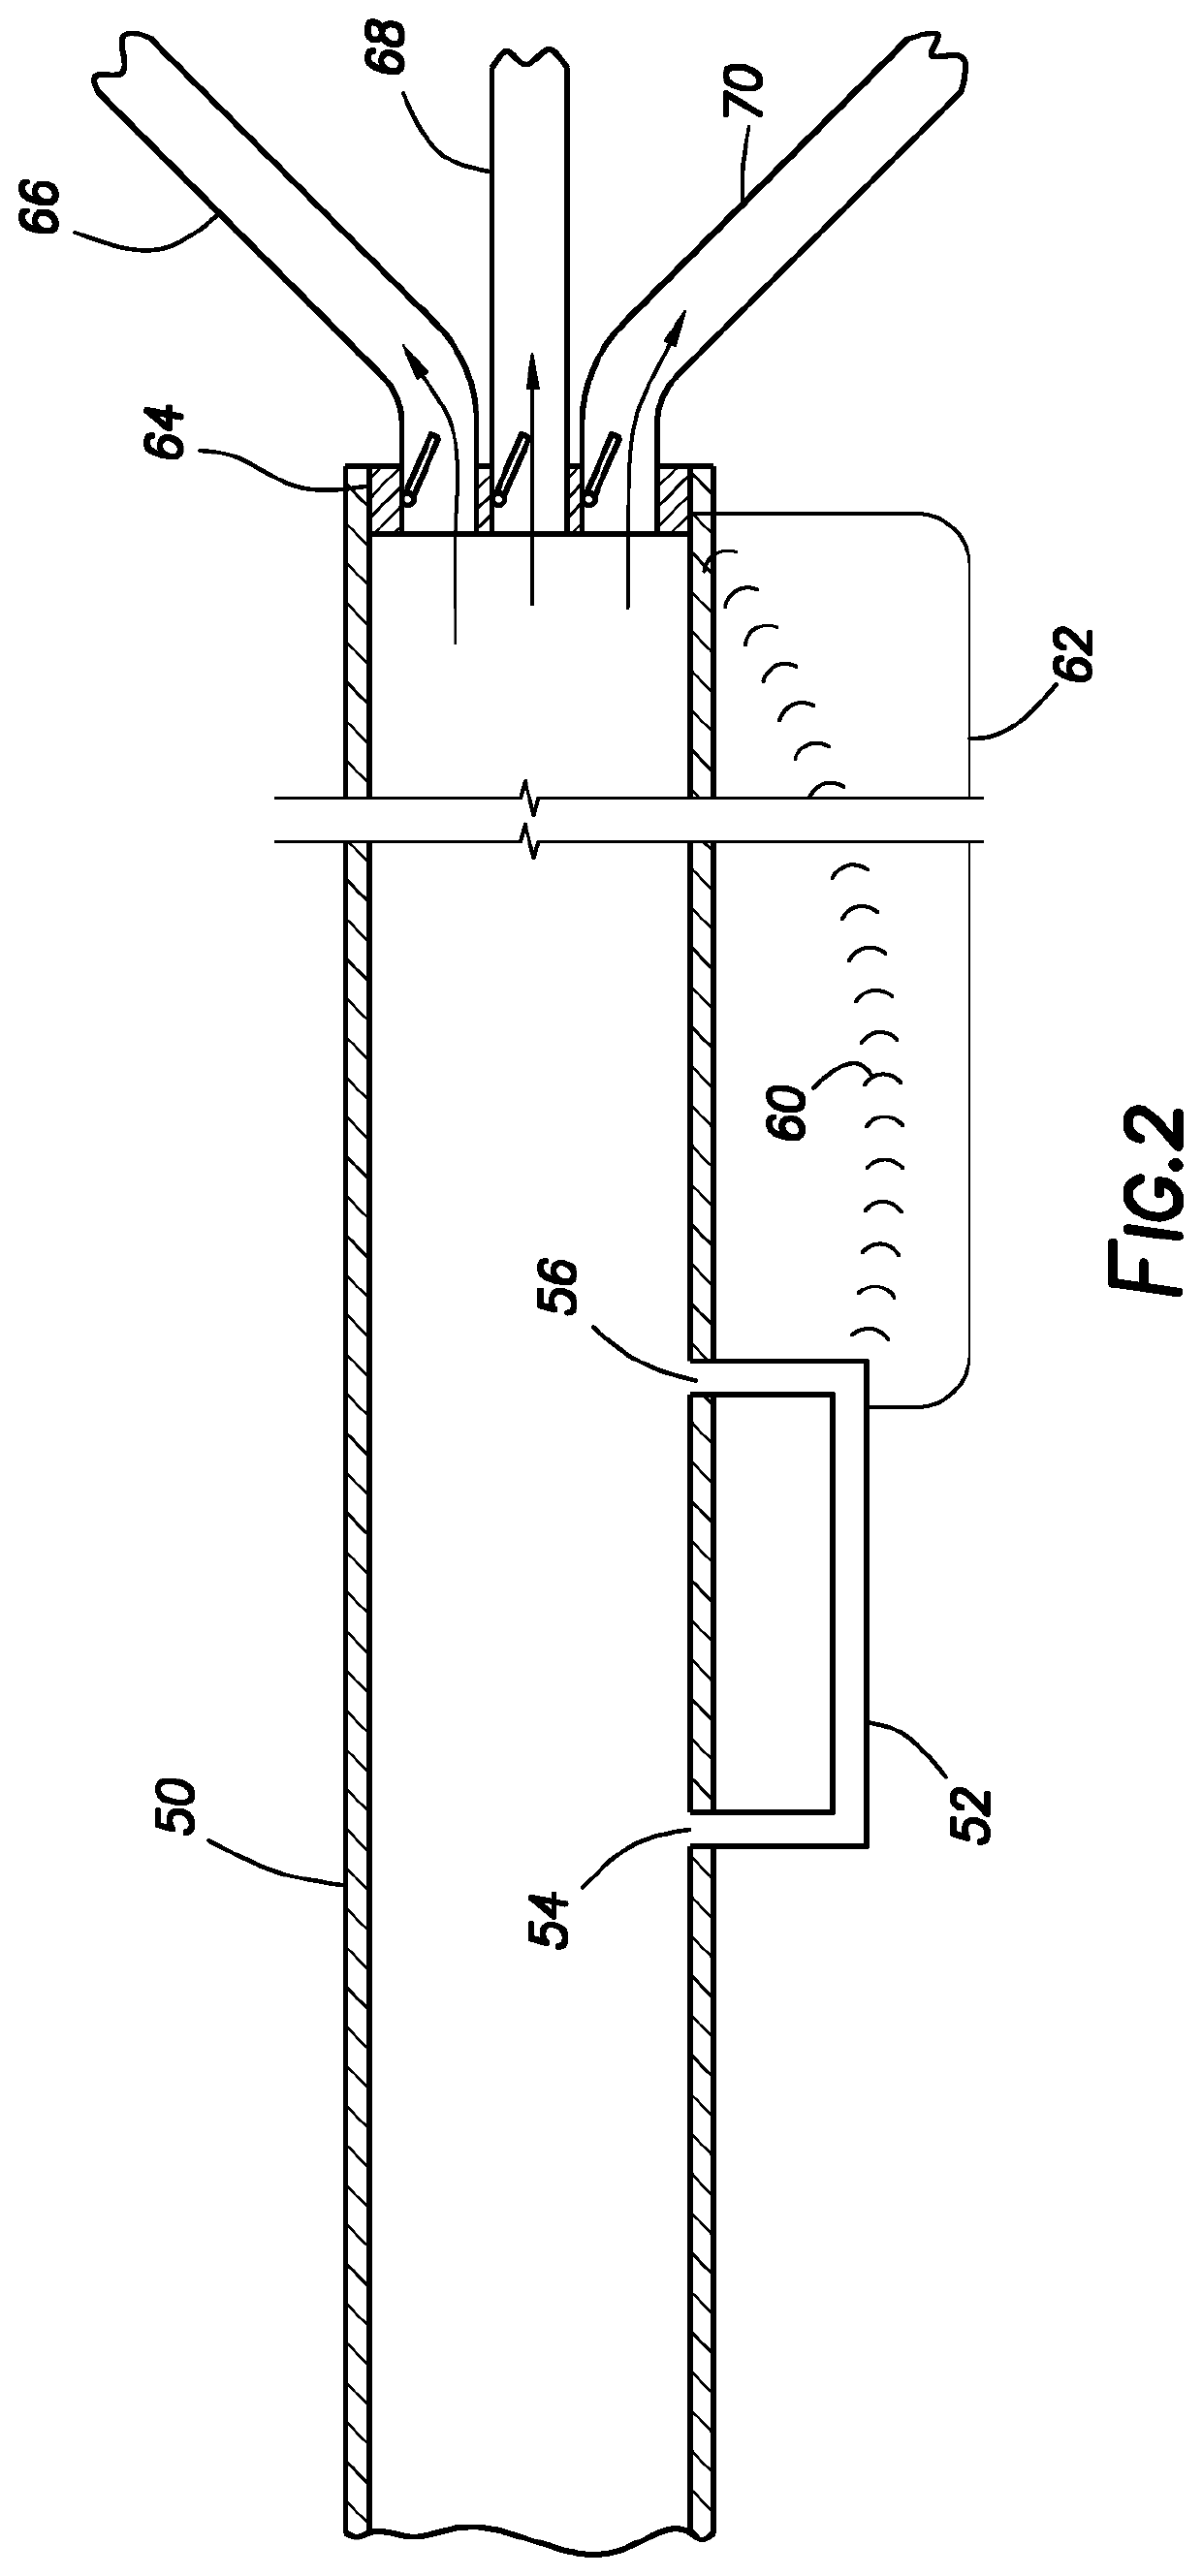
The patent describes a system where two different products flow through two different pipelines and are blended together using a pipeline interchange. The blended product is then flowed through a third pipeline and analyzed using an automated analyzer. The system also includes a data analyzer to interpret the data and make adjustments to the flow of the two products to achieve desired physical and chemical characteristics in the blended product. The technical effect of this system is the ability to create a blended product with precise physical and chemical characteristics by blending two different products and analyzing them using automated analyzers.

Problems solved by technology

This situation adds extreme complexity to refineries as they must manage all of the different types of crude to make a standardized refined petroleum product.
Unfortunately, due to all the different physical and chemical characteristics that are each unique to each of the crude products it is difficult to manage all of these different characteristics to product a standardized refined petroleum product.
Stopping a pipeline is expensive and not ideal.

Method used


Image

  • Pipeline interchange/transmix
  • Pipeline interchange/transmix
  • Pipeline interchange/transmix

Examples


example 1

[0137]As a first step toward training a genetic algorithm to distinguish those crude oils having the potential to foul refinery processes, 63 crude oils samples of distinct geologic origin were obtained and their fouling propensity was determined in a conventional manner using a conventional Hot Liquid Process Simulator (HPLS), prior to analyzing the samples by either near-infrared spectroscopy (NIR) or nuclear magnetic resonance spectroscopy (NMR). While an HPLS apparatus may be utilized to measure fouling thermal resistance of crude samples utilized with the present inventive processes, other conventional laboratory tests may also be utilized to measure fouling thermal resistance.

[0138]The general operational layout of a HPLS is diagramed in FIG. 16. The HPLS pumps a test liquid upward through an annular test section that contains a heated rod made of carbon steel. The heated rod is hollow, with an internally mounted control thermocouple, and the rod is electrically heated to main...

example 2

[0150]From the 63 samples comprising crude oil that were characterized for fouling characteristics in Example 1, approximately 30 aliquots comprising crude oil were chosen that were characterized as “non-fouling” (Group 1) according to the criteria described above, and approximately 30 samples were chosen that were characterized as “non-fouling” (Group 2). The samples were first analyzed by NIR to obtain spectral data comprising more than 1300 discrete digitized data points in the range from 4000 to 6000 cm−1. Measurements were carried out on an ABB Bomem FT-NIR spectrometer equipped with a deuterated triglycine sulfate (DTGS) detector. Samples were scanned in a fixed 0.5 mm cell with sapphire windows at a temperature of 90° F. (32.2° C.). The spectral resolution was 4 cm−1 and the number of sample scans and background scans was 32, respectively.

[0151]The Group 1 and Group 2 samples (described above) were also each analyzed by 1H nuclear magnetic resonance spectroscopy (NMR) to obta...

example 3

[0156]Certain embodiments utilize support vector machines rather than a genetic algorithm to recognize potential differentiating spectral features in wavelet coefficients data and classify samples comprising crude oil as either fouling or non-fouling. FIG. 18 graphically depicts the strong correlation between measured and predicted fouling potential for a variety of crude oil samples when using SVM to classify samples. The plots predicted fouling thermal resistance for a given sample (using support vector machines) versus the actual fouling thermal resistance of the aliquot measured using the HPLS method described in Example 1. The horizontal and vertical lines through the plotted area represent the threshold fouling thermal resistance that would classify a given sample as either non-fouling (Group A in figure) or fouling (Group B in the figure).

[0157]Wavelet coefficients data was first obtained from NIR spectral data (as described herein) for various training aliquots comprising ei...


PUM

PropertyMeasurementUnit
flash temperatureaaaaaaaaaa
boiling pointaaaaaaaaaa

Abstract

In one embodiment, a pipeline interchange is described where a first product flows through a first pipeline and a second product flows through a second pipeline. In this embodiment, a first product automated analyzer is situated near the first pipeline to physical and / or chemically analyze the first product and generate first product data. Additionally, in this embodiment, a second product automated analyzer is situated near the second pipeline to physical and / or chemically analyze the second product and generate second product data. A pipeline interchange is connected downstream to both the first pipeline and the second pipeline, wherein the pipeline interchange blends the first product flowing through the first pipeline with the second product flowing through the second pipeline. A third pipeline is connected downstream to the pipeline interchange, wherein the third pipeline flows a blended product created from the blending of the first product and the second product in the pipeline interchange. A data analyzer is also positioned to interpret the first product data and the second product data and communicate adjustments to the flow of both the first product and the second product to achieve desired physical and / or chemical characteristics in the blended product.

Description

CROSS-REFERENCE TO RELATED APPLICATIONS[0001]This application is a continuation-in-part application which claims the benefit of and priority to U.S. patent application Ser. No. 16 / 391,817 filed Apr. 23, 2019 entitled “Pipeline Interchange” and Continuation-in-Part Patent application Ser. No. 16 / 557,315 filed Aug. 30, 2019 entitled “Pipeline Interchange / Transmix,” both of which are hereby incorporated by reference in their entirety.STATEMENT REGARDING FEDERALLY SPONSORED RESEARCH OR DEVELOPMENT[0002]None.FIELD OF THE INVENTION[0003]This invention relates to a pipeline interchange / transmix.BACKGROUND OF THE INVENTION[0004]Pipelines often transport physically and chemically different types of petroleum product in the same pipeline. In some pipeline systems the different types of petroleum products get blended together to achieve an optimal final petroleum product. For example, different pipelines might bring in different types of crude oil to be processed in a refinery and a refinery m...

Claims


Application Information

Patent Timeline
Patent Type & Authority Applications(United States)
IPC IPC(8): F17D3/01F17D1/08F17D3/05G05D7/06G01N33/28
CPCF17D3/01F17D1/08G01N33/2829G05D7/0652F17D3/05F17D3/03G05D11/132Y10T137/2509G01J3/44G05D11/139G05B2219/37371G01J3/42
Inventor RADY, PAULPURIFICATO, MARISAUBA, FRANKLINFASASI, AYUBA
Owner PHILLIPS 66 CO
Learn More