

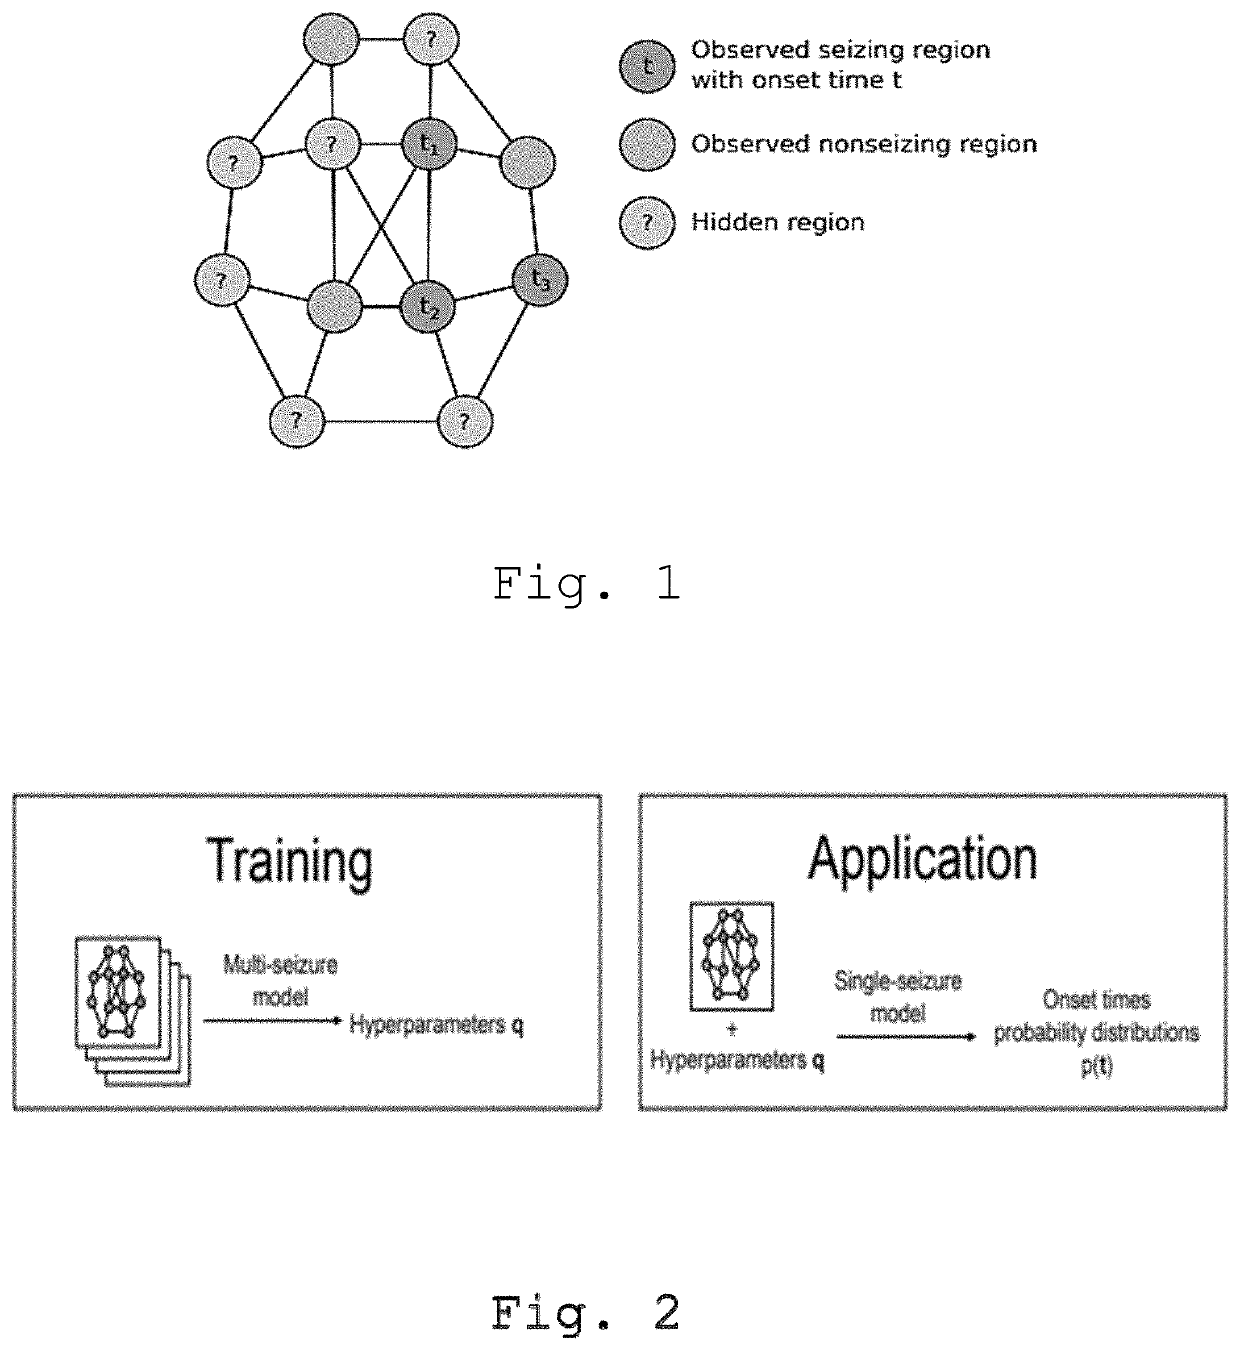
Method for determining an onset time and an excitability of a brain region
a brain region and excitability technology, applied in the field of brain region excitability and onset time, can solve the problems of low success rate in surgical operations, low success rate of surgical interventions, and none of these methods allows for the exploration of the whole brain
- Summary
- Abstract
- Description
- Claims
- Application Information
AI Technical Summary
Benefits of technology
Problems solved by technology
Method used
Image

Examples
example 1
ATA
[0078]For the purposes of testing, synthetic data are generated by the same model as used for the inference. We have used connectome matrices from ten subjects are used, using the
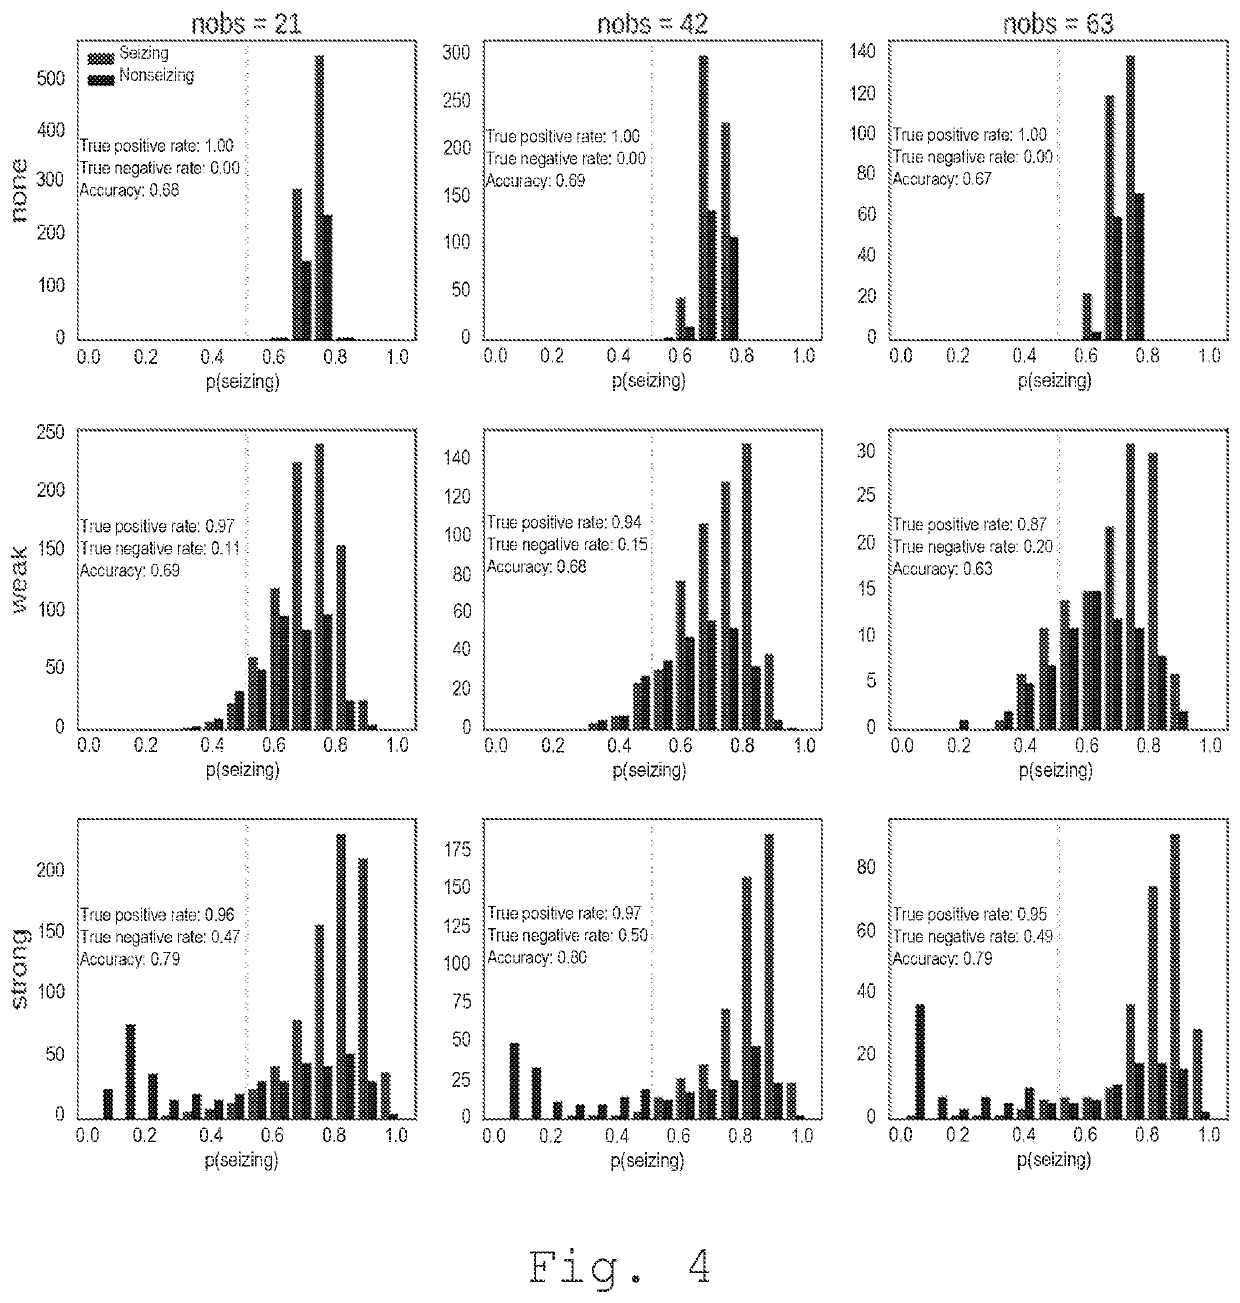
[0079]Desikan-Killiany parcellation, with 84 nodes. From these ten connectomes, two groups of ten seizures are generated, all of them with three different parameter set of the activation function: one for no coupling (q=(−5.0, −5.0, −3.0, −3.0)), one for weak coupling (q=(−6.5, −3.0, −3.5, 12.0)), and one for strong coupling (q=(−11.2, 5.3, −6.2, 69.3)). Finally, the number of observed regions are set to 21, 42, and 63 out of 84 regions in the parcellation. In total, this gives (2 groups)×(3 coupling strengths)×(3 numbers of observed regions)=18 groups, each with 10 seizures. For all cases, the excitabilities c are randomly drawn from standard normal distribution, and the observed nodes are selected randomly. The inference is run separately on each of the 18 groups.
example 2
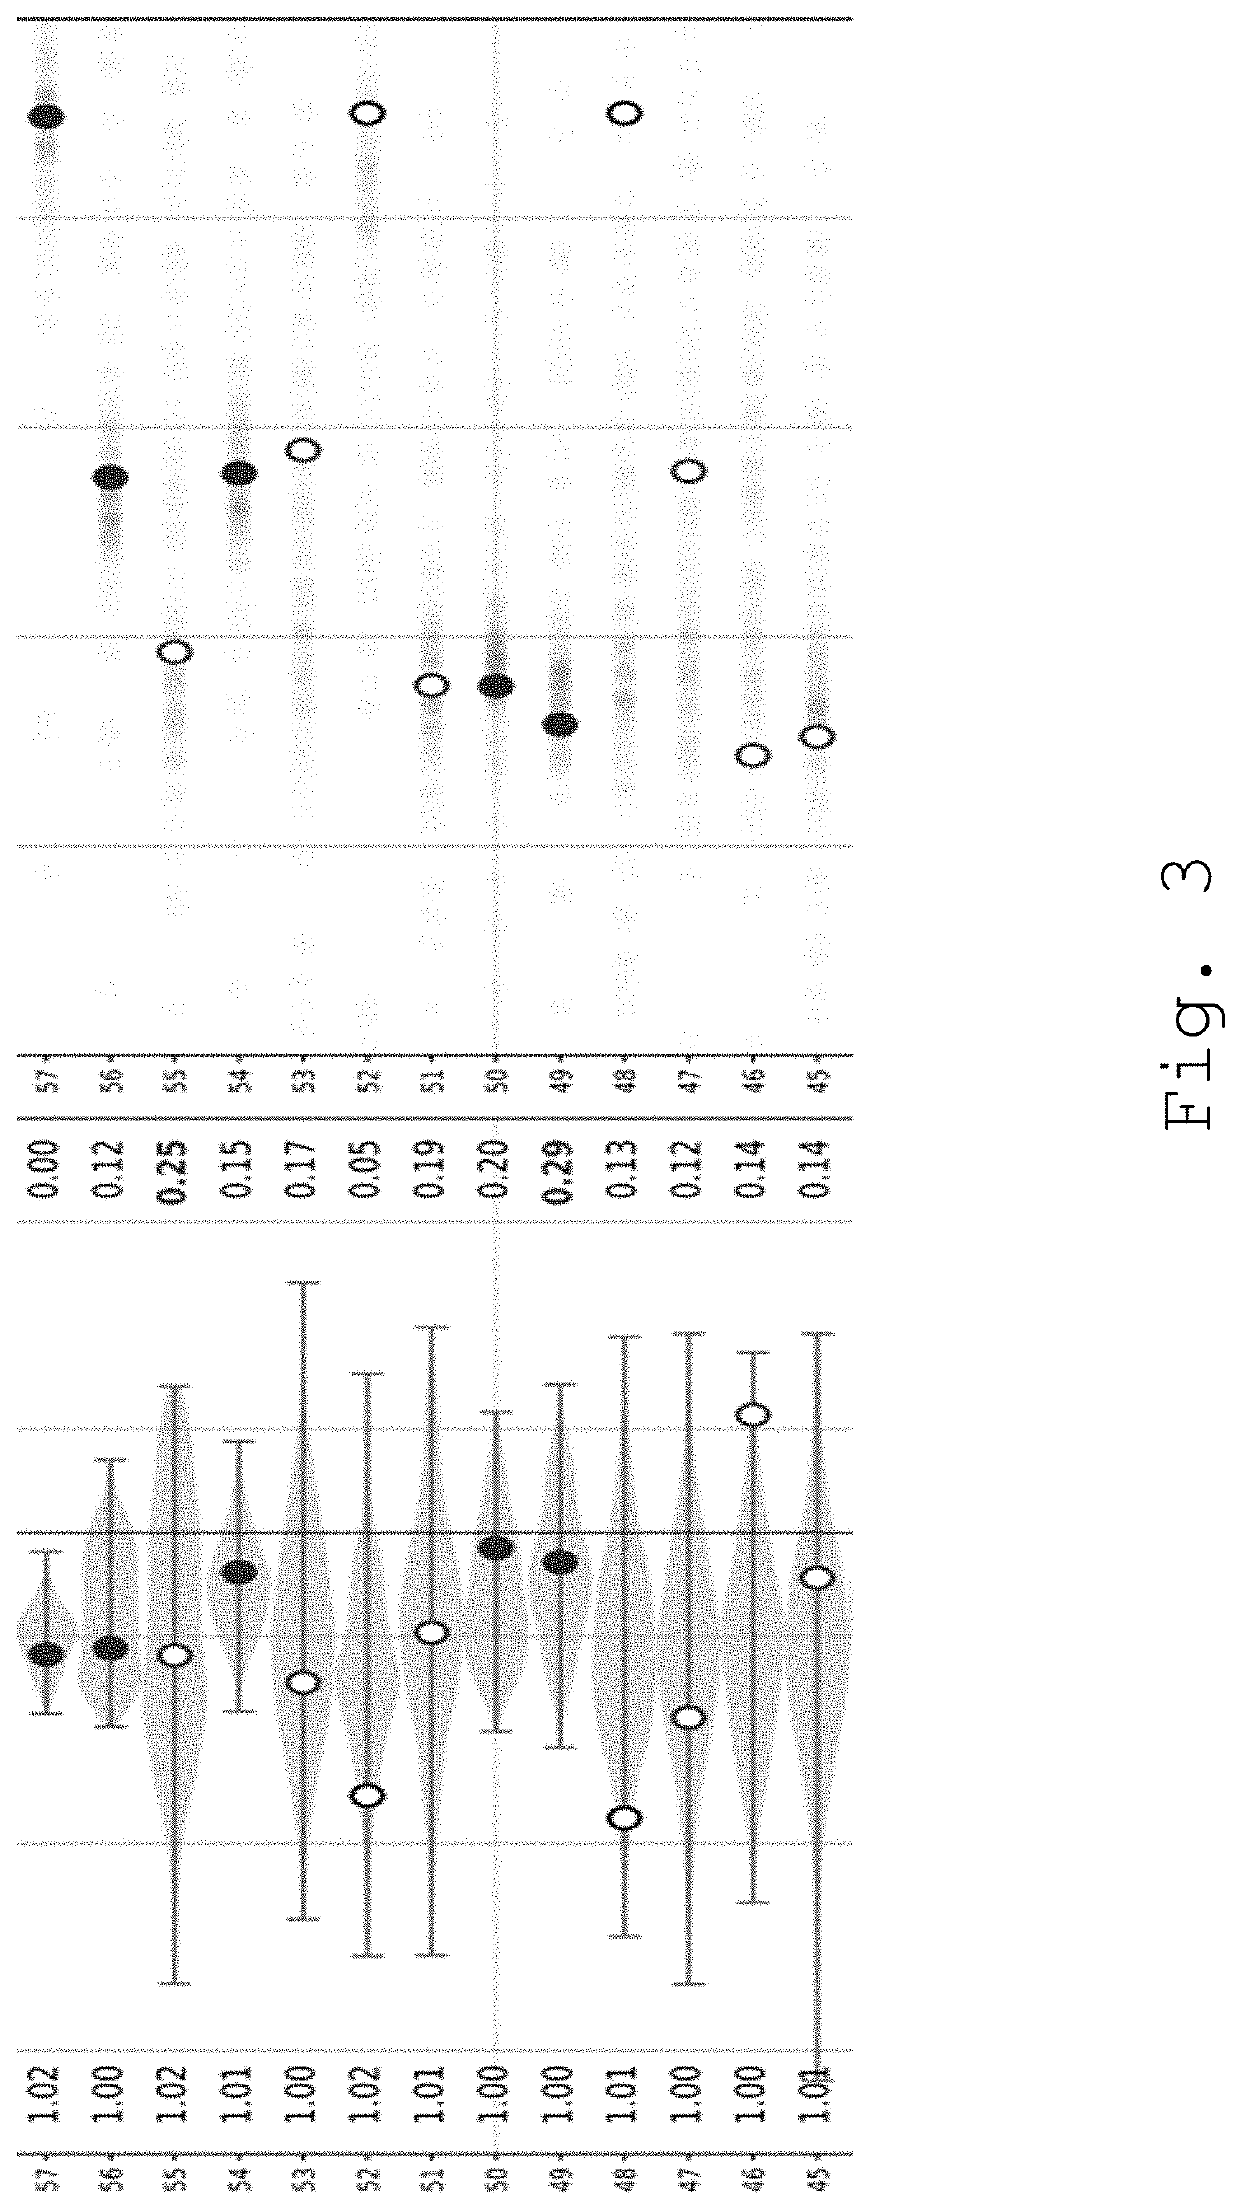
[0080]Exemplary results of the inference for a single seizure are partially shown on FIG. 3, while the cumulative results from all tests are represented on FIGS. 4, 5, 6A, 6B, 6C, 7A, 7B and 7C.
[0081]In FIG. 3, an example of the inference results is partially shown for a single seizure with strong coupling and 21 observed regions. Left partial panel show the true (dots) and inferred (plots) excitabilities of the 84 brain regions. Full dots mark the observed regions, while empty-faced dots mark the regions that are hidden. Light-grey regions are those that seize, while dark-grey are those that do not. Numbers in the left column are the {circumflex over (R)} diagnostic values. Numbers in the right column is the inferred probability p(c>1) which is equated with the probability that the node is epileptogenic. Right panel show the true (light-grey / dark grey dots) and inferred (grey dots) region onset times. Same rules for the full / empty and light grey / dark-grey dots apply as for the left...
PUM
 Abstract
Description
Claims
Application Information