Method for calibrating spectrophotometric apparatus with synthetic fluids to measure plasma and serum analytes

a spectrophotometric and synthetic fluid technology, applied in the direction of liquid/fluent solid measurement, instruments, chemical methods analysis, etc., can solve the problems of cumbersome time-intensive exercise, compromise specimen integrity, and the life of the apparatus can amount to a considerable amount of time and cos

Inactive Publication Date: 2002-10-22
TYCO HEALTHCARE GRP LP
View PDF12 Cites 65 Cited by
  • Summary
  • Abstract
  • Description
  • Claims
  • Application Information

AI Technical Summary

Benefits of technology

According to yet another embodiment, the method comprises conducting a Primary Calibration of a First Apparatus and using a quality control fluid to confirm the First Apparatus is functioning wherein the quality control fluid, or calibrator, is contained in a sample container. Next, two or more calibrators, called a "calibration set", are submitted to the First Apparatus and the absorbance for each of the calibrators is measured on the First Apparatus. These absorbance measurements are stored and provide "calibration absorbance measurements" from the First Apparatus for a calibration set. Also stored are the calibration algorithms from the First Apparatus. Preferably the calibration absorbance measurements and calibration algorithms from the First Apparatus is stored electronically, most preferably on a computer diskette. The calibration algorithms from the First Apparatus are installed in a Second Apparatus, preferably before the Second Apparatus is used. Using similar calibrators from the same batch, i.e., with identical lot number or batch number, which were measured on the First Apparatus and the same "standard set of wavelengths", the absorptions of the calibrators are measured on the Second Apparatus to generate a second set of measurements. These absorbance measurements from the Second Apparatus are also stored with the absorbance measurements from the First Apparatus. Next a first linear regression plot is prepared using the absorbances measured from each of the First and Second Apparatus for each wavelength. Measurements from the First Apparatus are plotted on one axis and measurements from the Second Apparatus are plotted on the second axis; preferably measurements from the First Instrument are plotted on the x-axis. The slope and intercept of this first linear regression plot are stored in the Second Apparatus. Using this stored regression data, the absorbances of actual samples which are measured on the Second Apparatus are adjusted using the stored regression plot for each wavelength. Accordingly, the measurement made in respect of the sample once adjusted, provides a result comparable to that which would be obtained if the sample had been measured on the First Apparatus. In this way, the Second Apparatus need not be calibrated through a Primary Calibration as was done for the First Apparatus.

Problems solved by technology

The presence of such interferents affects the ability to perform tests on the serum or plasma and as such can be said to compromise specimen integrity.
Unlike many blood analytical apparatus, calibration of spectrophotometric apparatus used to measure quantity of one or more analytes or interferents in a serum or plasma specimen is a cumbersome time intensive exercise (Primary Calibration).
Each apparatus used for the purposes of determining the concentration of interferents must be calibrated according to this process and over the lifetime of an apparatus can amount to a considerable amount of time and cost.
The major disadvantage with this method is that the calibrators need to be carefully designed to produce absorbance spectra that closely resemble the absorbance spectra of serum containing mixed or multiple interferents in the spectral section of the wavelengths used in the calibration algorithm.
Also, such methods are only suitable when the calibration algorithms use a small number of wavelengths.

Method used


Image

  • Method for calibrating spectrophotometric apparatus with synthetic fluids to measure plasma and serum analytes
  • Method for calibrating spectrophotometric apparatus with synthetic fluids to measure plasma and serum analytes
  • Method for calibrating spectrophotometric apparatus with synthetic fluids to measure plasma and serum analytes

Examples


examples

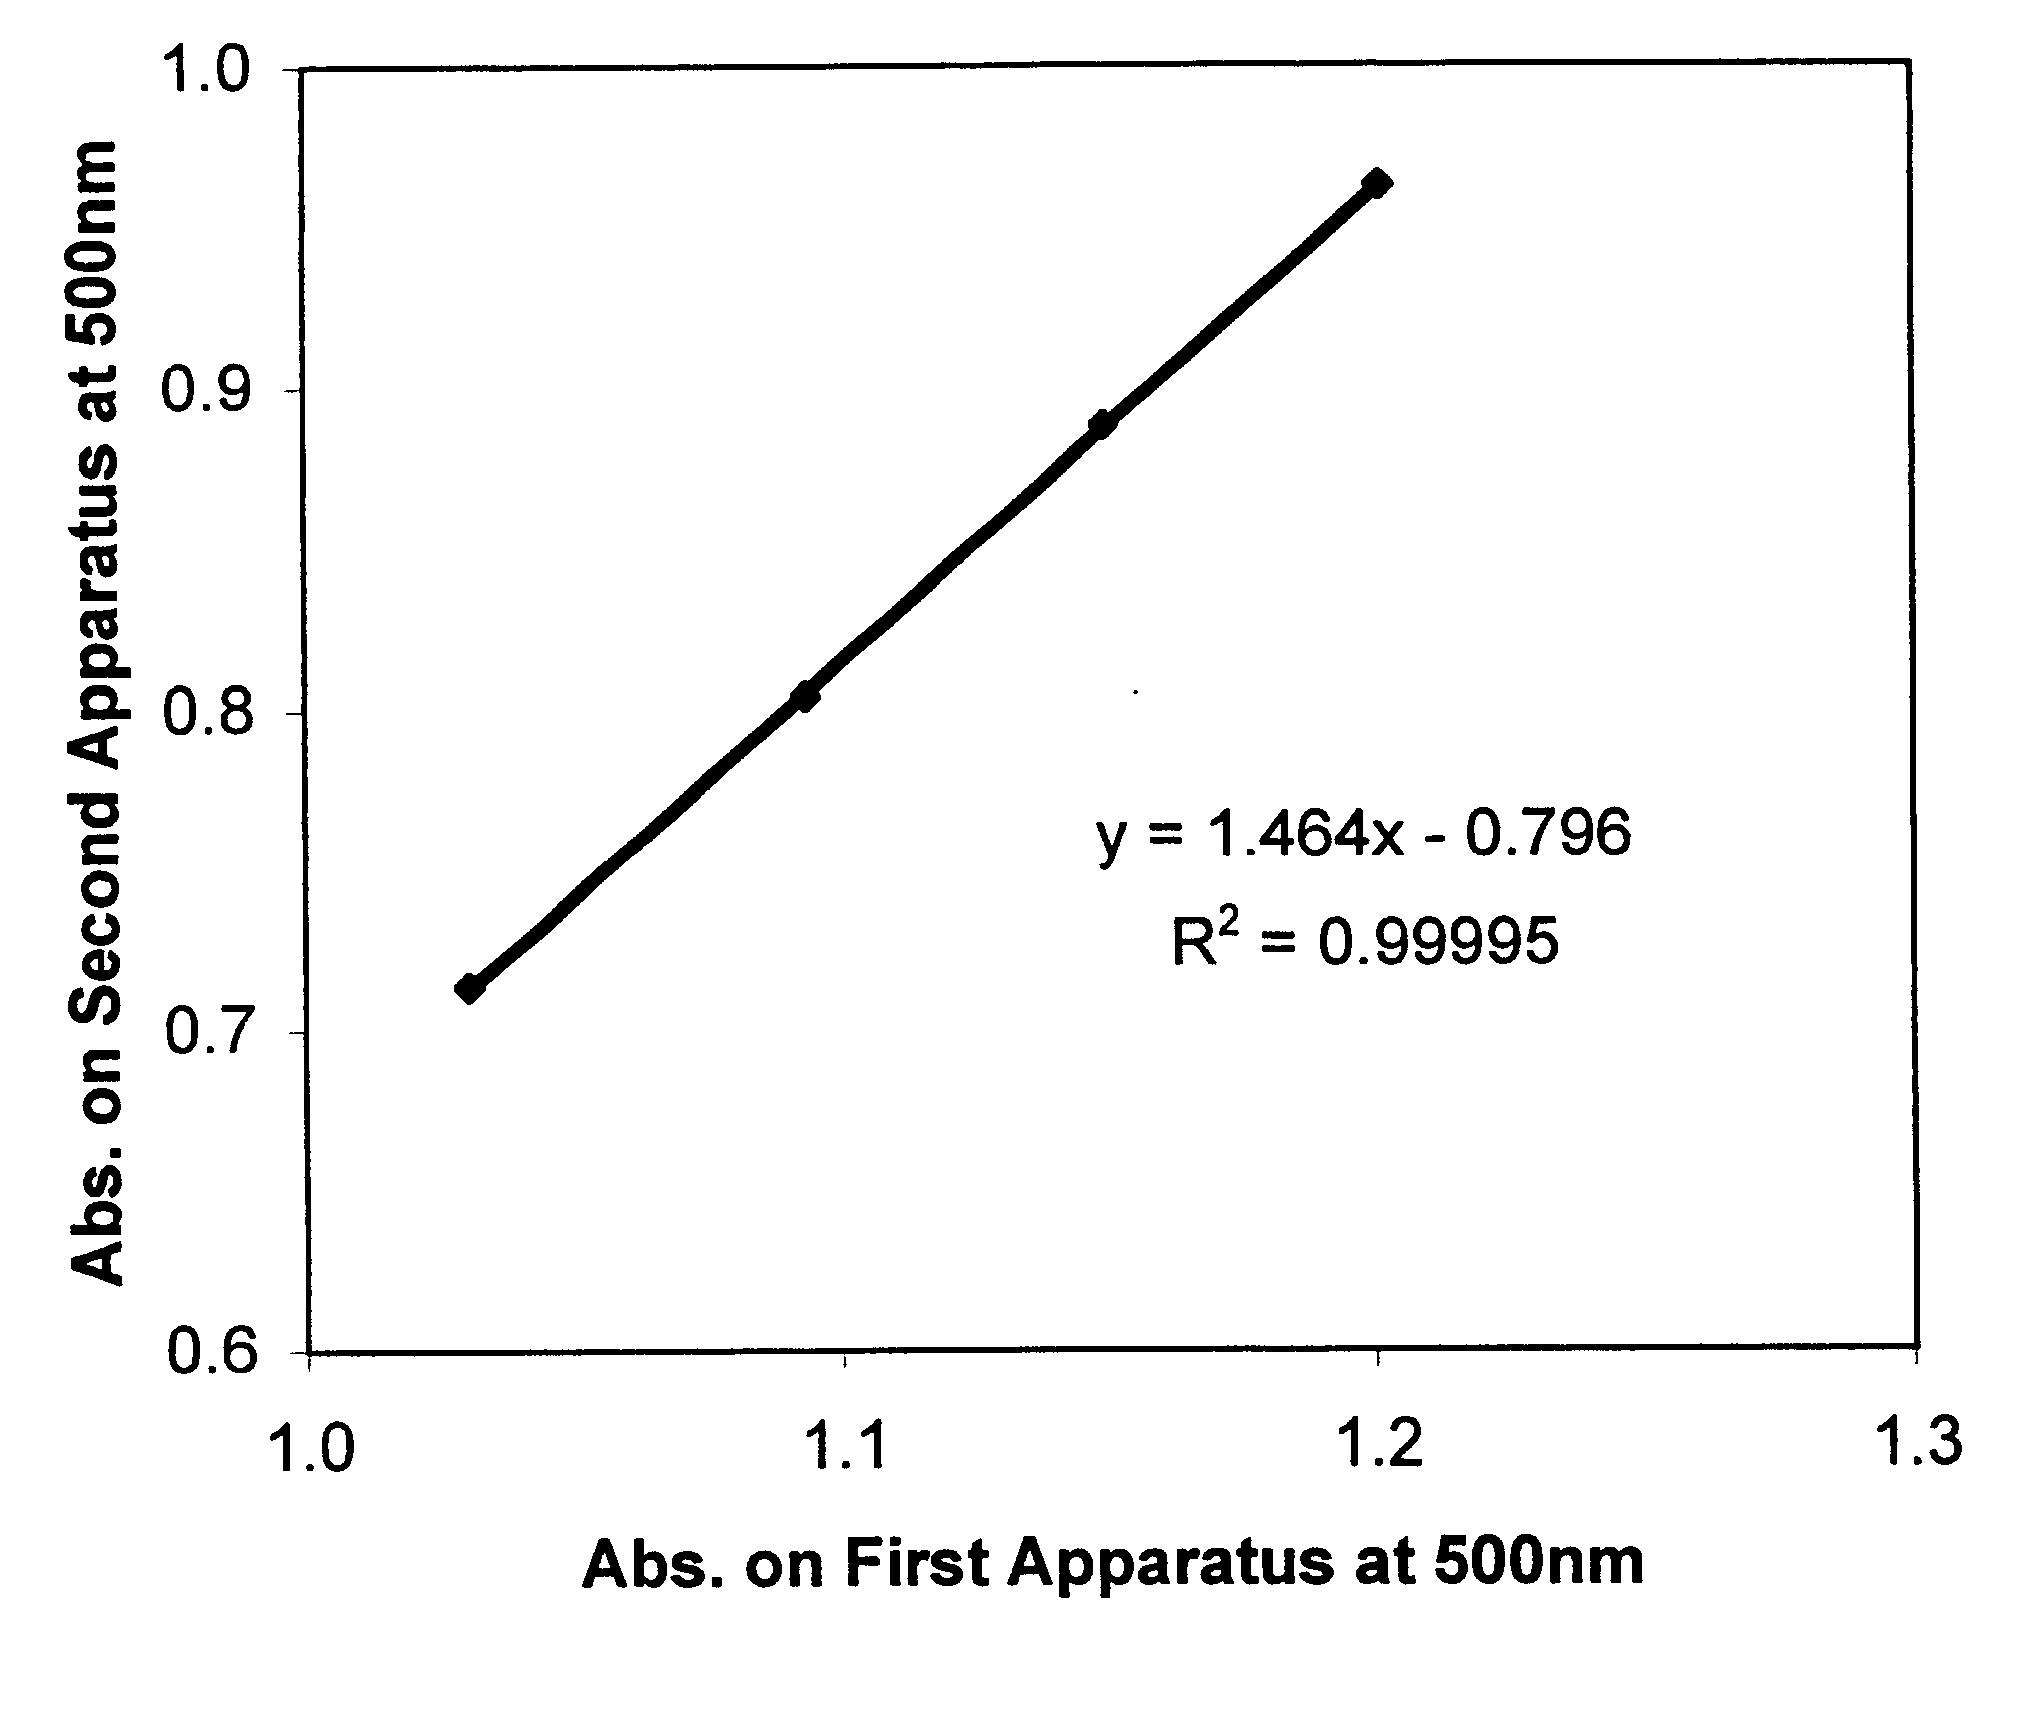
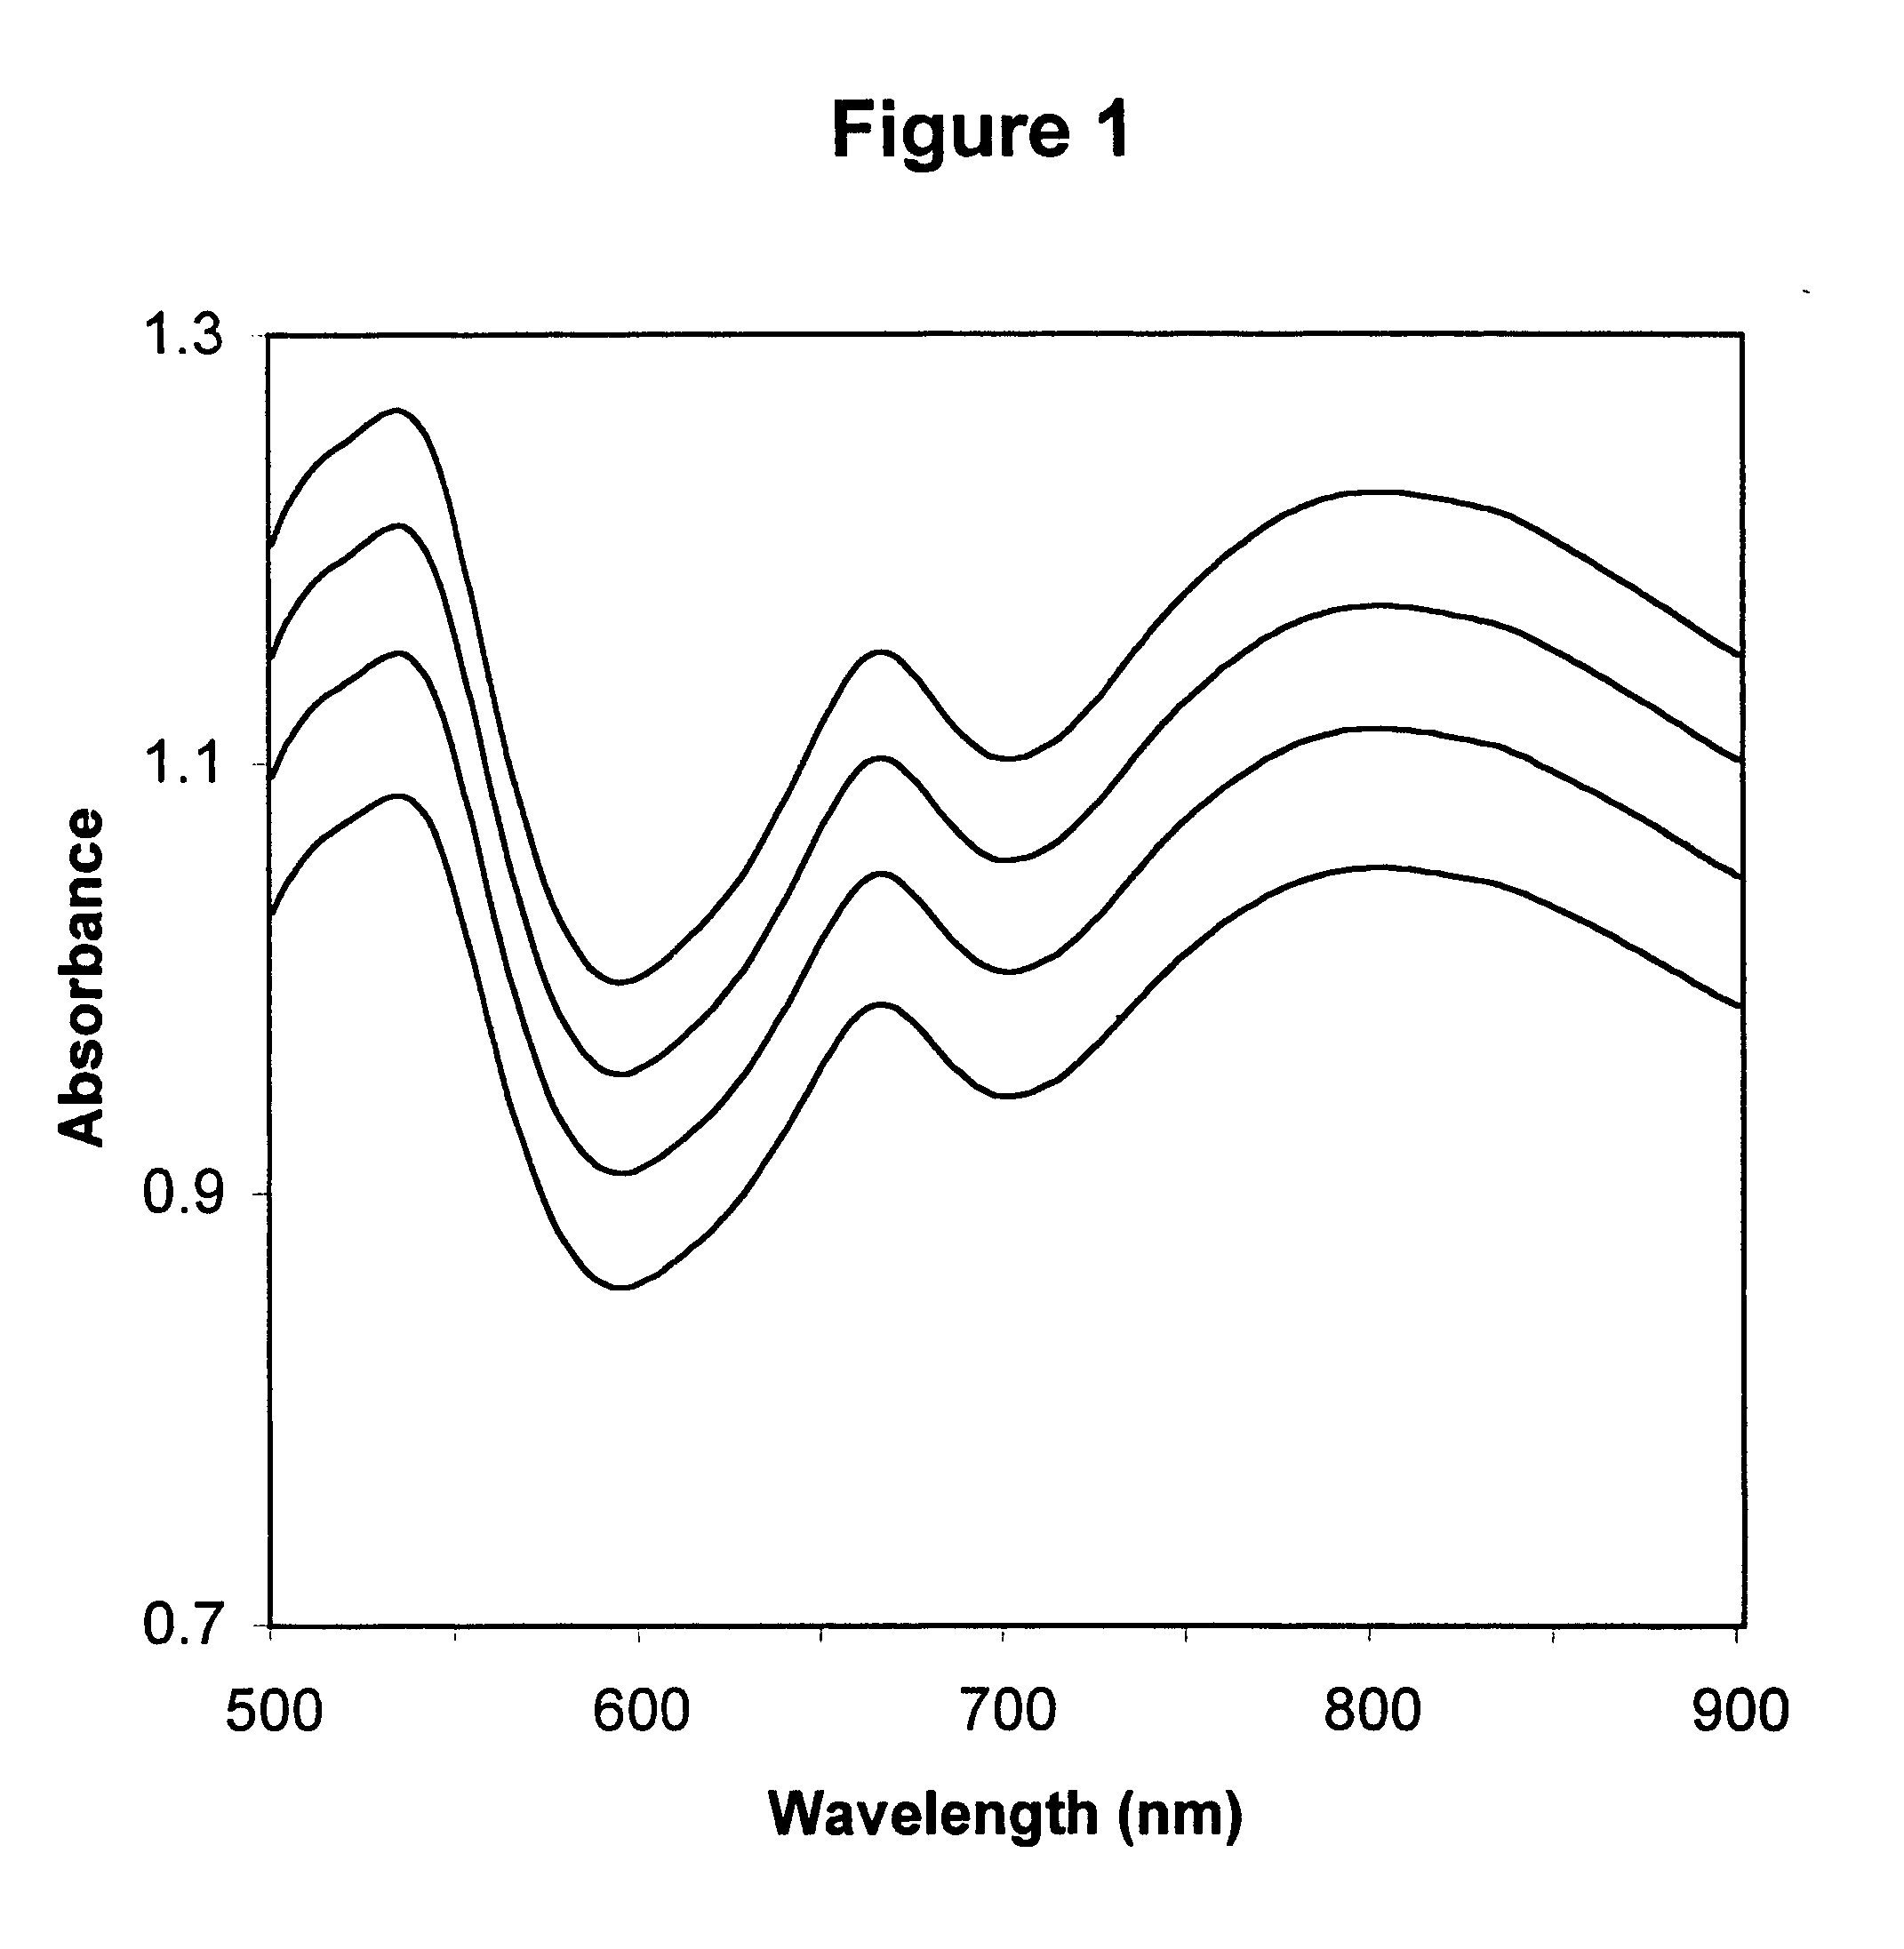
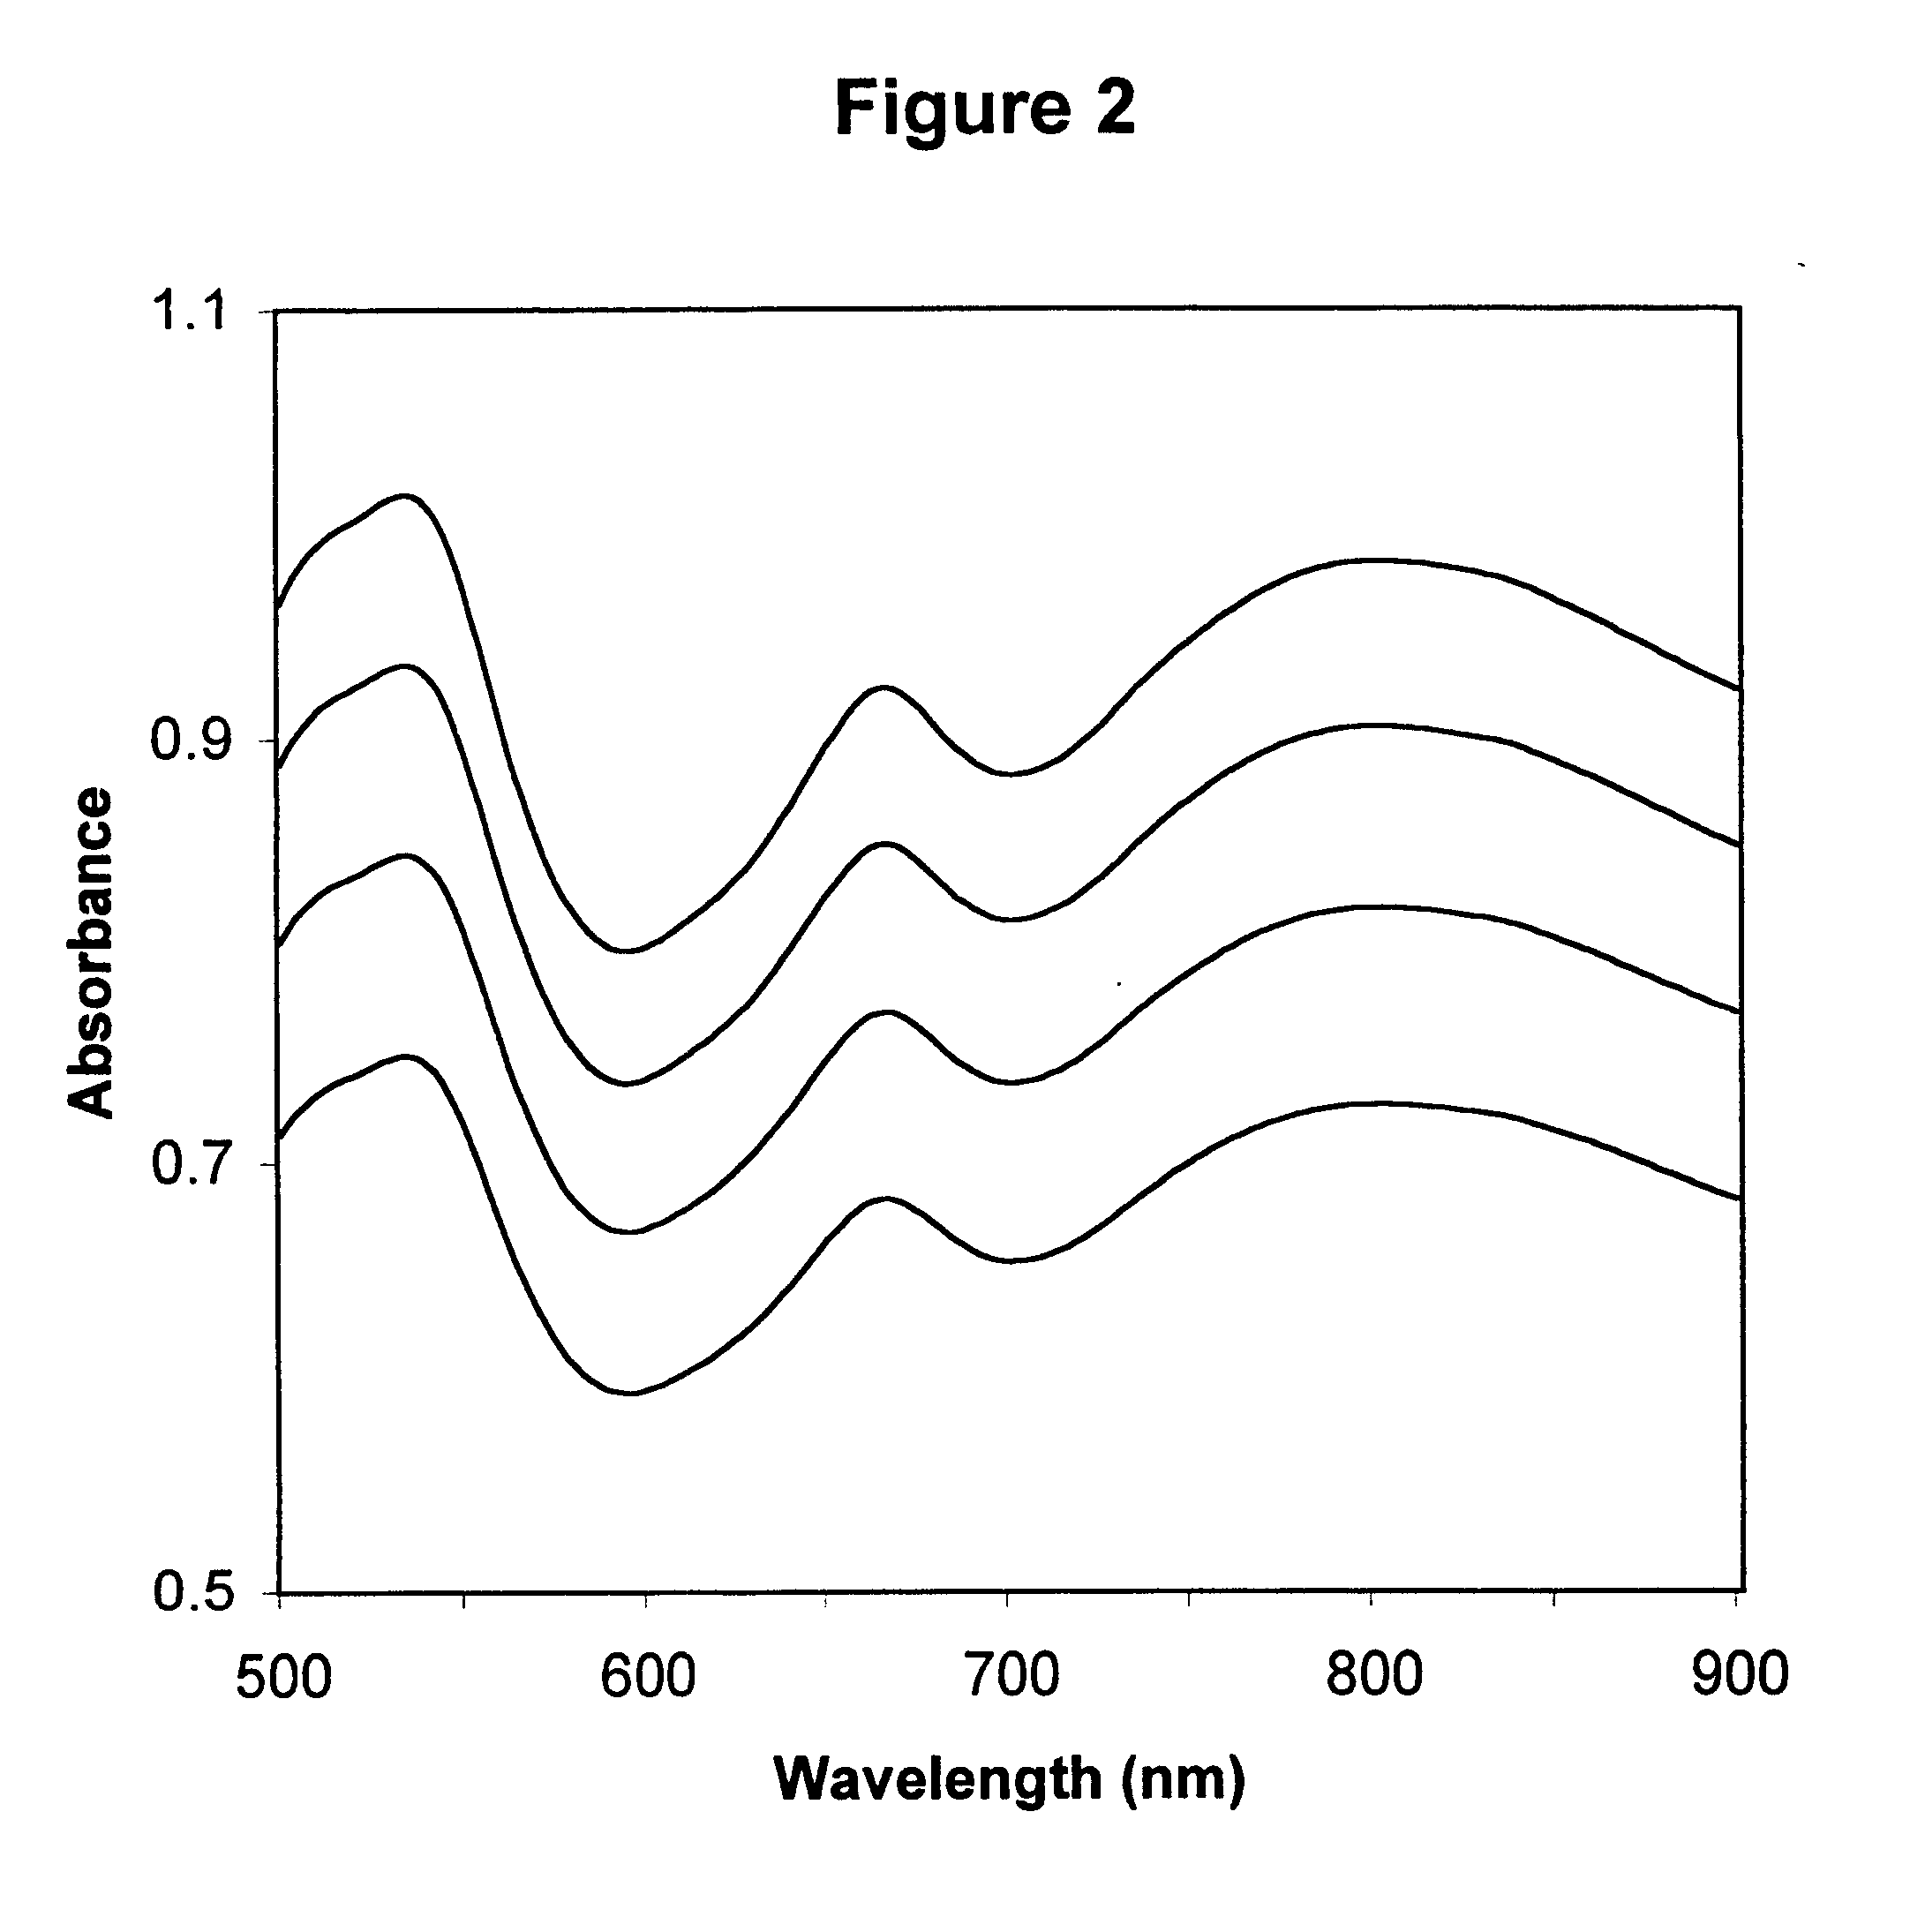
The absorbance spectra of four calibrators when tested on a "First Apparatus" are shown in FIG. 1; the absorbance spectra obtained from a "Second Apparatus" are shown in FIG. 2. The linear regression plots and equations for 500 nm, 550 nm, 600 nm, 650 nm, 700 nm and 750 nm are shown in FIGS. 3, 4, 5, 6, 7, and 8 respectively. Table 1 shows the y-intercepts and slopes for the wavelengths chosen as examples.

The slopes are very similar for the wavelength example shown in Table 1, but there are more significant differences for the y-intercepts. Theses numbers are very different from apparatus to apparatus. The large R.sup.2 values (very close to 1) indicates the high correlation between the absorbances of the two apparatuses, and hence the reliability of the absorbance (or photometric) corrections--which is the basis for the recalibration process.

The y-intercepts and slopes in Table 1 were derived from the linear regression plots of absorbances for the calibrators obtained on the First ...


PUM

PropertyMeasurementUnit
concentrationaaaaaaaaaa
concentrationsaaaaaaaaaa
wavelength rangeaaaaaaaaaa

Abstract

Described is a method for calibrating a spectrophotometric apparatus which is used to measure analytes in plasma and/or serum samples based on the calibration of a First Apparatus, and for recalibrating such apparatus, including recalibration of the First Apparatus all using synthetic calibrators. These apparatus use absorption of radiation to measure analytes in serum or plasma samples. The method described includes using synthetic calibrators which are submitted to the First Apparatus for measurement and compared with measurements of similar calibrators in a Second Apparatus and using the comparison to derive concentrations of analytes in samples measured on the Second Apparatus. As an alternative to making all apparatus identical, in terms of wavelength calibration, the absorbances of all apparatus should be mapped onto a standard set of wavelengths.

Description

This invention is in the field of spectrophotometric determinations of concentrations of substances in solution and relates to methods of calibration of apparatus used to measure quantity of one or more analytes or interferents in a serum or plasma specimen, using synthetic fluids.BACKGROUND OF INVENTIONClinical laboratory tests are routinely performed on serum or plasma of whole blood. In a routine assay, red blood cells are separated from plasma by centrifugation, or red blood cells and various plasma proteins are separated from serum by clotting prior to centrifugation. Hemoglobin (Hb), light-scattering substances like lipid particles, and bile pigments bilirubin (BR) and biliverdin (BV) are typical substances which will interfere with and affect spectrophotometric and other blood analytical measurements. Such substances are referred to as interferents, and they can be measured spectrophotometrically. The presence of such interferents affects the ability to perform tests on the s...

Claims


Application Information

Patent Timeline
Patent Type & Authority Patents(United States)
IPC IPC(8): G01N21/47G01N21/27G01N21/25
CPCG01N21/274G01N21/4785
Inventor SAMSOONDAR, JAMES
Owner TYCO HEALTHCARE GRP LP
Why Eureka
Try Eureka