
Method and apparatus for interferometry, spectral analysis, and three-dimensional holographic imaging of hydrocarbon accumulations and buried objects

a technology of holographic imaging and interferometry, applied in the field of interferometry apparatus and analysis, can solve the problems of limited frequency division and isolation used in spectral decomposition and analysis of received signals, the inability to measure phase velocity of signals, and the common drawback of containing only a single broadband signal

Inactive Publication Date: 2005-08-30
SANSONE STANLEY A
View PDF36 Cites 45 Cited by
  • Summary
  • Abstract
  • Description
  • Claims
  • Application Information

AI Technical Summary

Benefits of technology

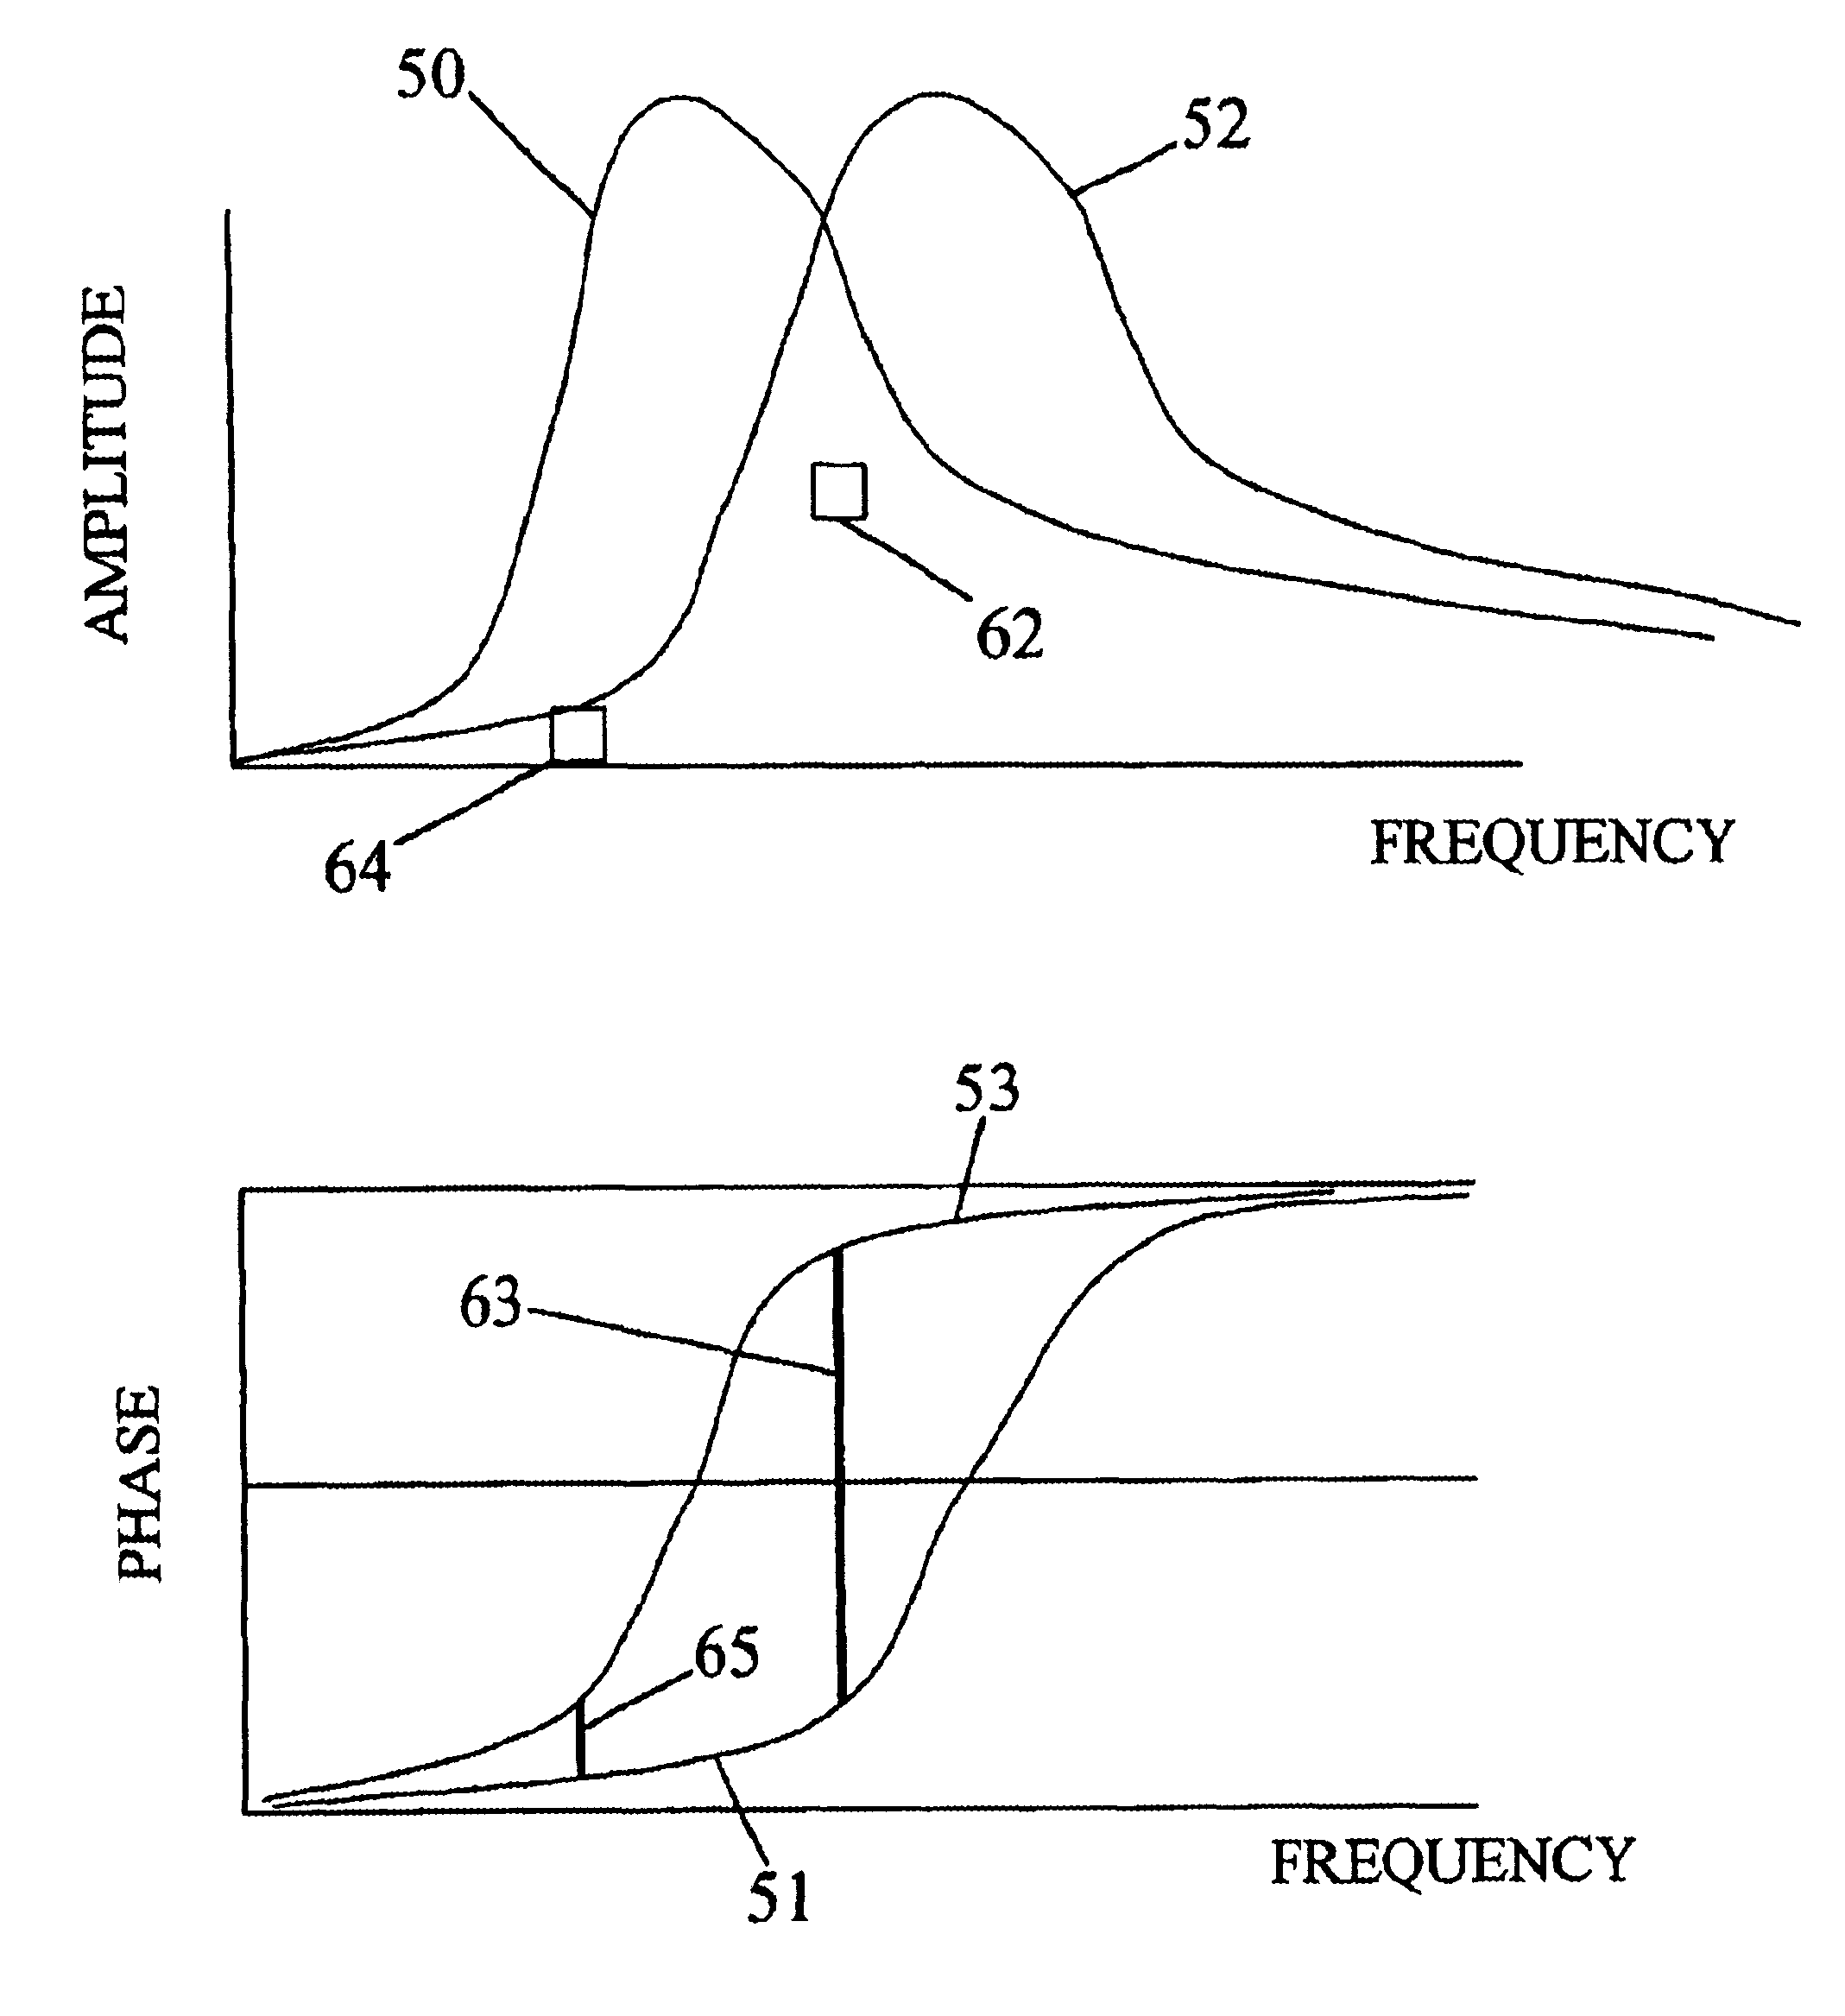
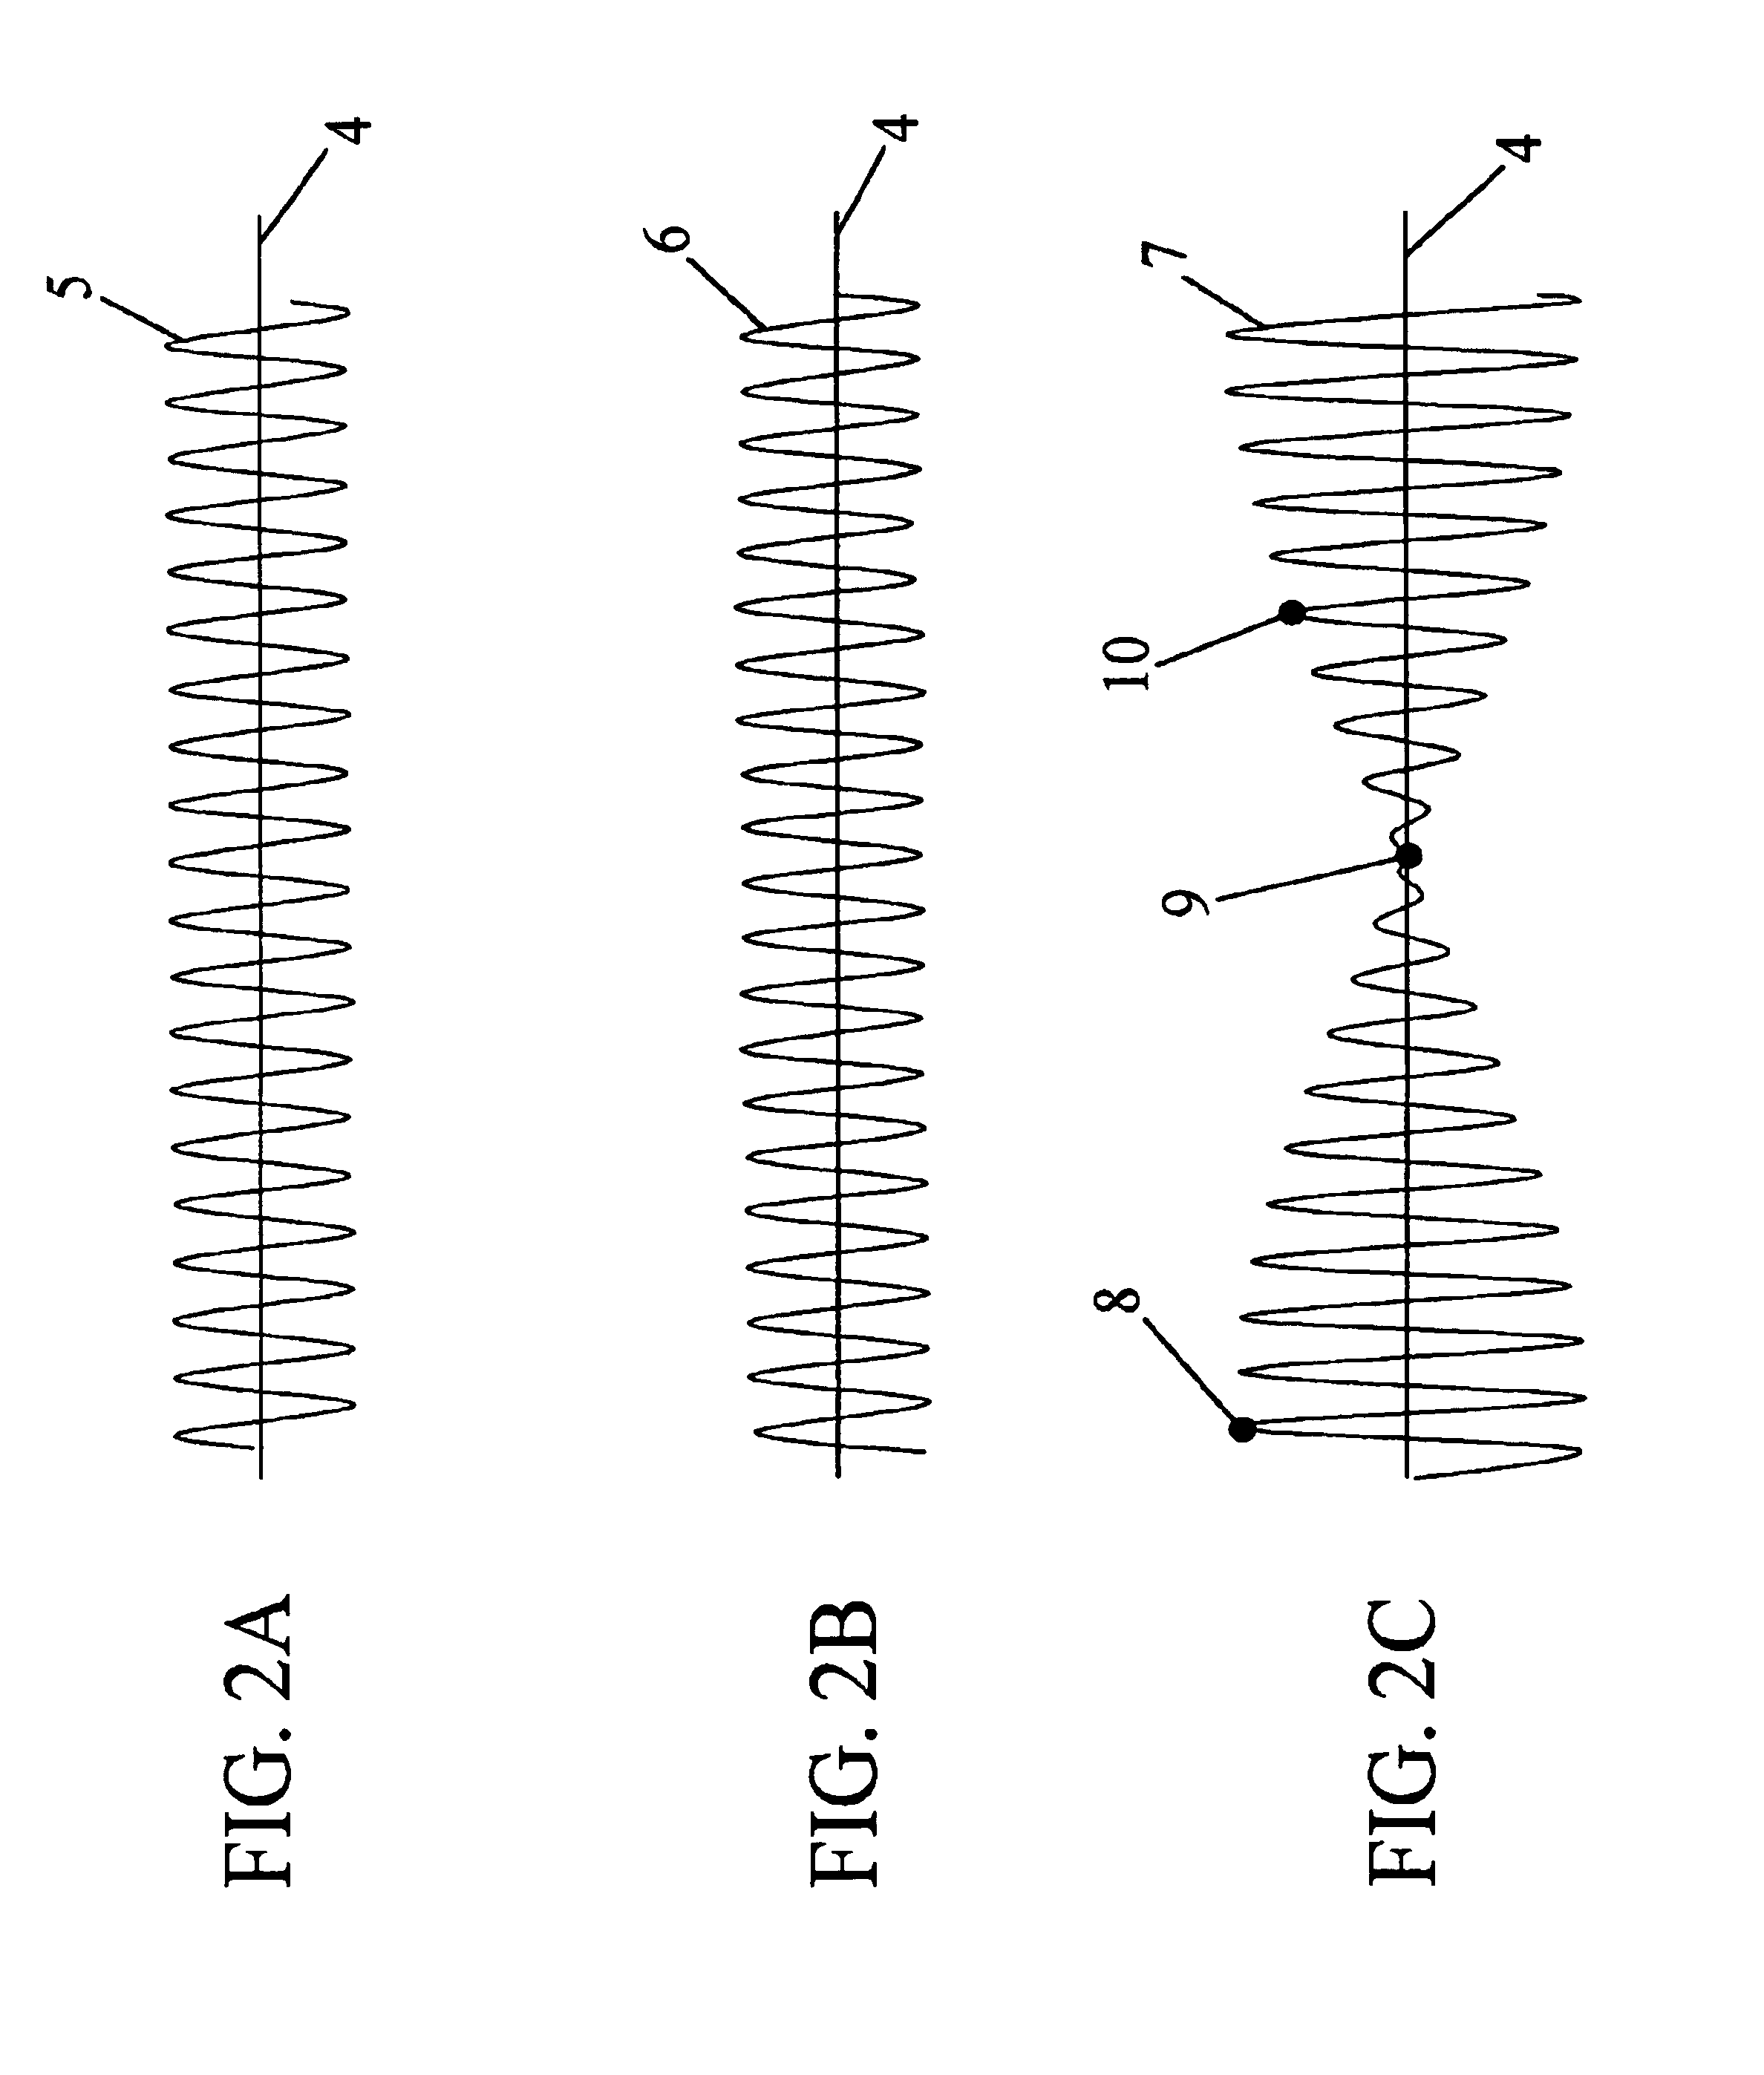
[0005]The present invention relates to a method and apparatus for the detection and exploration of buried objects and hydrocarbons employing at least two separate signals combined to form interferometric analysis and imaging of non-optical waves. These imaging systems include seismic, sonar, and radar imaging systems. The technique of measuring and analyzing absorption and other elastic moduli are shown from a three-dimensional analysis of interferometric information. The technique of interferometric holography also uses the unique characteristic record of frequency, phase, and amplitude of more than one signal. This type of analysis facilitates the estimation of elastic properties of earth material.
[0017]It would be further advantageous to provide, in accordance with the present invention, a method of analysis for diagnosing spectral absorption.

Problems solved by technology

These signals commonly suffer the drawback of containing only a single broadband signal.
Unfortunately, frequency division and isolation used in spectral decomposition and analysis of received signals, as described in U.S. Pat. Nos. 5,414,674 and 6,131,071, are limited.
Such signals cannot measure phase velocity.
Unfortunately, many large and deeper hydrocarbons go undetected.
Such sensors are inexact, tedious, and uneconomic to deploy or interconnect, and attempts to measure dispersion and anisotropic characteristics of earth materials have not been reliable.

Method used


Image

  • Method and apparatus for interferometry, spectral analysis, and three-dimensional holographic imaging of hydrocarbon accumulations and buried objects
  • Method and apparatus for interferometry, spectral analysis, and three-dimensional holographic imaging of hydrocarbon accumulations and buried objects
  • Method and apparatus for interferometry, spectral analysis, and three-dimensional holographic imaging of hydrocarbon accumulations and buried objects

Examples


Embodiment Construction

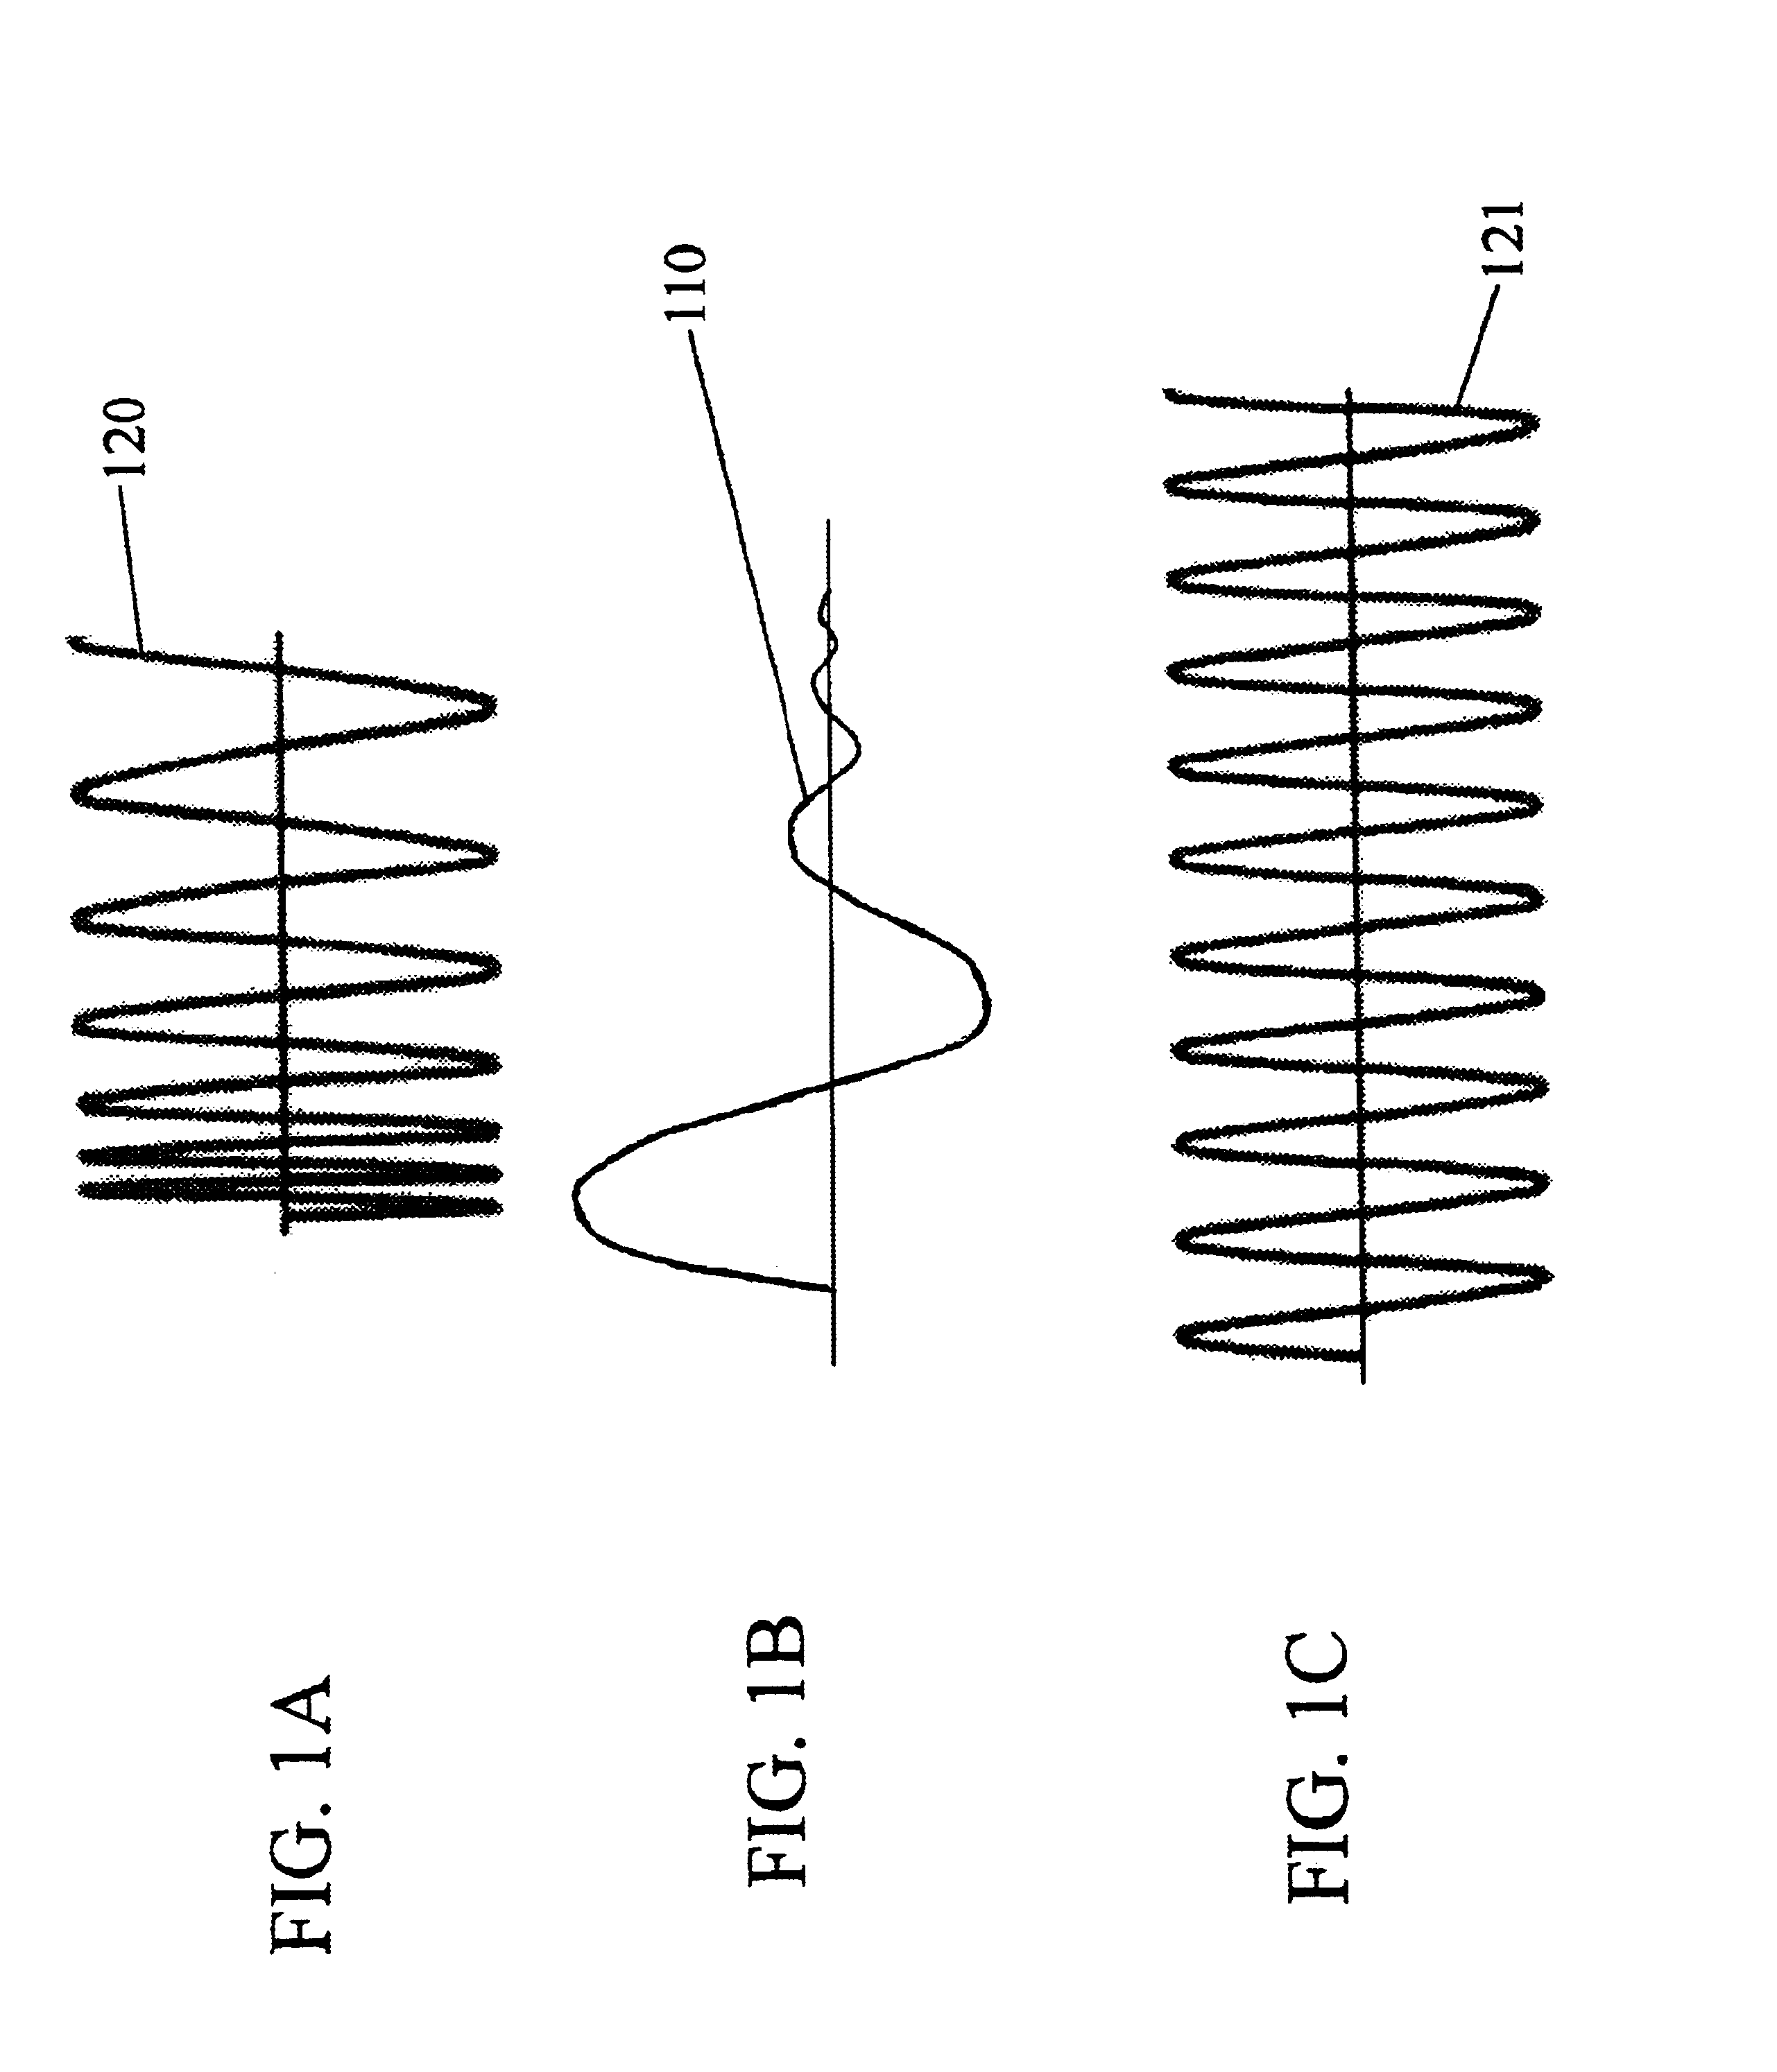
[0043]Referring to FIGS. 1A-B and 11, signals that contain more than one frequency or wavelength are commonly used in subsea and / or subsurface surveying for the detection of buried objects including hydrocarbon accumulations. Excitation or activation of a source provides a signal that results in propagation through an earth medium 122 such as soil, rock, sea bottom, and water. The source signals may be broadband, containing more than one frequency or wavelength, or containing more than one band of frequencies or wavelengths, or they may be multiband signals. These broadband or multiple band signals may be discrete signals 110, such as explosive, weight drop or sonar pulses, whose coherence is measured by a specific time of excitation and propagation and that generally contain a band or range of frequencies. Other forms of coherent broadband or multiple band source signals are modulated signals. Examples of modulated signals include frequency or phase modulated source signals 120. A ...


PUM


Abstract

A methods and apparatus for the detection and exploration of buried objects and hydrocarbons uses two separate signals having different frequency characteristics combined to enable interferometric analysis and imaging systems including radar, sonar, seismological, and general acoustical systems. The measurement and analysis of absorption and other elastic moduli are derived from a three-dimensional display of interferometric information. Interferometric holography also employs the unique characteristic record of frequency, phase, and amplitude of more than one signal.

Description

BACKGROUND AND SUMMARY OF THE INVENTION[0001]This invention relates generally to interferometric apparatus and analysis and, more particularly, to the use of such analysis in connection with the detection and exploration of buried objects and hydrocarbons. Interferometric apparatus is also used to estimate elastic properties of associated earth material.[0002]Originally, one type of signal was used to image and analyze earth materials in the subsurface. Seismic, acoustic, electromagnetic, and other types of signals are used for reflection, echolocation, diffraction, and excitation within earth materials. Signals are generated by transducers or other types of sources. Signals generated include discrete or continuous. Discrete signals are a timed event from a source or sources, such as explosive, dynamite, air guns, falling or fired weights, or any general pulse type source that occurs instantaneously, or as a timed event. Continuous signals result from a time-extended source such as ...

Claims


Application Information

Patent Timeline
IPC IPC(8): G01V1/02G01V1/28
CPCG01V1/006G01V1/28
Inventor SANSONE, STANLEY A.
Owner SANSONE STANLEY A
Learn More