
Interconnect delay and slew metrics based on the lognormal distribution

a technology of interconnection delay and lognormal distribution, applied in the field of standard measurement (metrics), can solve the problems of large number of cells, increasing gate delay of interconnection delays, and complicated connections between cells

Inactive Publication Date: 2005-09-27
INT BUSINESS MASCH CORP
View PDF3 Cites 2 Cited by
  • Summary
  • Abstract
  • Description
  • Claims
  • Application Information

AI Technical Summary

Benefits of technology

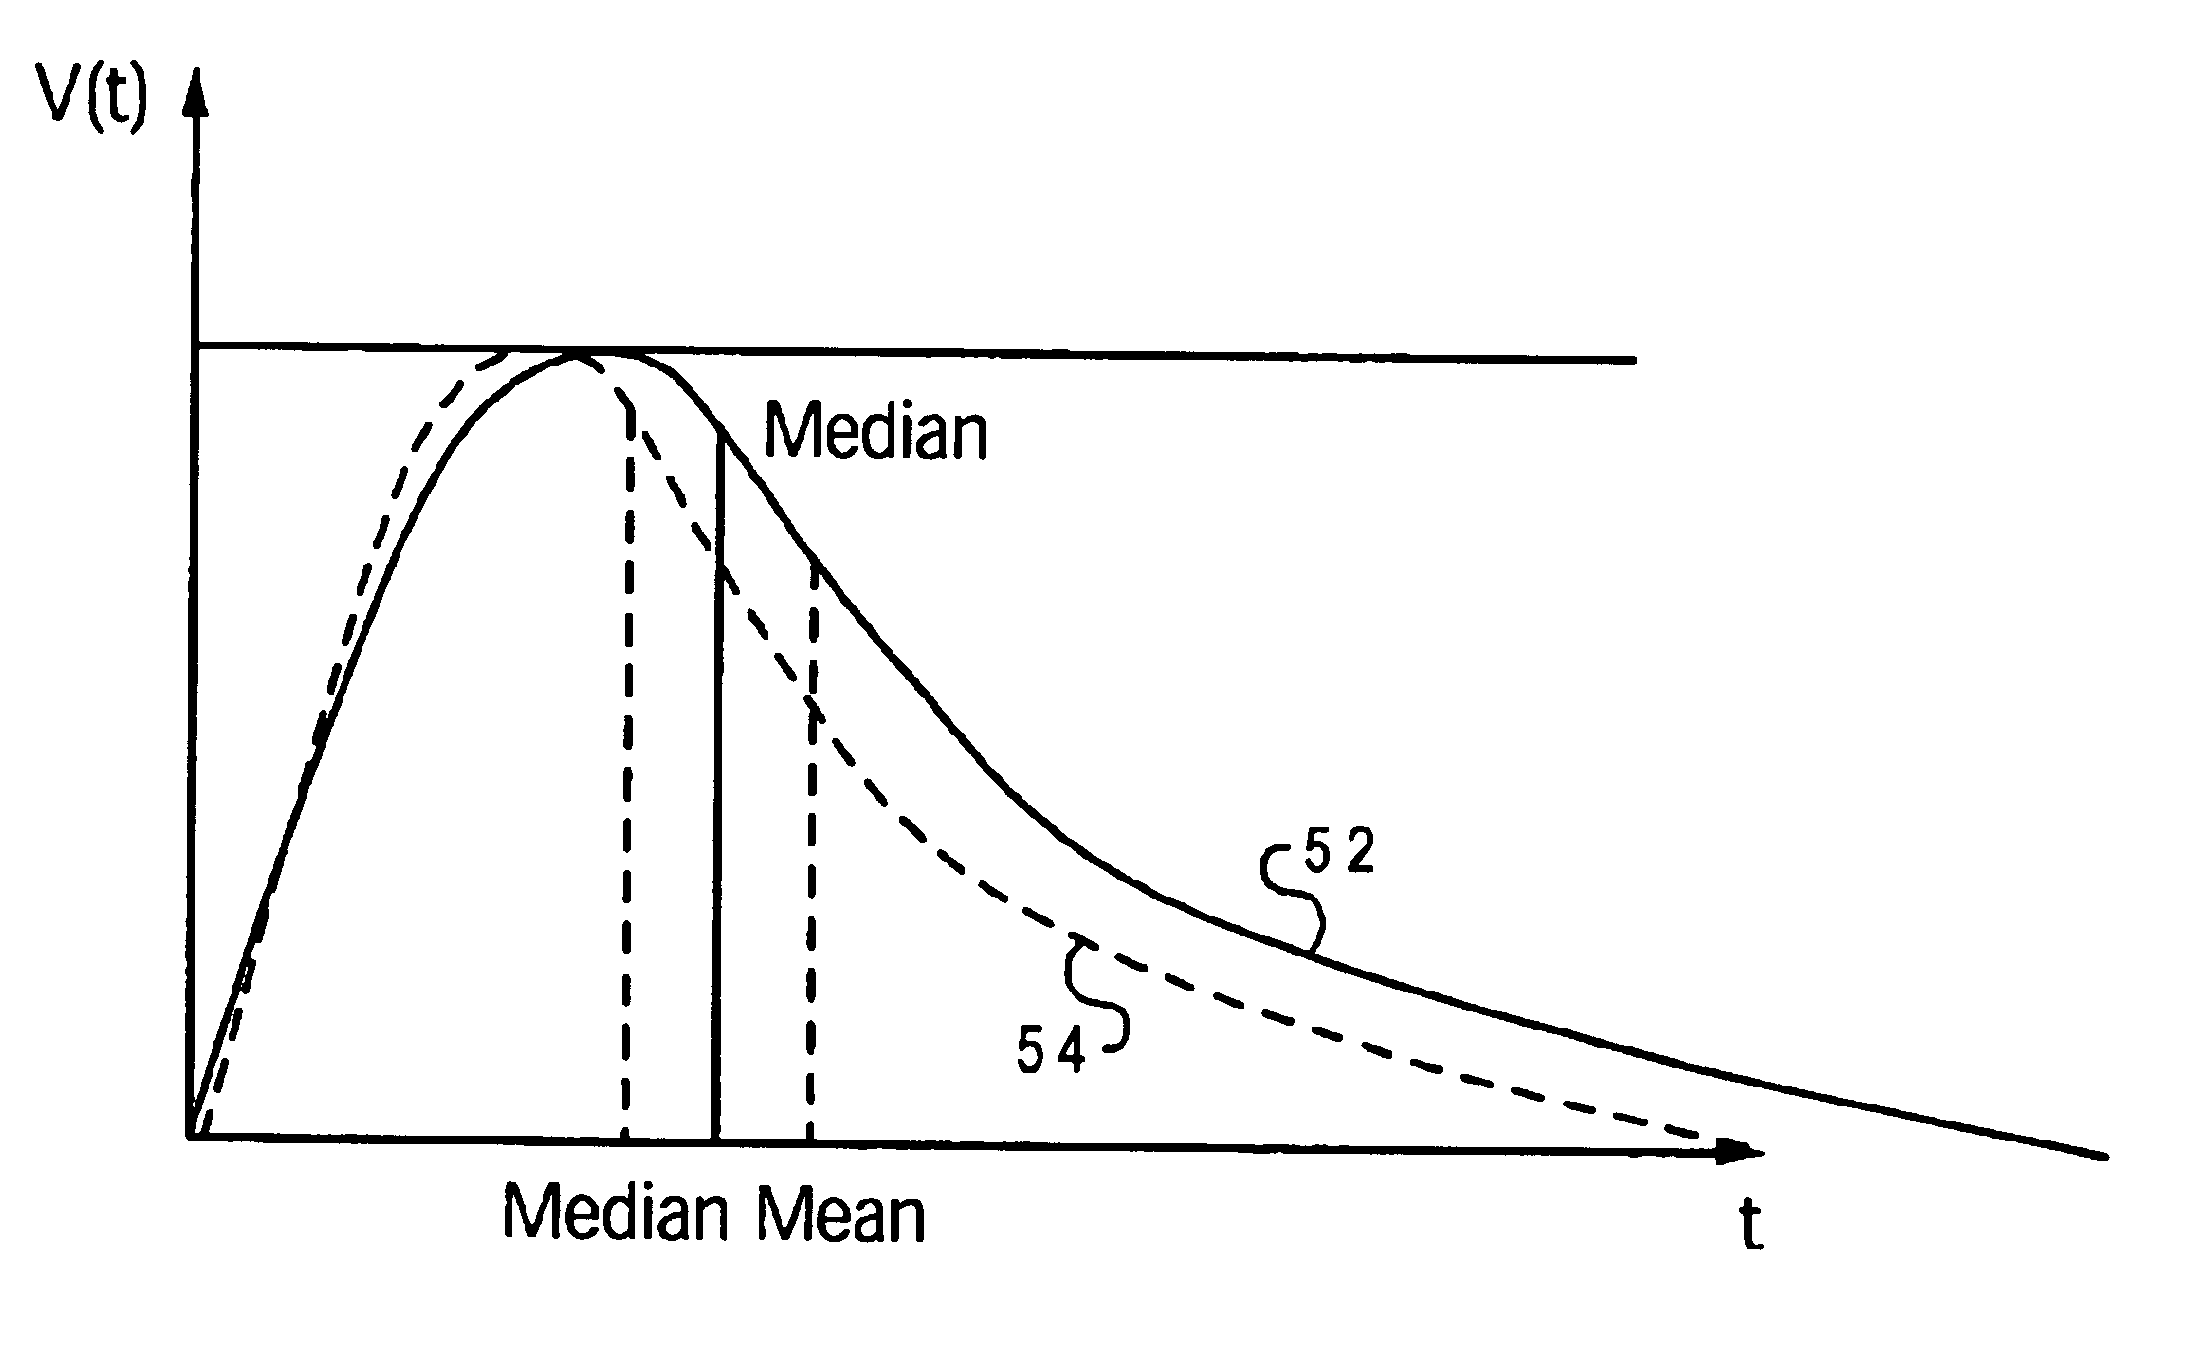
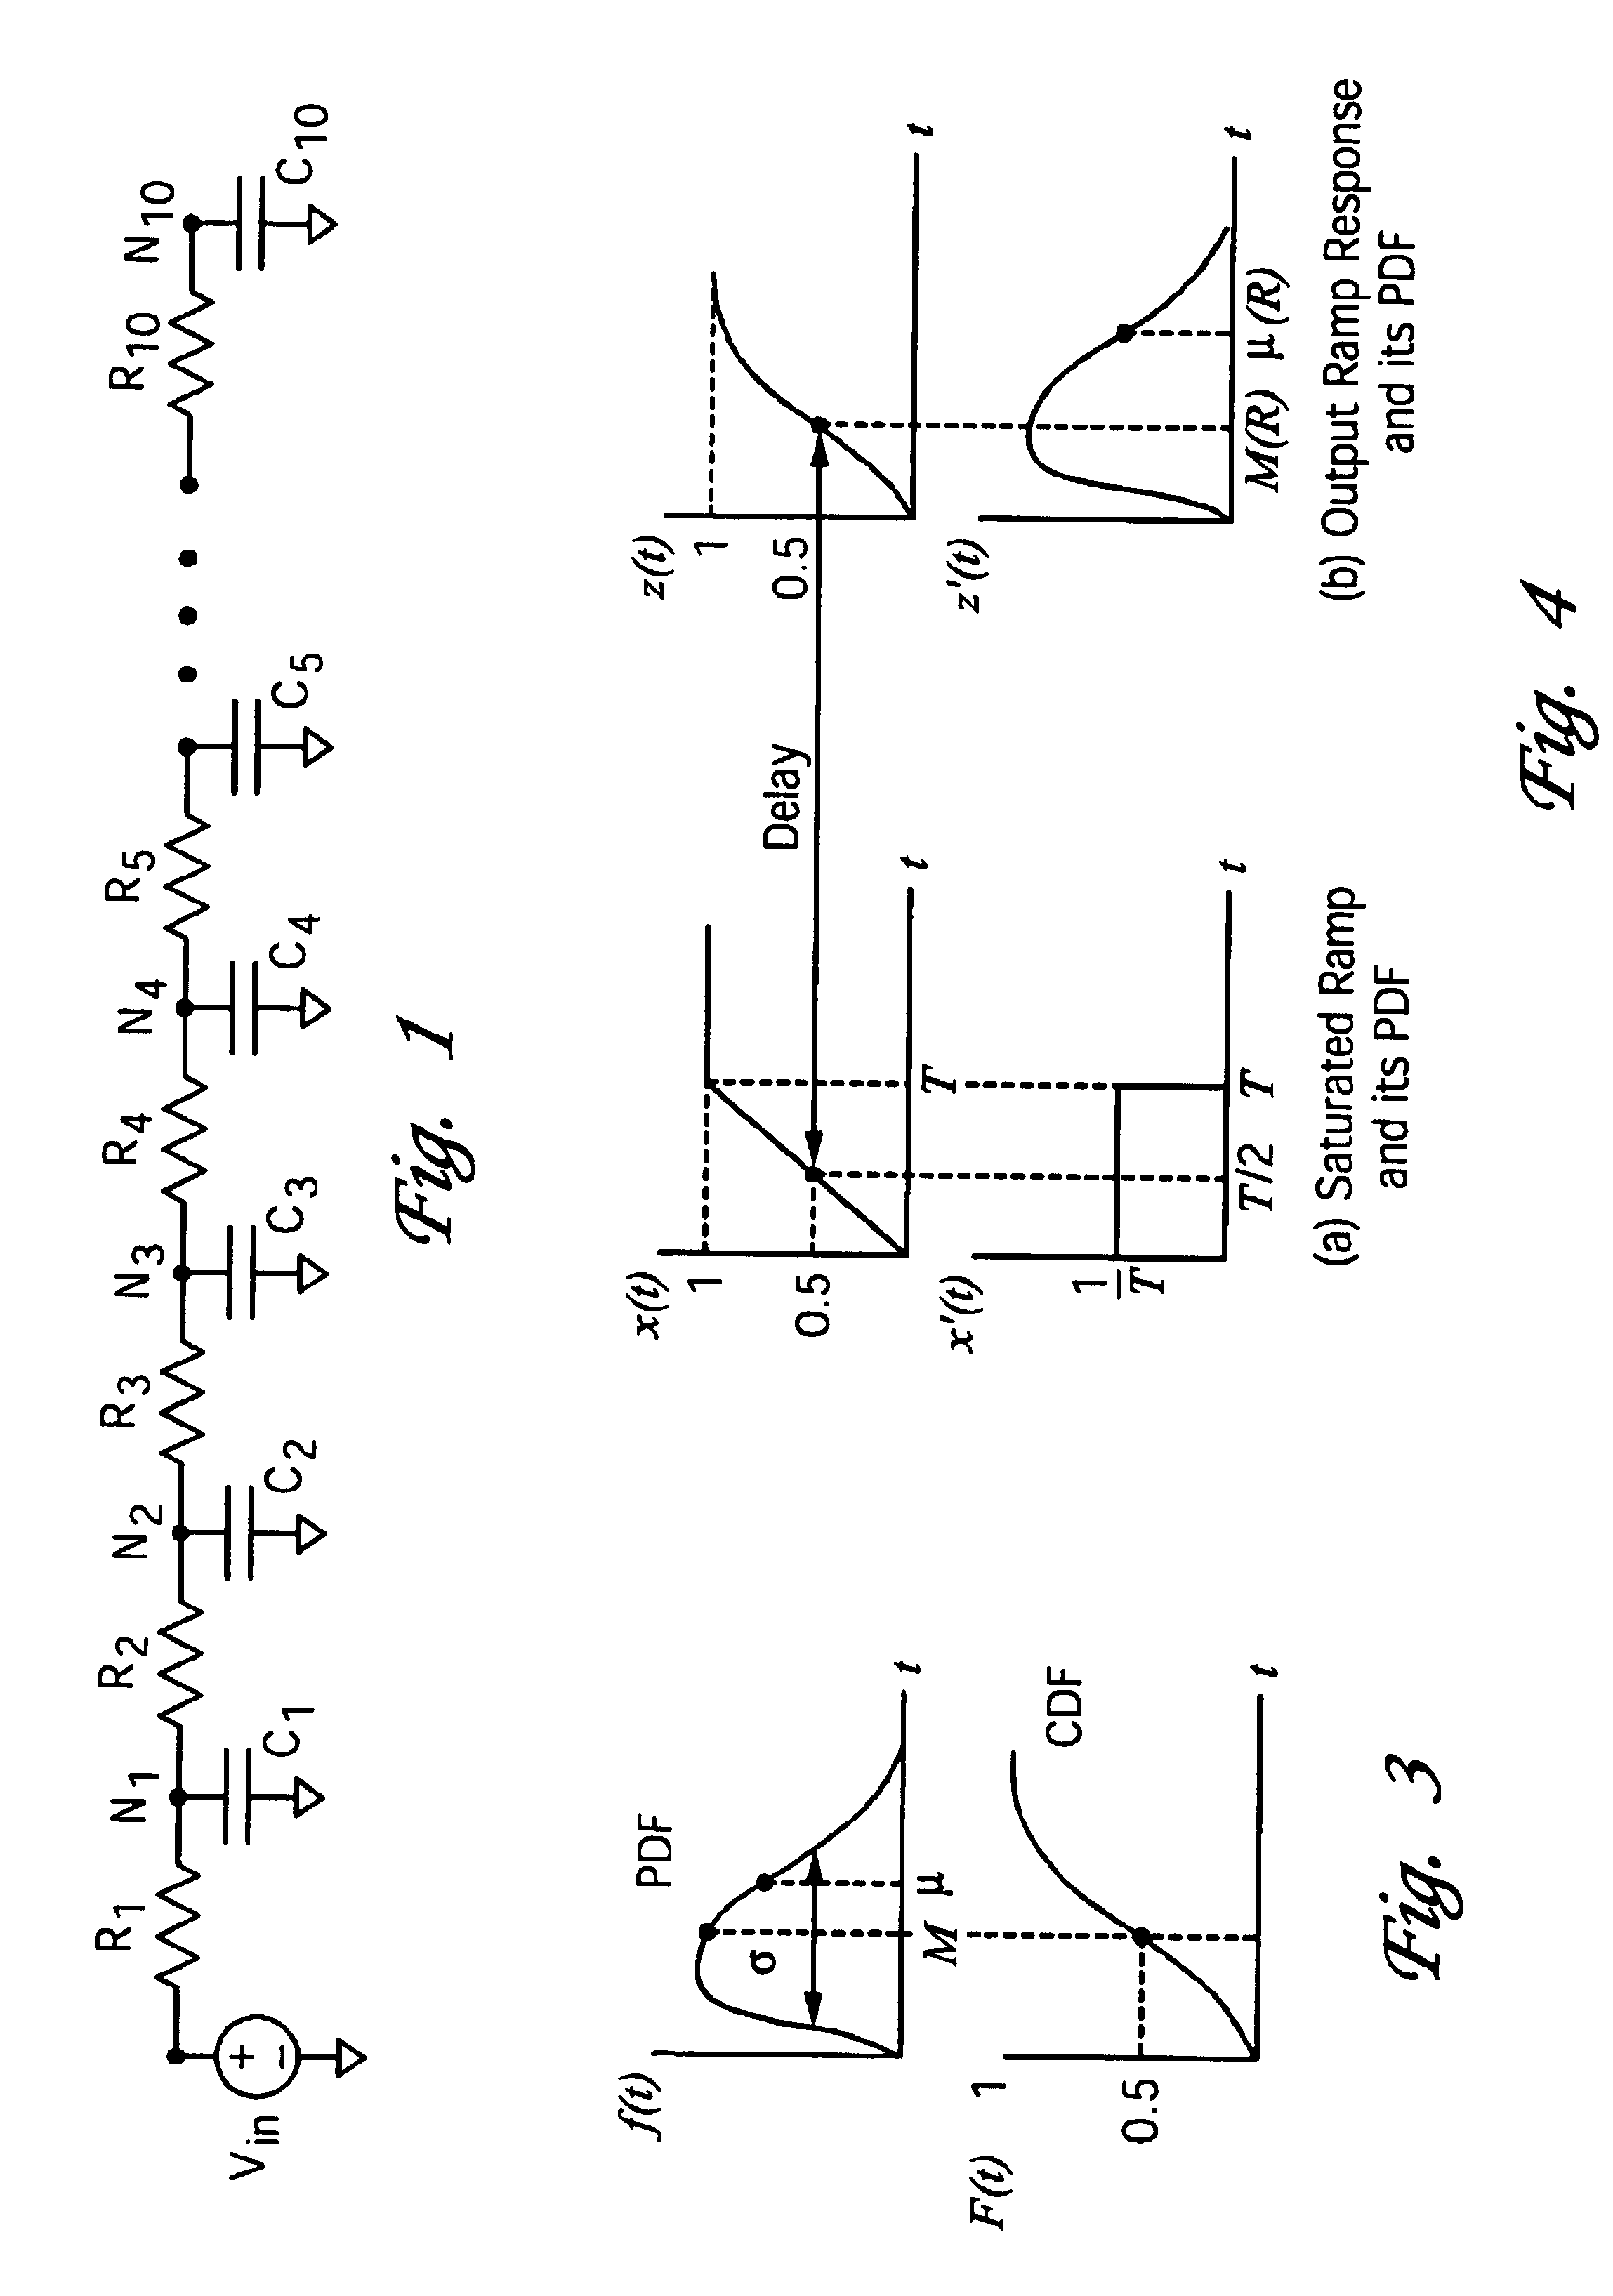
The present invention provides an improved method for measuring delay in a resistive-capacitive network. This method can be used for a wide range of possible input slews and can generally extend any delay and slew metric to ramp inputs. The technique involves calculating two circuit response parameters using statistical distribution functions and combining them to yield an estimated ramp response. The delay response can be derived based on a standard deviation or a mean of a probability distribution function, while the output slew can be estimated based on a lognormal distribution. The closed form formulae provide a simple way to calculate the delay and slew metrics. Overall, this invention provides a more accurate and reliable method for measuring delay and slew in RC networks.

Problems solved by technology

An IC may include a very large number of cells and require complicated connections between the cells.
As process technology scales to the sub-micron regime, interconnect delays increasingly dominate gate delays.
In certain types of circuits, delays exist based on circuit topology and circuit components.
Despite its wide usage, the Elmore delay metric is known to be extremely inaccurate at times because it ignores the resistive shielding of downstream capacitance.
Several of the other traditional metrics are known to be more accurate but are somewhat CPU intensive or difficult to implement.
For example, moment matching via asymptotic waveform evaluation (AWE, implemented in an interconnect analysis called RICE ) is very accurate but computationally expensive for use within a tight optimization loop.
Two-pole variants of AWE are considerably faster and recognized to be more accurate than the Elmore delay metric, but are still relatively expensive, as nonlinear solution methods such as Newton-Raphson iterations need to be run to solve the transcendental equation.
While being accurate, this method requires a carefully constructed table which is made harder by the fact that input slews can vary over a wide range, especially during the initial stages of design.
However, the formula is only valid for very fast input slews and has large errors for even moderately slow inputs.

Method used


Image

  • Interconnect delay and slew metrics based on the lognormal distribution
  • Interconnect delay and slew metrics based on the lognormal distribution
  • Interconnect delay and slew metrics based on the lognormal distribution

Examples


Embodiment Construction

)

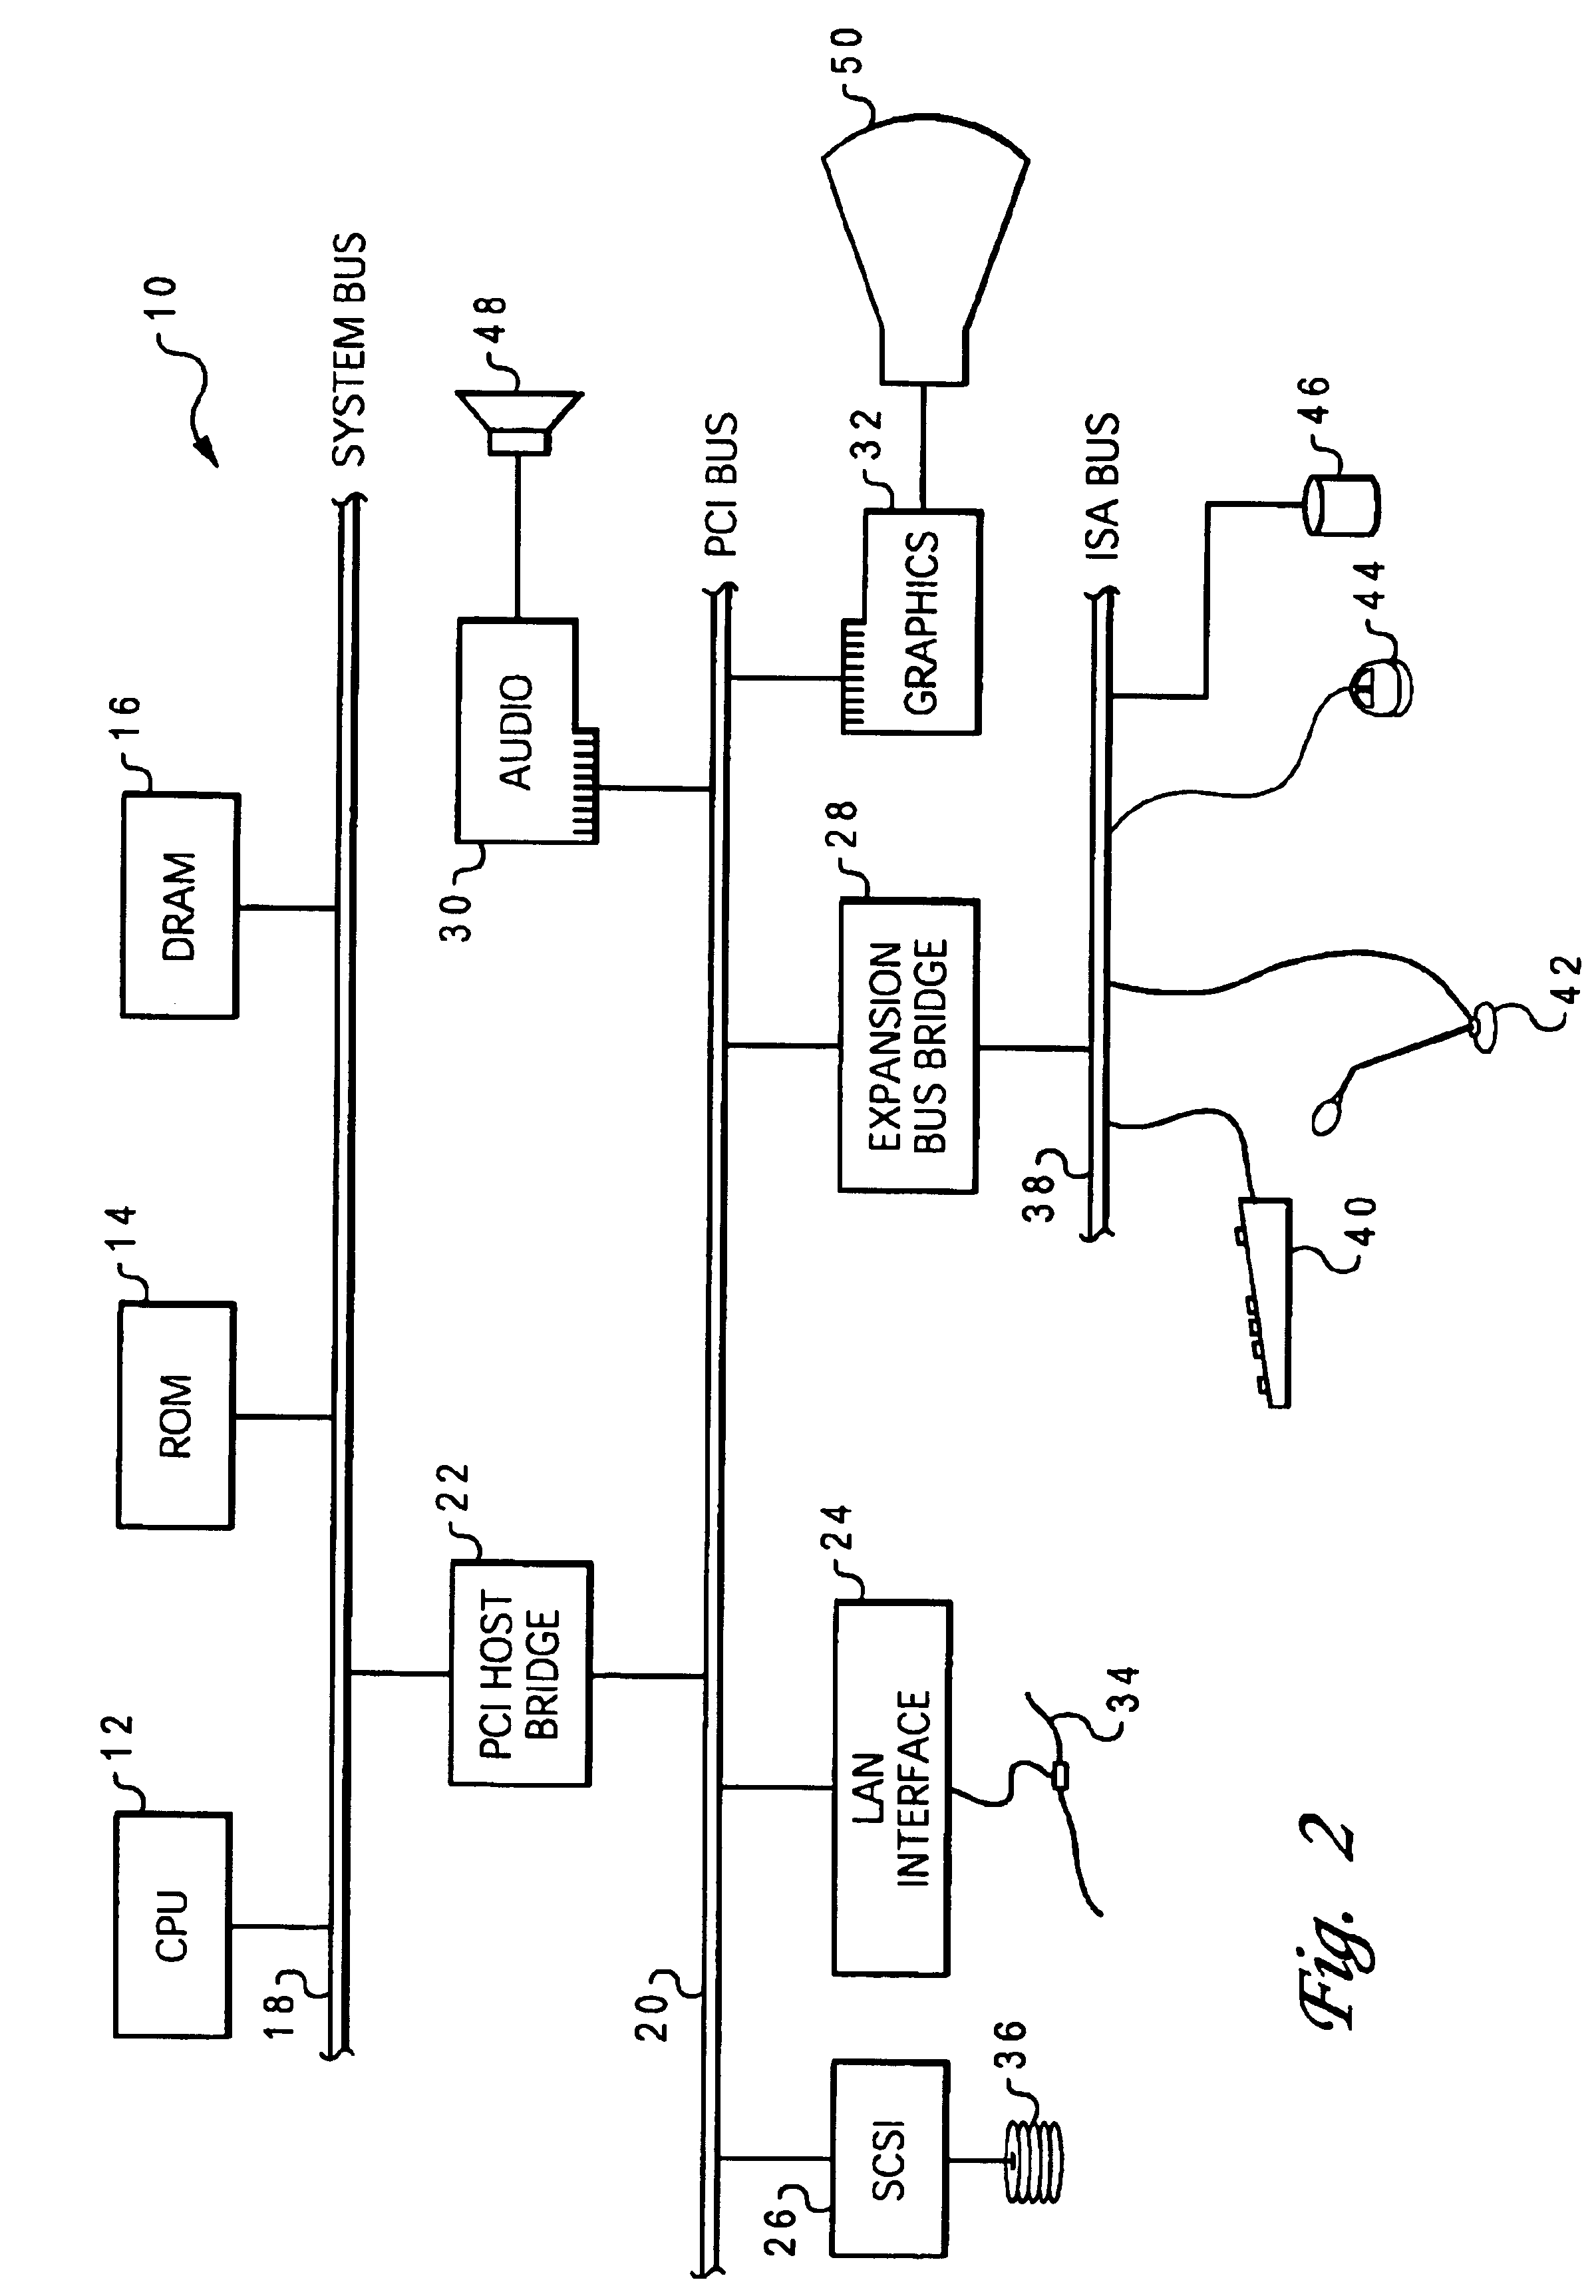
[0028]With reference now to the figures, and in particular with reference to FIG. 2, there is depicted one embodiment 10 of a computer system programmed to carry out computer-aided design of an integrated circuit in accordance with one implementation of the present invention. System 10 includes a central processing unit (CPU) 12 which carries out program instructions, firmware or read-only memory (ROM) 14 which stores the system's basic input / output logic, and a dynamic random access memory (DRAM) 16 which temporarily stores program instructions and operand data used by CPU 12. CPU 12, ROM 14 and DRAM 16 are all connected to a system bus 18. There may be additional structures in the memory hierarchy which are not depicted, such as on-board (L1) and second-level (L2) caches.

[0029]CPU 12, ROM 14 and DRAM 16 are also coupled to a peripheral component interconnect (PCI) local bus 20 using a PCI host bridge 22. PCI host bridge 22 provides a low latency path through which processor 12 ma...


PUM


Abstract

A method of determining a circuit response (such as delay or slew) from a ramp input of an RC circuit calculates two circuit response parameters using a given circuit response metric based on a step input for the RC circuit, and extends the circuit response metric to a ramp input of the RC circuit by combining the first and second circuit response parameters to yield an estimated ramp response. The novel technique is based on the use of probability distribution functions and cumulative distribution functions to characterize the impulse response of the RC circuit, and the calculating steps derive the first and second circuit response parameters from such statistical distribution functions. In particular, the calculating steps may use a standard deviation or a mean of a probability distribution function corresponding to the circuit response parameter. In one application, the invention is used to estimate delay response for the ramp input of the RC circuit. In another application, the invention is used to estimate output slew for the ramp input of the RC circuit. New delay and slew metrics are also disclosed which are derived by matching one or more properties of the network impulse response to a lognormal distribution. For delay, the mean and variance of a probability distribution function (PDF) are correlated to the lognormal distribution. For slew, alternative metrics are provided; one slew metric correlates the mean and variance of the PDF to the lognormal distribution, while a second slew metric correlates the variance and skewness of the PDF to the lognormal distribution.

Description

CROSS-REFERENCE TO RELATED APPLICATION[0001]This application is related to U.S. patent application Ser. No. 10 / 306,603 filed Nov. 26, 2002, and entitled “METHOD AND SYSTEM FOR EXTENDING DELAY AND SLEW METRICS TO RAMP INPUTS,” which is hereby incorporated.BACKGROUND OF THE INVENTION[0002]1. Field of the Invention[0003]The present invention generally relates to standards of measurement (metrics) for characterizing features of electrical circuits, and more particularly to a method and system for establishing delay and slew metrics for resistive-capacitive (RC) networks, such as those in an integrated circuit.[0004]2. Description of the Related Art[0005]Integrated circuits are used for a wide variety of electronic applications, from simple devices such as wristwatches, to the most complex computer systems. A microelectronic integrated circuit (IC) chip can generally be thought of as a collection of logic cells with electrical interconnections between the cells, formed on a semiconductor...

Claims


Application Information

Patent Timeline
Patent Type & Authority Patents(United States)
IPC IPC(8): G06F9/45G06F17/50
CPCG06F17/5022G06F30/33
Inventor ALPERT, CHARLES JAYDEVGAN, ANIRUDHKASHYAP, CHANDRAMOULI V.LIU, YING
Owner INT BUSINESS MASCH CORP
Learn More