
Use of a scanner to determine the optical density of calcined coke as a measure of coke quality

a technology of optical density and calcined coke, which is applied in the field of improving the method of analyzing the quality of petroleum byproducts in particle form, can solve the problems of difficult classification of coke products based on lustre measurements, complex and time-consuming known methods for measuring coke cte, and fairly involved procedures. , to achieve the effect of accurately classifying coke products, increasing the efficiency of petroleum processing, and quick classification

Inactive Publication Date: 2005-10-11
PHILLIPS 66 CO
View PDF8 Cites 1 Cited by
  • Summary
  • Abstract
  • Description
  • Claims
  • Application Information

AI Technical Summary

Benefits of technology

[0015]The present invention addresses the above referenced needs in the art. In an exemplary embodiment, the invention provides a method for measuring coke quality by digital quantification of high intensity reflectivity. The invention includes an improved test for qualifying petroleum products, especially coke. The test involves obtaining a sample from a petroleum product (i.e. calcined coke) produced under known operating parameters during petroleum refining. The test enables the user to quickly and efficiently classify the product.

Problems solved by technology

As will be appreciated by those skilled in the art, this procedure is fairly involved and time-consuming, on the magnitude of three to four days for a CTE measurement.
However, the known methods for measuring coke CTE are complex and time-consuming.
Classification of cokes based on lustre measurements has been difficult because only small differences in lustre are seen, even when CTE differences are significant.
In other words, it has been difficult to correlate the small deviations noticed between coke lustres with a meaningful correlation with CTE variances.

Method used


Image

  • Use of a scanner to determine the optical density of calcined coke as a measure of coke quality
  • Use of a scanner to determine the optical density of calcined coke as a measure of coke quality
  • Use of a scanner to determine the optical density of calcined coke as a measure of coke quality

Examples


example 1

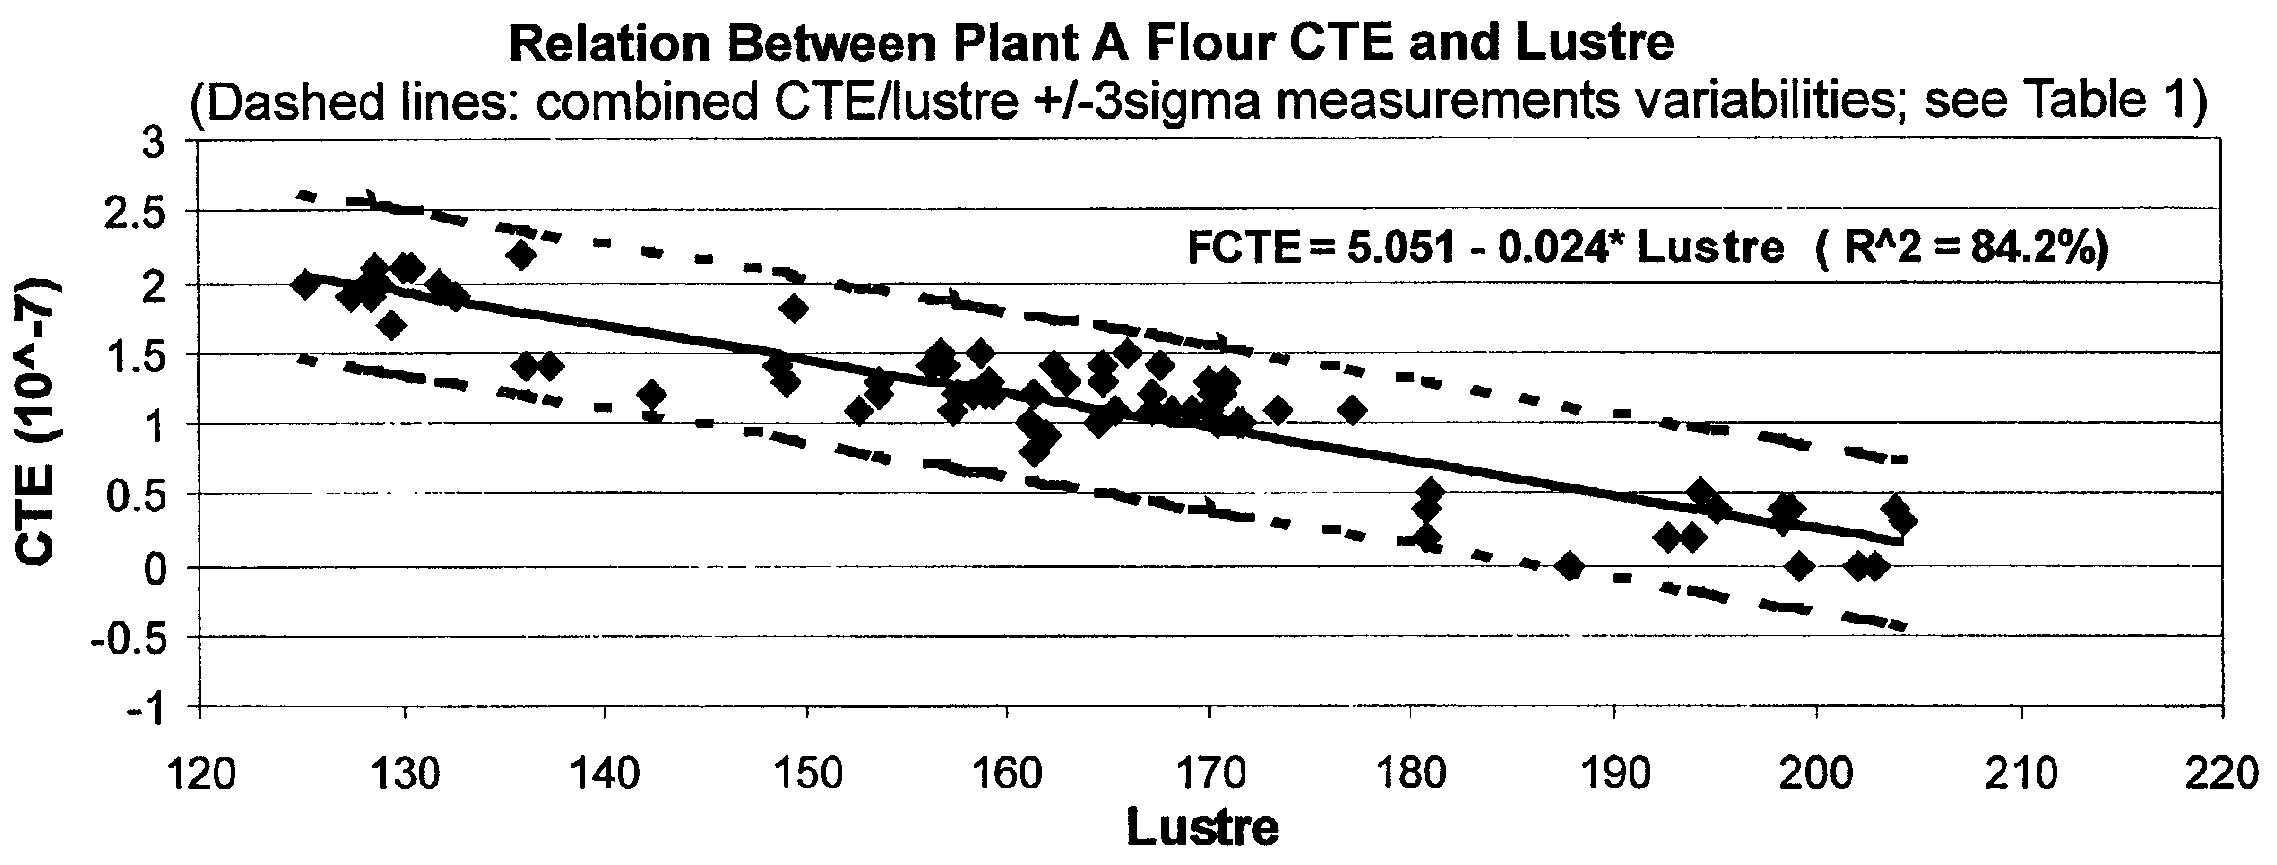
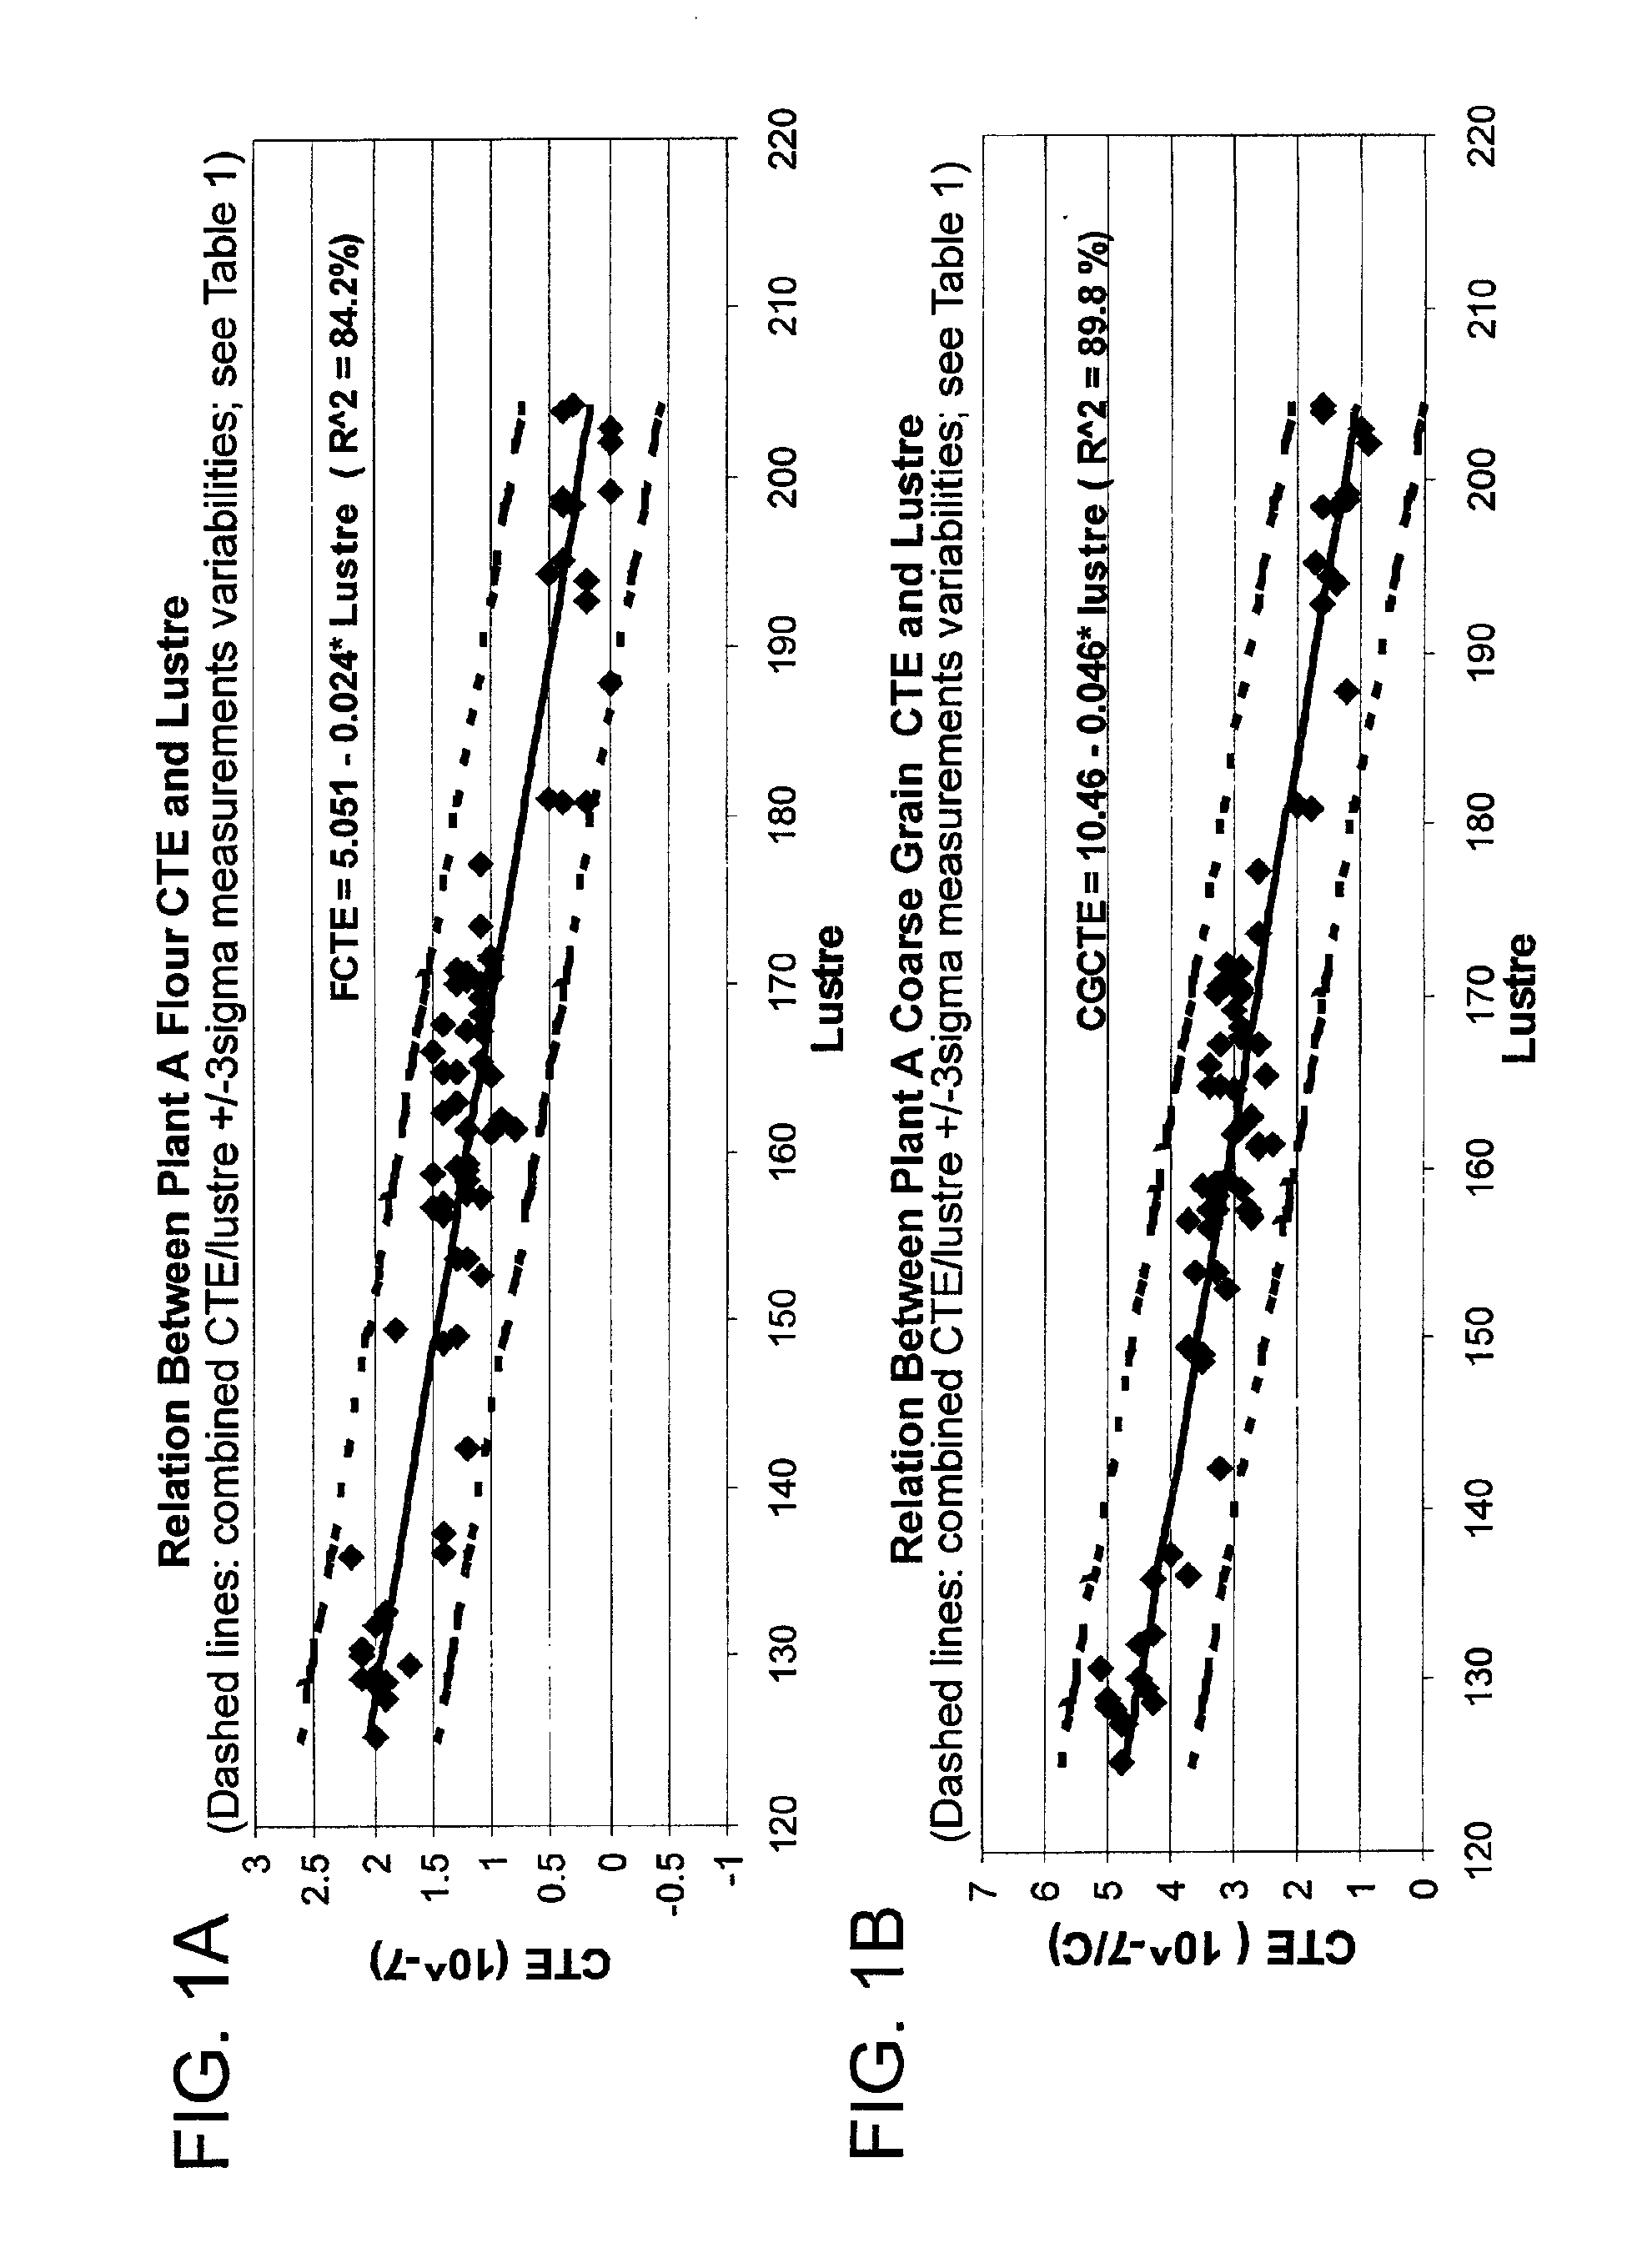
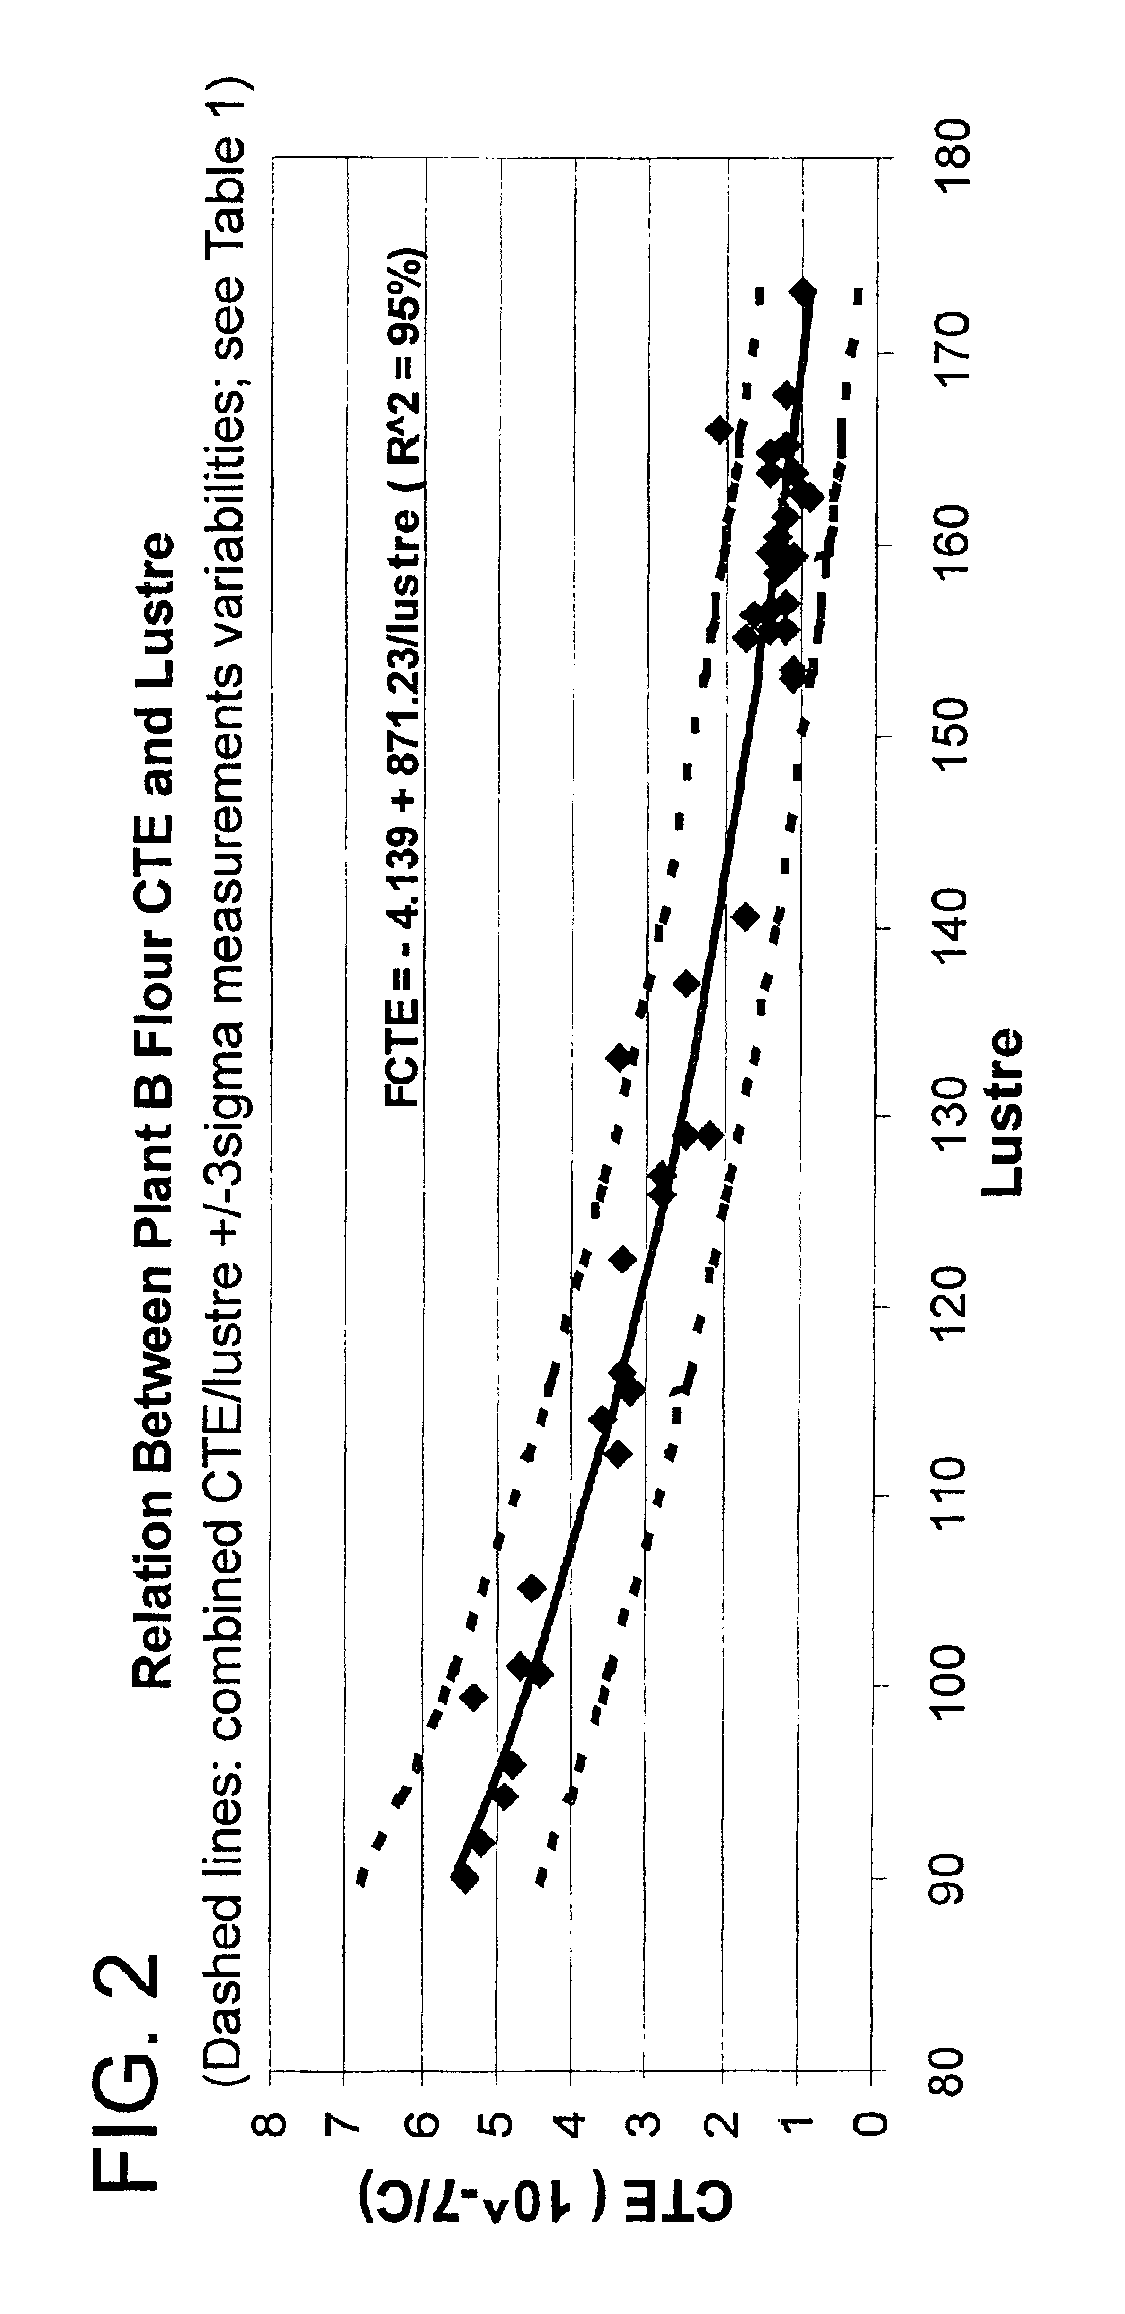
[0053]Lustre testing as described hereinabove was performed in accordance with an exemplary embodiment of the invention (FIGS. 1-4 and Table 1). The lustre test results are the average of five separate measurements on the same coke sample. As described hereinafter, for the lustre test measurements, about 400-500 grams of de-oiled and crushed (28 / 100 ty— Tyler standard screen scale fractions are used).

[0054]The simple regressions (maximum R2 criteria) shown in FIGS. 1 and 2 indicate excellent relations between plant generated CTEs and lustre given the combined lustre / CTE measurement variabilities. The dashed lines in FIGS. 1 and 2 were obtained by translation of the mean regression lines in the horizontal and vertical directions by the ±3σ values (see Table 1) of the corresponding measurements.

[0055]Based on the above findings regarding the low variability of the lustre test as well as its excellent correlation with CTEs, it is believed that significant advantages will be achieved si...


PUM


Abstract

An improved test for quantifying luster of petroleum products in particle form, especially coke, as an index of quality. A representative sample of the product is obtained and prepared. A digital image of the sample is formed using a scanner. The image is then processed digitally to produce a representative luster or optical density measurement for the sample. The preceding process may be repeated several times for each sample and the resultant luster or optical density measurements for each iteration are totaled and averaged. Once the luster measurement or optical density for the sample is obtained, it is compared to established parameters to assign a CTE value to the sample, assuming there is sufficient historical data correlating the two measurements. Various refining operating parameters including feedstocks, temperatures and pressures, may be altered to obtain a desired product.

Description

CROSS REFERENCE TO RELATED APPLICATION[0001]This application is a continuation-in-part patent application of U.S. patent application Ser. No. 09 / 258,859 filed Feb. 26, 1999 now Pat. No. 6,330,343 entitled “A Method for Measuring Coke Quality by Digital Quantification of High Intensity Reflectivity”.BACKGROUND OF THE INVENTION[0002]1. Field of the Invention[0003]The present invention relates generally to an improved method of analyzing petroleum products in particle form. More particularly, the present invention relates to an improved method for analyzing the quality of petroleum by-products in particle form, especially coke, and relates to improved methods for refining petroleum to obtain desirable coke by-products.[0004]2. Prior Art[0005]As will be appreciated by those skilled in the art, petroleum products are analyzed for many purposes by using various tests. The test results are used for many purposes, sometimes even including controlling the refining of these products in order ...

Claims


Application Information

Patent Timeline
IPC IPC(8): G01N33/22G01N21/88G06T7/00G01N21/59
CPCG01N21/5911G01N21/8851G01N33/28G06T7/001G06T2207/10008G06T2207/30108
Inventor WELCH, GARY E.JOZAVI, HOOSHANG
Owner PHILLIPS 66 CO
Learn More