Method for selecting representative endmember components from spectral data

Inactive Publication Date: 2008-01-22
LEIDOS
View PDF6 Cites 3 Cited by
  • Summary
  • Abstract
  • Description
  • Claims
  • Application Information

AI Technical Summary

Benefits of technology

[0008]Currently, the process of determining the number and nature of these spectrally distinct components (or “endmembers”) using either the manual or statistical selection process is both subjective and labor intensive. Because of this, SMA-based classification, although clearly of significant use in many applications, has largely been limited to labor intensive research projects. In such studies, endmembers are typically selected manually by experienced analysts. Results from this process are subjective and vary from one investigator to another. Further, as the complexity of data sets increase, so does the time required to perform SMA as does the likelihood of greater error. Consequently, there is a need in the art for a faster, more objective, more cost-effective, user-friendly process for selecting representative spectral endmembers for a scene. As more and more data become available from, e.g., commercial airborne systems and earth observational satellites which include hyperspectral sensors, there is an increasing need for a process that aids both experienced and novice end-users to work more efficiently, significantly reduces costs, and enhances the utility of spectral imagery.SUMMARY OF THE SOLUTION
[0010]The invention described herein achieves a significant advancement in the application of SMA. As discussed herein, the process of the present invention successfully implements a number of the manual decision making steps that an analyst performs in doing mixture analysis. However, these steps are ordered in a way that leads to far fewer false steps, fewer refinements of endmember selection, and, minimizes the need to remove entire endmember sets from an analysis sequence. Further, the process of the present invention provides users with sophisticated insight into mixture model methods. This is particularly important when working with, for example, complex scenes or on areas where specific objectives must be met.
[0011]As a result of the processes described herein, the time required to exploit spectral image data is dramatically reduced. The process makes information from spectral imagery readily available, and expedites critical decision making. The process automatically determines the subpixel proportions of materials in spectral datasets and transforms these data into readily interpretable information layers that can be imported into, e.g., a geographical information system (GIS) database.
[0012]Applications of spectral imaging data can support a diverse range of scientific and business operations. Among these, spectral data offers enormous potential for routinely creating geologic and soil maps, environmental monitoring, aiding forestry and agriculture production, land use / land cover mapping, and various applications in support of civil, military, law enforcement, and intelligence communities. For example, high resolution spectral imaging is used to help winegrowers harvest their crops with more precision. By identifying plant health and maturity, vintners can establish optimum harvest schedules that ultimately yield high quality wine. The same methodology holds true for using spectral imaging data to non-destructively detect bruised fruit in large orchards, and also aiding law enforcement officials in detecting marijuana plants from airborne platforms.

Problems solved by technology

Currently, the process of determining the number and nature of these spectrally distinct components (or “endmembers”) using either the manual or statistical selection process is both subjective and labor intensive.
Because of this, SMA-based classification, although clearly of significant use in many applications, has largely been limited to labor intensive research projects.
Further, as the complexity of data sets increase, so does the time required to perform SMA as does the likelihood of greater error.

Method used


Image

  • Method for selecting representative endmember components from spectral data
  • Method for selecting representative endmember components from spectral data
  • Method for selecting representative endmember components from spectral data

Examples


Embodiment Construction

[0023]The following embodiments, though representing the best known mode of practicing the present invention, are not intended to be limited thereto. Based on the knowledge of one skilled in the art, variations of the following embodiments are intended to be part of the scope of the present invention.

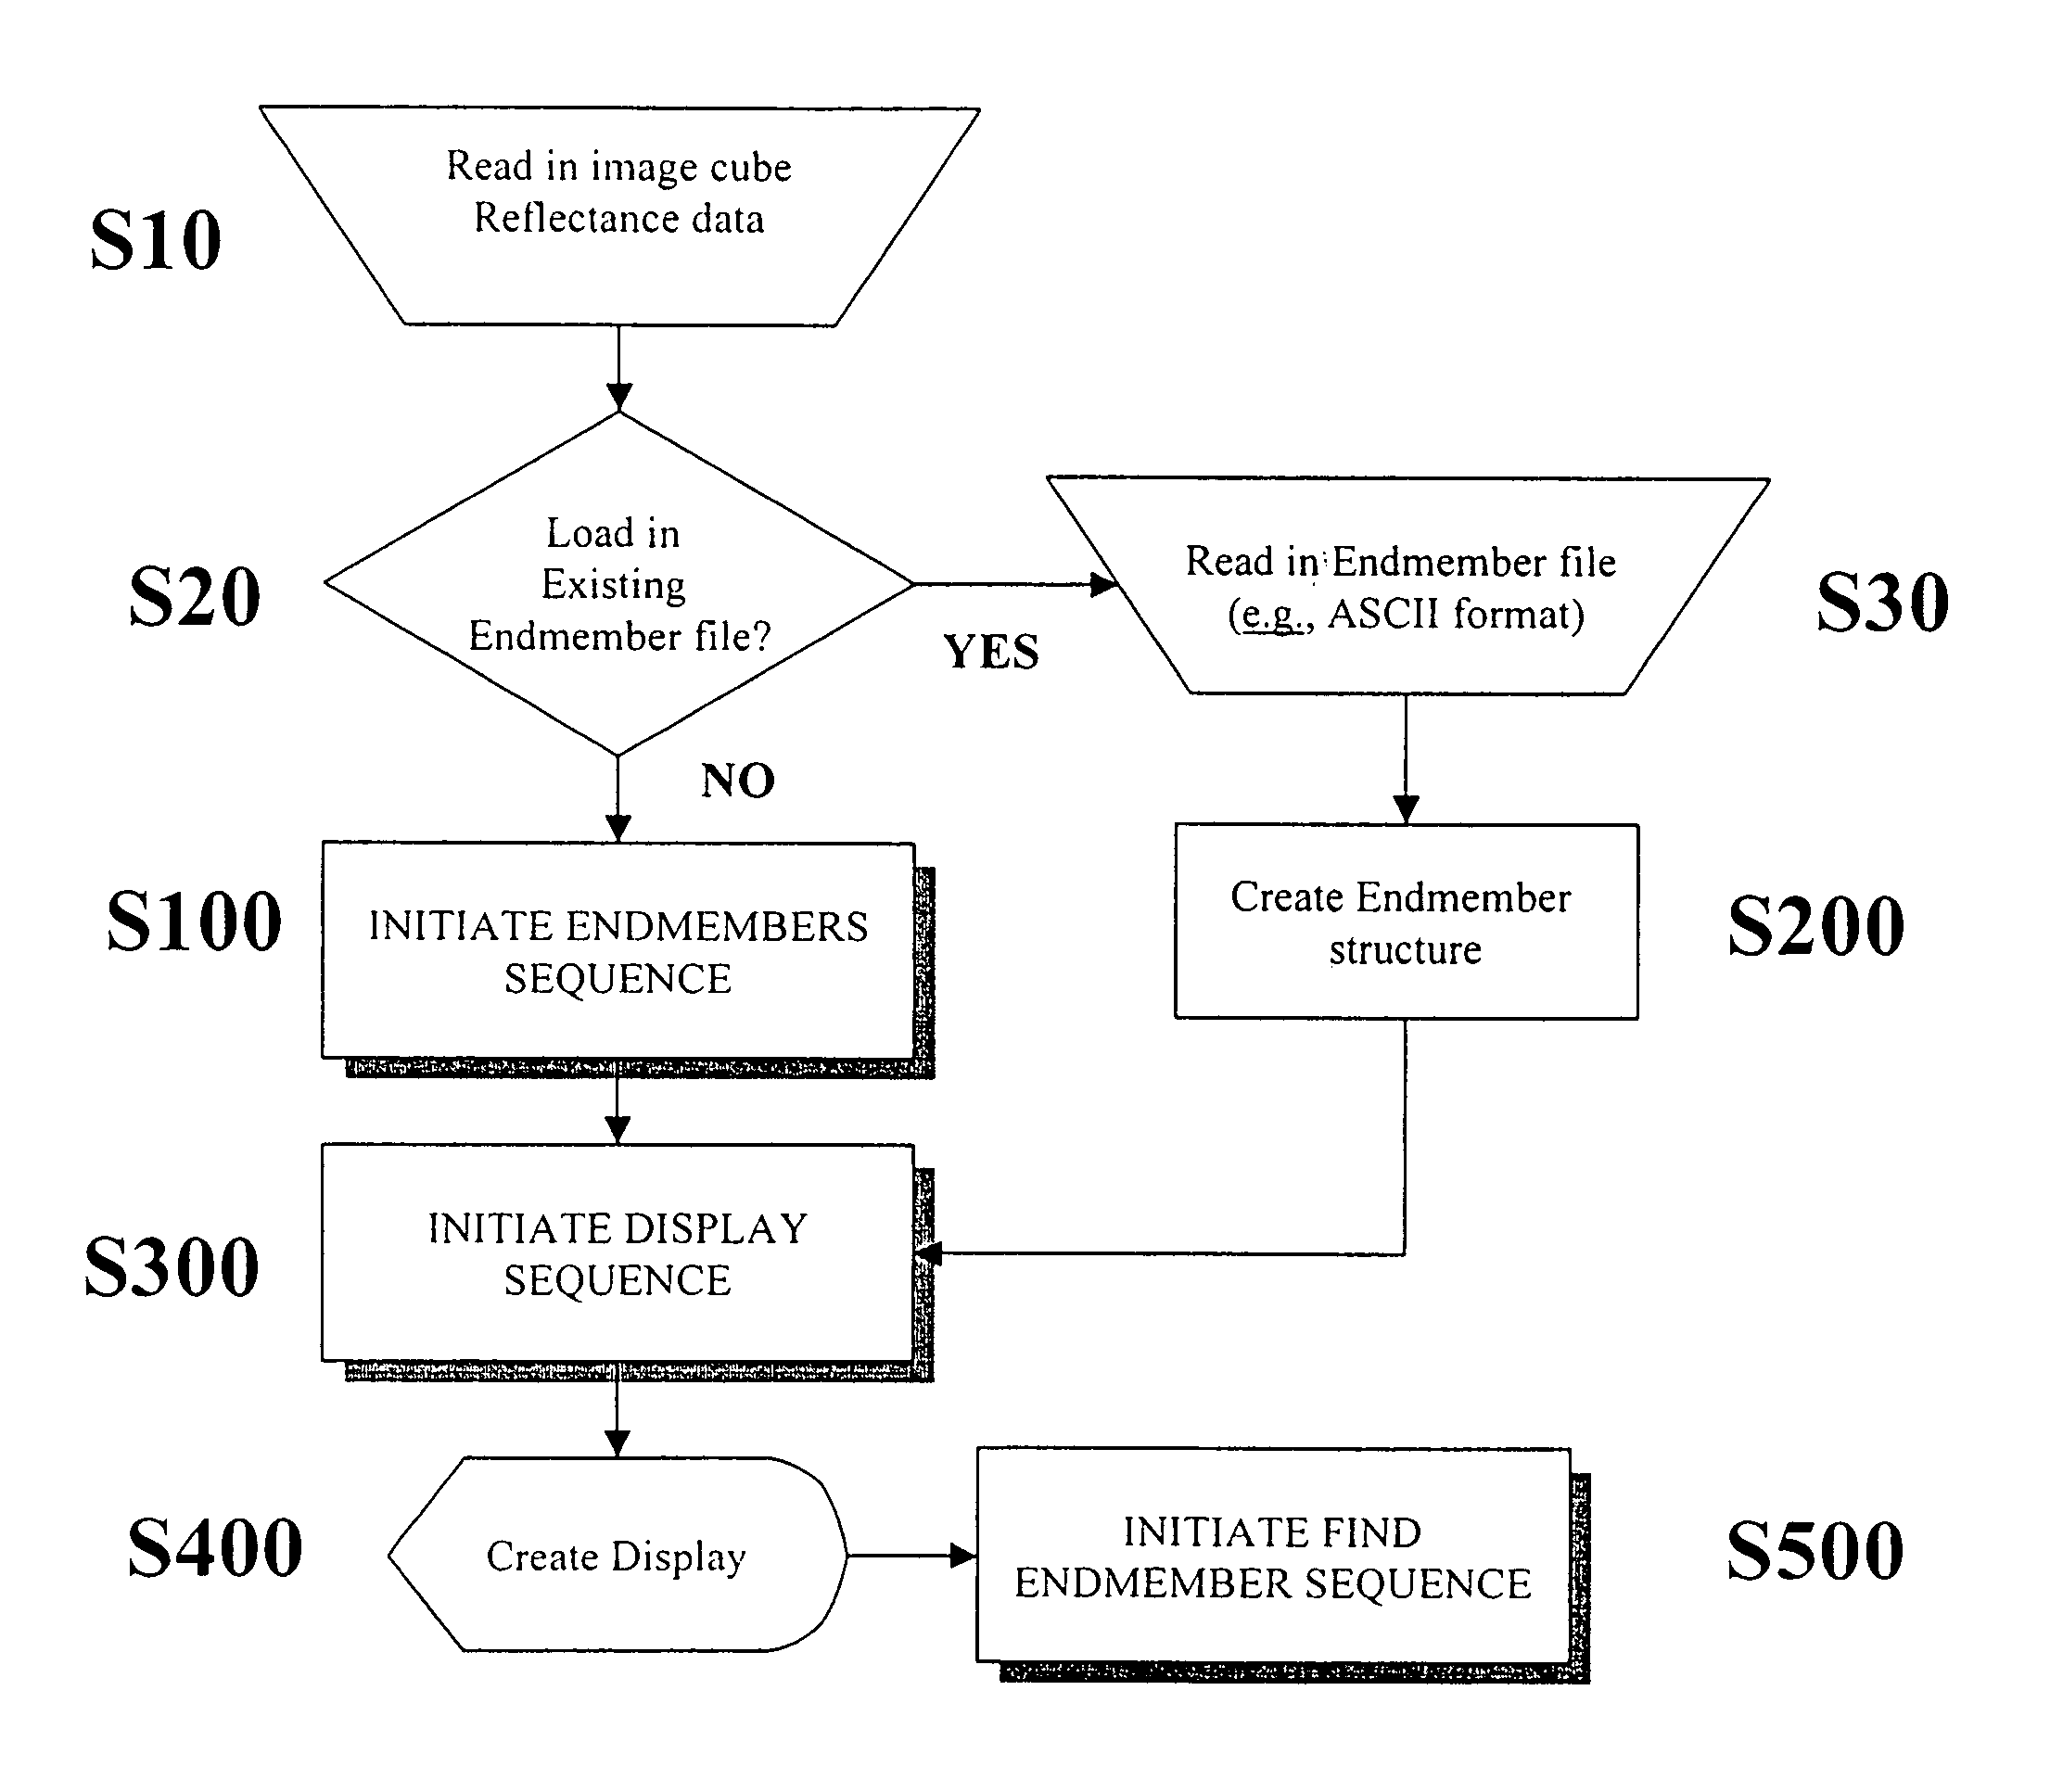
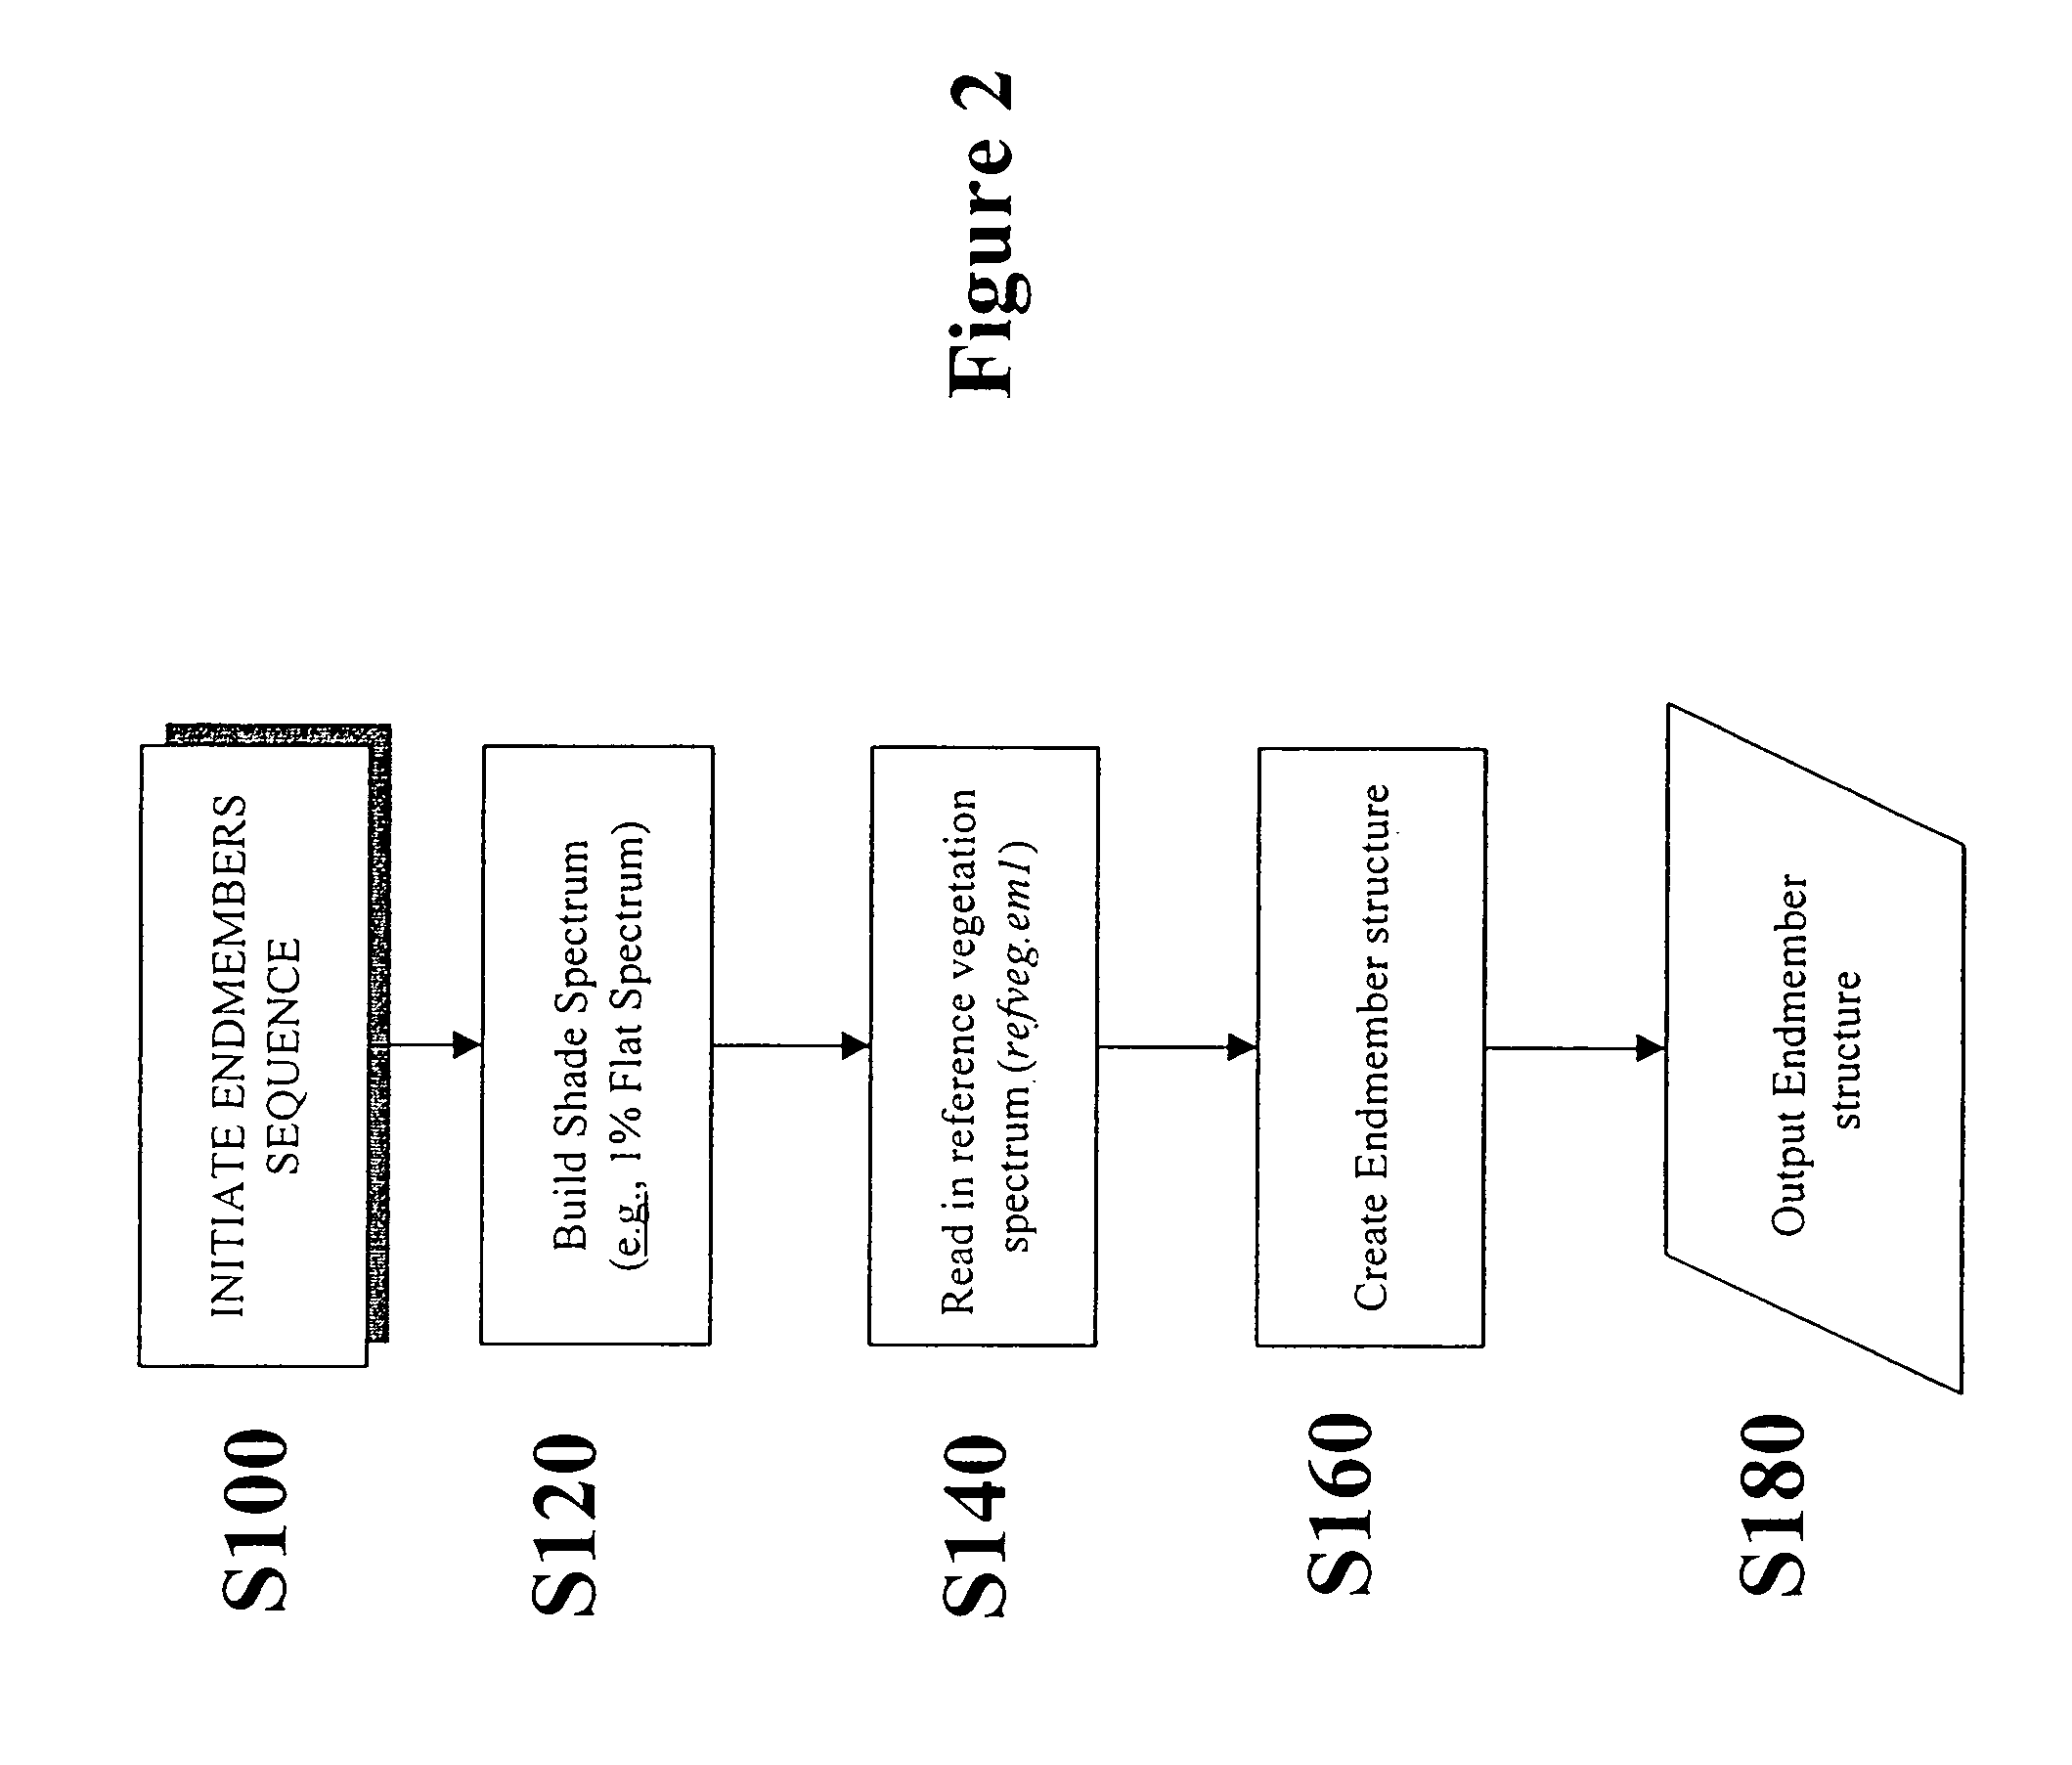
[0024]The flowchart of FIGS. 1-6 sets forth the general process steps for determining the land cover types, e.g, green vegetation (leaves, grass, etc.), non-photosynthetic vegetation (“NPV”) (e.g., bark, wood, dry leaves), soils, snow, ice, roads, buildings, and shade, within a particular scene according to an embodiment of the present invention. Image cube reflectance, emission, or radiance data (hereafter “reflectance data”) indicative of a scene is read into a processor S10. The scene boundaries are defined by, for example, a set of ground-based longitudinal and latitudinal coordinates. The reflectance data results from imaging performed by any of a number of sources, such as, satell...


PUM


Abstract

Described herein is a process for objectively and automatically determining spectral endmembers and transforming Spectral Mixture Analysis (SMA) from a widely used research technique into a user-friendly tool that can support the needs of all types of remote sensing. The process extracts endmembers from a spectral dataset using a knowledge-based approach. The process identifies a series of starting spectra that are consistent with a scene and its environment. The process then finds endmembers iteratively, selecting each new endmember based on a combination of physically and statistically-based tests. The tests combine spectral and spatial criteria and decision trees to ensure that the resulting endmembers are physically representative of the scene.

Description

CROSS-REFERENCE TO RELATED APPLICATIONS[0001]The current application is a continuation application of U.S. application Ser. No. 11 / 333,360 filed on Jan. 18, 2006 now U.S. Pat. No. 7,221,798 and titled Method for Selecting Representative Endmember Components from Spectral Data, which is a continuation application of U.S. application Ser. No. 10 / 821,928 filed on Apr. 12, 2004, and titled Method for Selecting Representative Endmember Components from Spectral Data, now U.S. Pat. No. 7,085,416 which is a continuation application of U.S. application Ser. No. 10 / 387,867 filed Mar. 14, 2003, and titled Method for Selecting Representative Endmember Components from Spectral Data, now U.S. Pat. No. 6,741,740, which is a continuation application of U.S. application Ser. No. 09 / 901,680 filed Jul. 11, 2001, and titled Method for Selecting Representative Endmember Components from Spectral Data, now U.S. Pat. No. 6,608,931.BACKGROUND OF THE INVENTION[0002]1. Field of the Invention[0003]The subject ...

Claims


Application Information

Patent Timeline
IPC IPC(8): G06K9/46G06K9/40G06K9/62G06V20/13
CPCG06K9/0063G06V20/13
Inventor SUNSHINE, JESSICA MIRIAMTOMPKINS, STEFANIEMCNARON-BROWN, KELLIE SUE
Owner LEIDOS
Why Eureka
Try Eureka