
System and method for visualizing connected temporal and spatial information as an integrated visual representation on a user interface

a temporal and spatial information and integrated visual representation technology, applied in the field of interactive visual presentation of multidimensional data on the user interface, can solve the problems of limited human short term memory, expensive technique, and limited techniqu

Active Publication Date: 2009-03-03
PEN LINK LTD
View PDF3 Cites 54 Cited by
  • Summary
  • Abstract
  • Description
  • Claims
  • Application Information

AI Technical Summary

Benefits of technology

[0007]Tracking and analyzing entities and streams of events, has traditionally been the domain of investigators, whether that be national intelligence analysts, police services or military intelligence. Business users also analyze events in time and location to better understand phenomenon such as customer behavior or transportation patterns. As data about events and objects become more commonly available, analyzing and understanding of interrelated temporal and spatial information is increasingly a concern for military commanders, intelligence analysts and business analysts. Contrary to present analysis tools, a system and method is provided for creating a multidimensional visual representation of a group of data elements having integrated temporal and spatial properties. The data elements are included in the visual representation as corresponding visual elements, such that the data elements of the group linked by at least one association. The system includes a visualization manager for assembling the group of data elements using the at least one association and for assigning a connection visual element in the visual representation between a first visual element representing a first data element of the group and a second visual element representing a second data element of the group. The system also has a spatial visualization component, such as a sprite, configured for generating a spatial domain of the visual representation to include a reference surface for providing a spatial reference frame having at least two spatial dimensions. The reference surface is for relating the first visual element to a first location of interest in the spatial reference frame and for relating the second visual element to a second location of interest in the spatial reference frame. The system also has a temporal visualization component, such as a sprite, configured for generating a temporal domain of the visual representation operatively coupled to the spatial domain, the temporal domain for providing a common temporal reference frame for the locations of interest. The temporal domain includes a first time track, such as a timeline, coupled to the first location of interest and a second time track coupled to the second location of interest, such that the first visual element is positioned on the first time track and the second visual element is positioned on the second time track. Each of the time tracks configured for visually representing a respective temporal sequence of a plurality of the data elements at each of the locations of interest of the reference surface. In implementation of the method, the connection visual element represents a distributed association in at least one of the domains between the first visual element and the second visual element such that the visual representation is displayed on a user interface for subsequent interaction with user events, including animation of the visual elements to help in the analysis of the data contained in the visual representation.

Problems solved by technology

However this technique relies on limited human short term memory to track and then retain temporal changes and patterns in the spatial domain.
This technique is expensive in terms of visual space since an image must be generated for each moment of interest, which can be problematic when trying to simultaneously display multiple images of adequate size that contain complex data content.
This technique is limited because it uses spiral timelines exclusively to show the periodic quality of certain types of events, while does not show connectivity between the temporal and spatial information of data objects at multi-locations within the spatial domain.
Further, event data objects placed on the spirals can suffer from occlusion, thereby providing for only a limited number of events and locations viewable with the spiral timelines.

Method used


Image

  • System and method for visualizing connected temporal and spatial information as an integrated visual representation on a user interface
  • System and method for visualizing connected temporal and spatial information as an integrated visual representation on a user interface
  • System and method for visualizing connected temporal and spatial information as an integrated visual representation on a user interface

Examples


Embodiment Construction

[0039]The following detailed description of the embodiments of the present invention does not limit the implementation of the invention to any particular computer programming language. The present invention may be implemented in any computer programming language provided that the OS (Operating System) provides the facilities that may support the requirements of the present invention. A preferred embodiment is implemented in the Java computer programming language (or other computer programming languages in conjunction with C / C++). Any limitations presented would be a result of a particular type of operating system, computer programming language, or data processing system and would not be a limitation of the present invention.

Visualization Environment

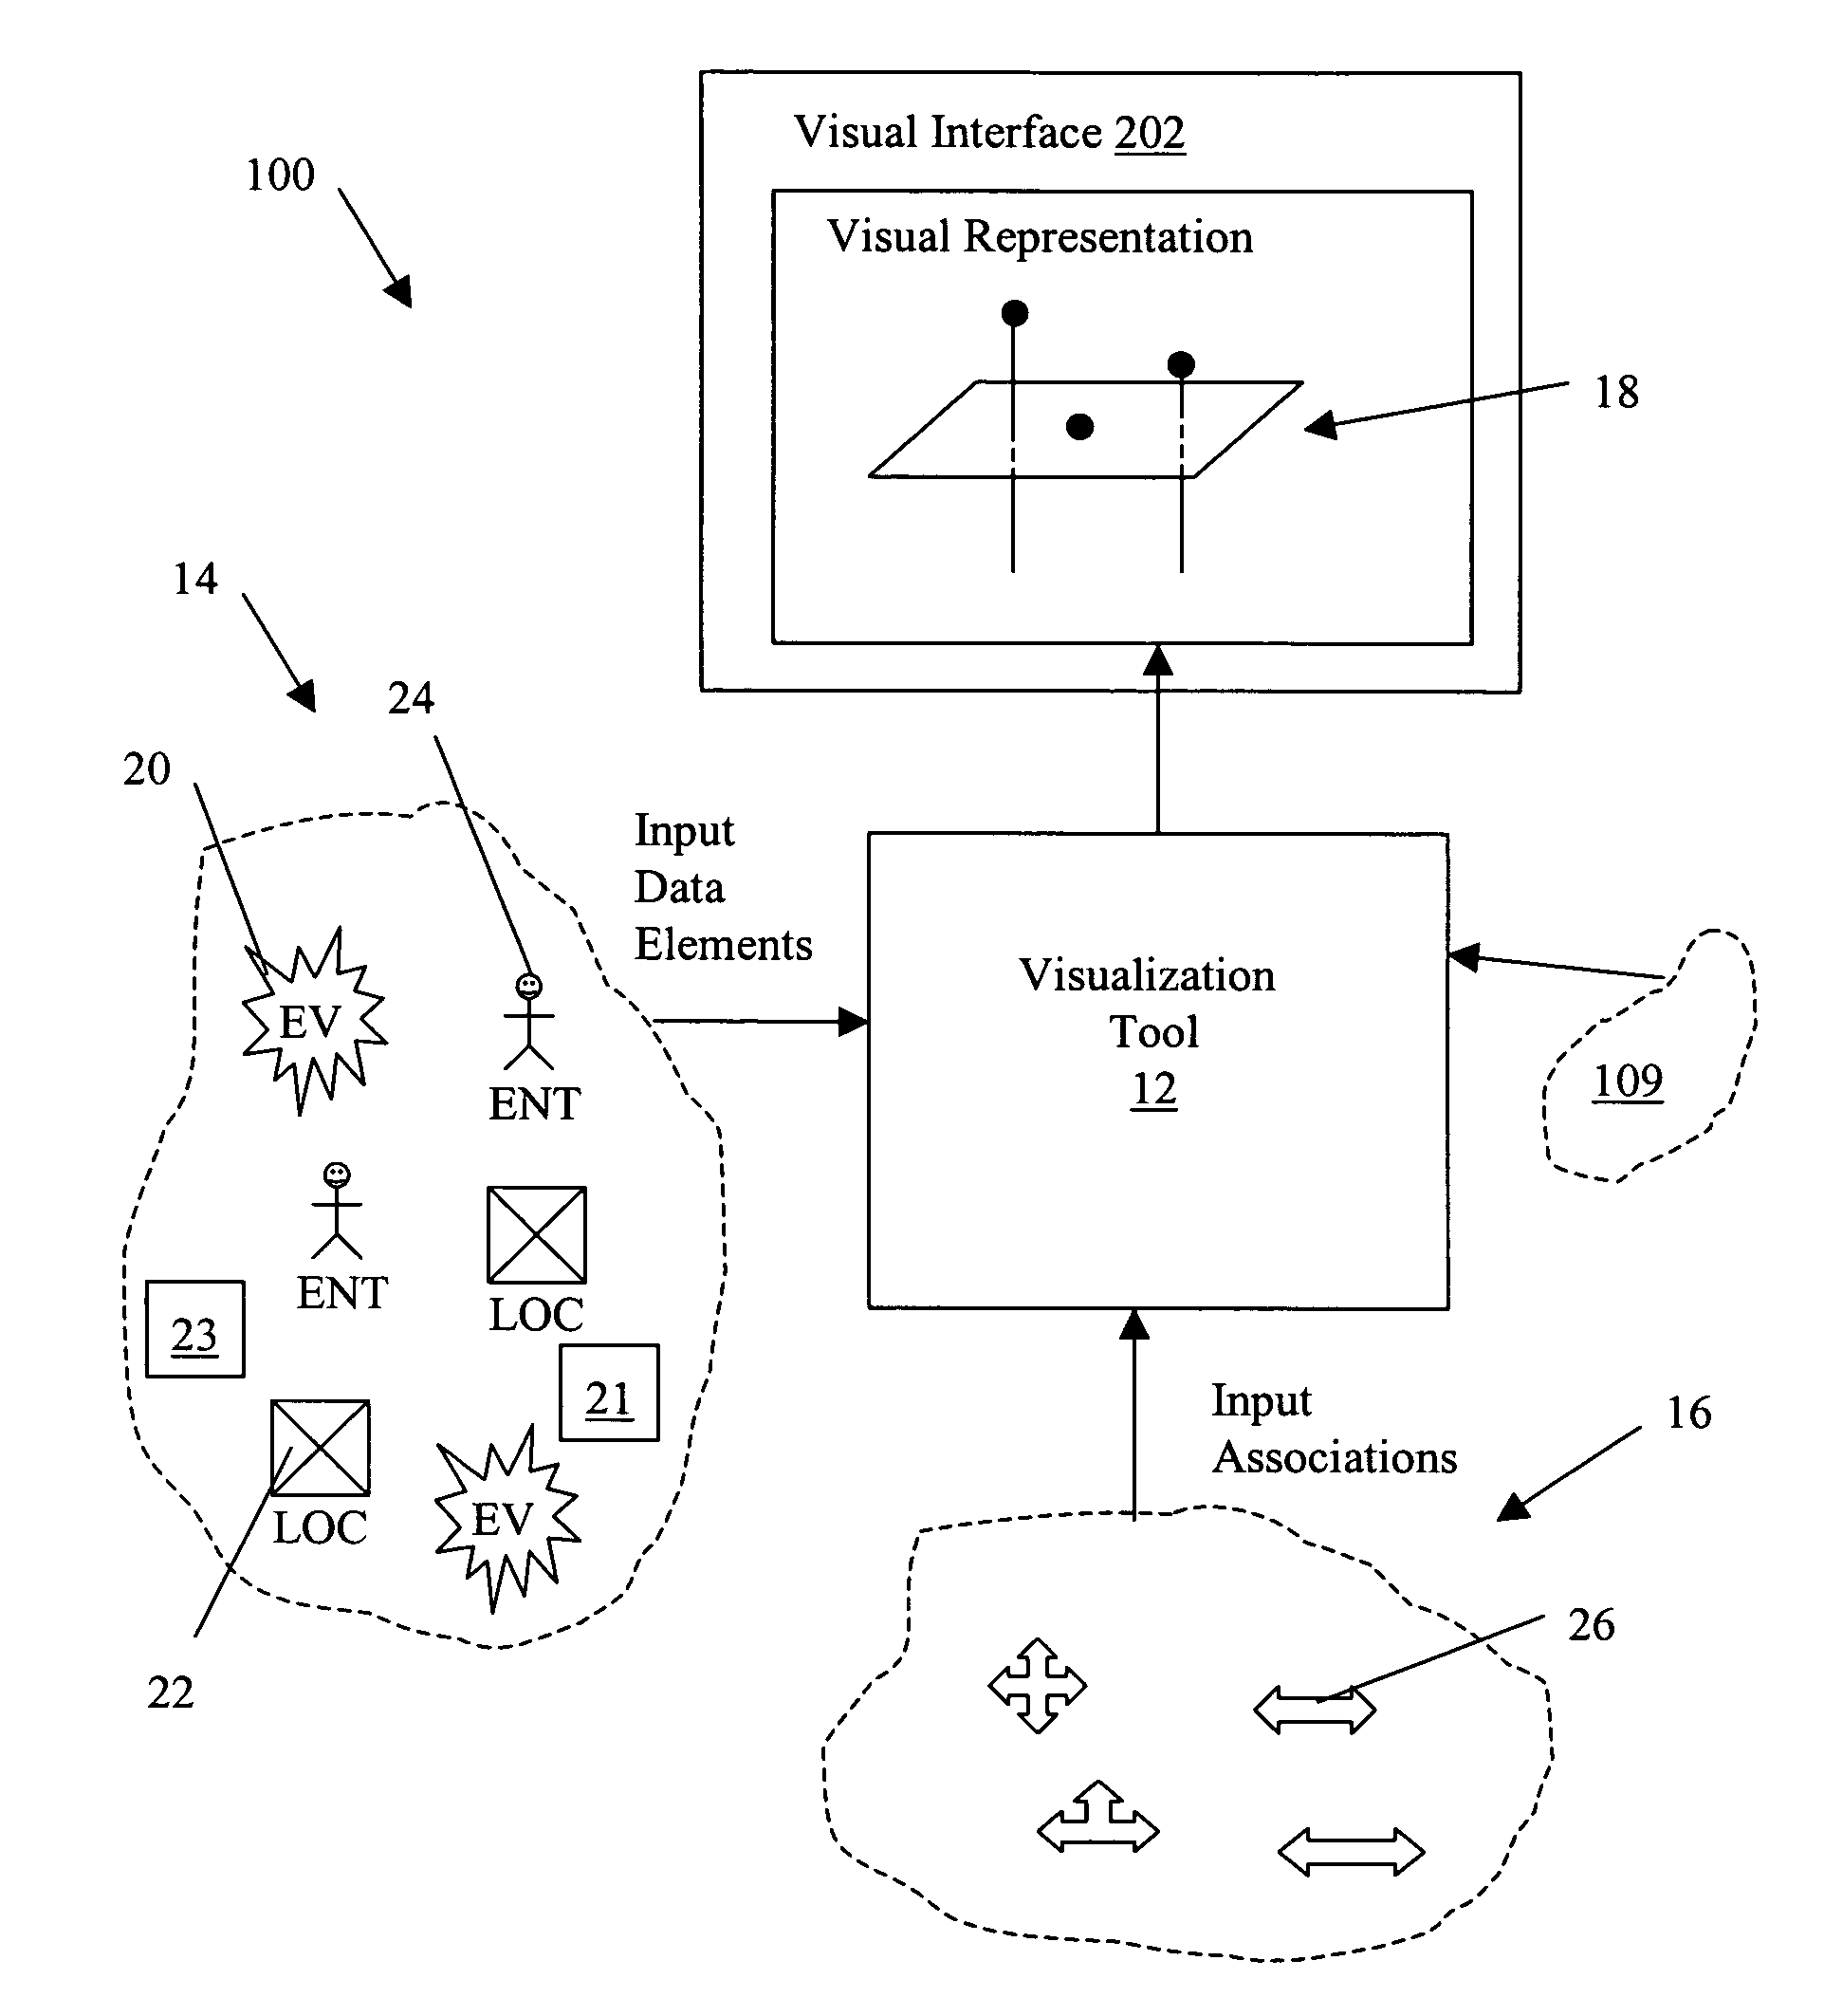
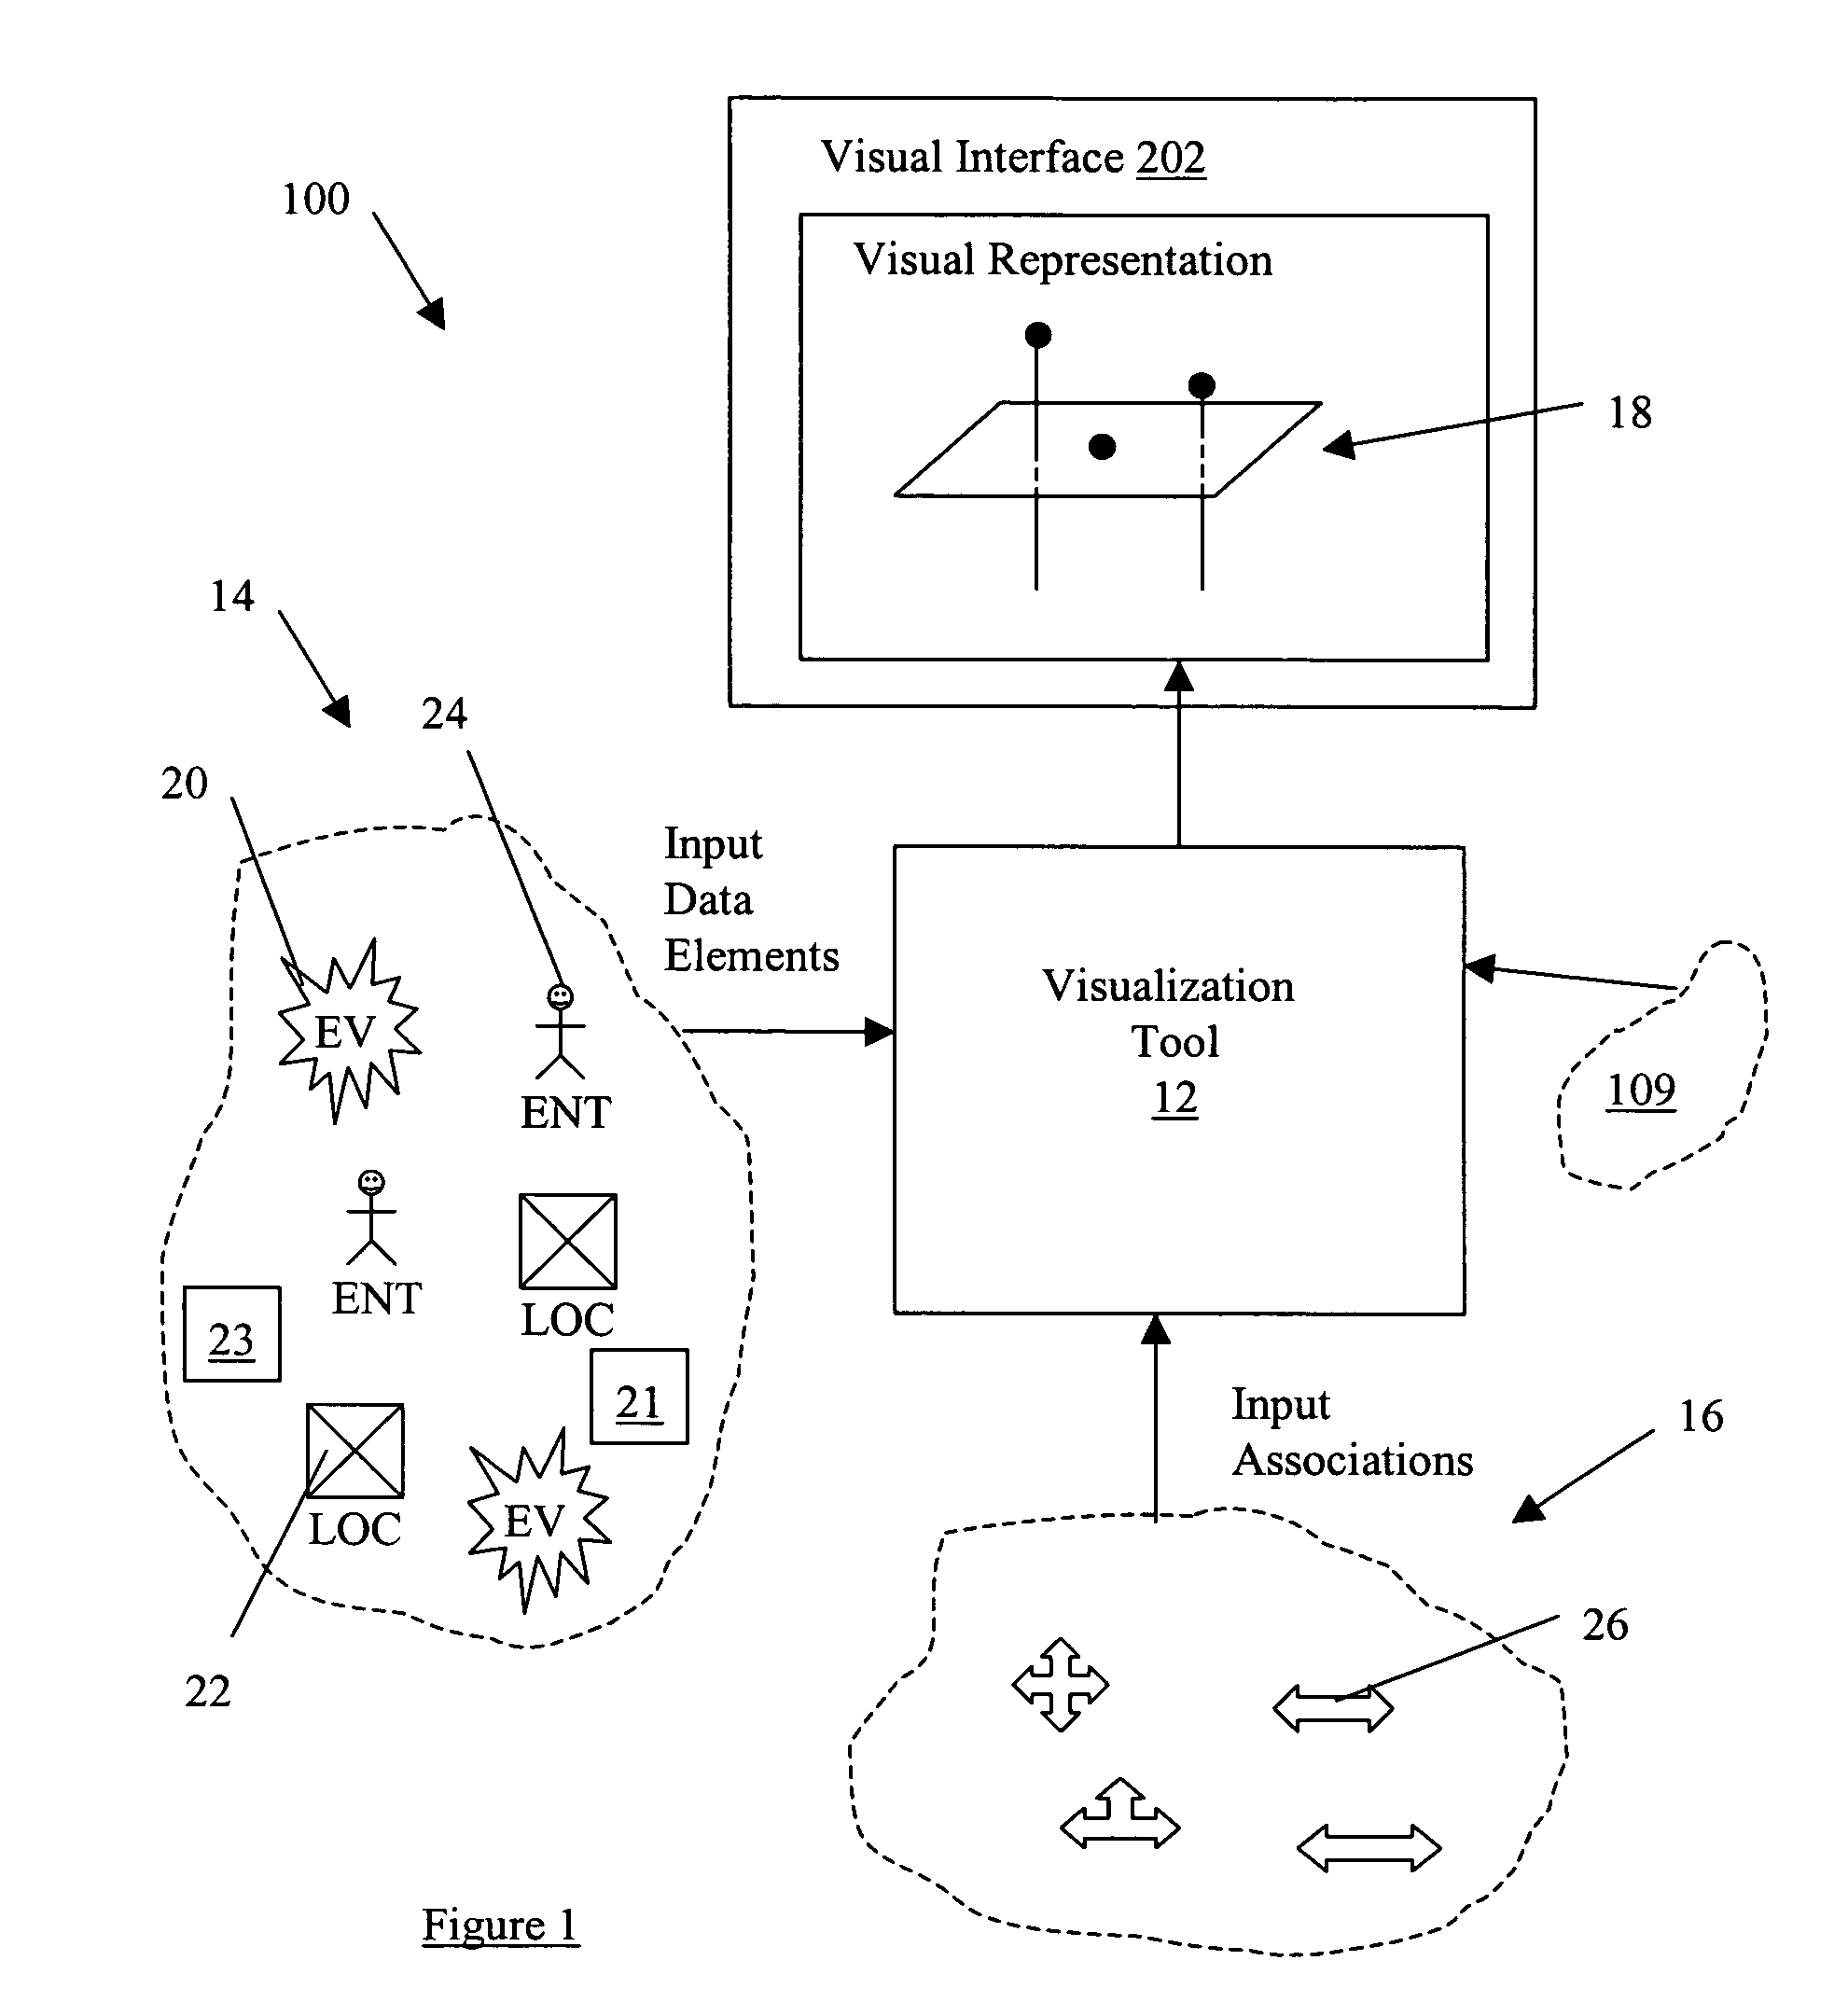
[0040]Referring to FIG. 1, a visualization data processing system 100 includes a visualization tool 12 for processing a collection of data objects 14 as input data elements to a user interface 202. The data objects 14 are combined with a ...


PUM


Abstract

A system includes a visualization manager for assembling the group of data elements and for assigning a connection visual element in the visual representation between a first visual element representing a first data element of the group and a second visual element representing a second data element of the group. The system also has a spatial visualization component configured for generating a spatial domain of the visual representation to include a reference surface for providing a spatial reference frame having at least two spatial dimensions. The reference surface is for relating the first visual element to a first location of interest in the spatial reference frame and for relating the second visual element to a second location of interest in the spatial reference frame. The system also has a temporal visualization component configured for generating a temporal domain of the visual representation operatively coupled to the spatial domain, the temporal domain for providing a common temporal reference frame for the locations of interest. The temporal domain includes a first time track, such as a timeline, coupled to the first location of interest and a second time track coupled to the second location of interest, such that the first visual element is positioned on the first time track and the second visual element is positioned on the second time track. Each of the time tracks are configured for visually representing a respective temporal sequence of a plurality of the data elements at each of the locations of interest of the reference surface.

Description

[0001]The present application claims the benefit of Canadian Patent Application No. 2,461,118 filed Mar. 15, 2004, is a Continuation in Part application of U.S. patent application Ser. No. 10 / 810,680 filed Mar. 29, 2004 and herein incorporated by reference, and claims the benefit of Canadian Patent Application No. 2,487,616 filed Nov. 16, 2004.BACKGROUND OF THE INVENTION[0002]The present invention relates to an interactive visual presentation of multidimensional data on a user interface.[0003]Tracking and analyzing entities and streams of events, has traditionally been the domain of investigators, whether that be national intelligence analysts, police services or military intelligence. Business users also analyze events in time and location to better understand phenomenon such as customer behavior or transportation patterns. As data about events and objects become more commonly available, analyzing and understanding of interrelated temporal and spatial information is increasingly a ...

Claims


Application Information

Patent Timeline
IPC IPC(8): G06T1/00G06T15/00
CPCG06F17/30029G06F17/30061G06F17/30064G06F17/30241G06F16/29G06F16/435G06F16/444G06F16/447
Inventor WRIGHT, WILLIAMKAPLER, THOMAS
Owner PEN LINK LTD
Learn More