QT-interval measurement in the electrocardiogram

Inactive Publication Date: 2009-12-01
PSI HEARTSIGNALS GLOBAL
View PDF12 Cites 32 Cited by
  • Summary
  • Abstract
  • Description
  • Claims
  • Application Information

AI Technical Summary

Benefits of technology

[0021]The step (b) may comprise calculating the median signal for each time from an ensemble of ECG signals for each lead to reduce low frequency basel

Problems solved by technology

Although the onset of the QT interval can be accurately measured by existing methods, there are difficulties measuring the accurate timing of the end of the “T wave” of the ECG due to the low frequency nature of the waveform, superaddition of an ECG “U wave”, baseline drift of the signal and other superadded high frequency noise.
However, they are not considered any more accurate than expert manual measurements hence they can give reproducibly wrong measuremen

Method used


Image

  • QT-interval measurement in the electrocardiogram
  • QT-interval measurement in the electrocardiogram
  • QT-interval measurement in the electrocardiogram

Examples


Embodiment Construction

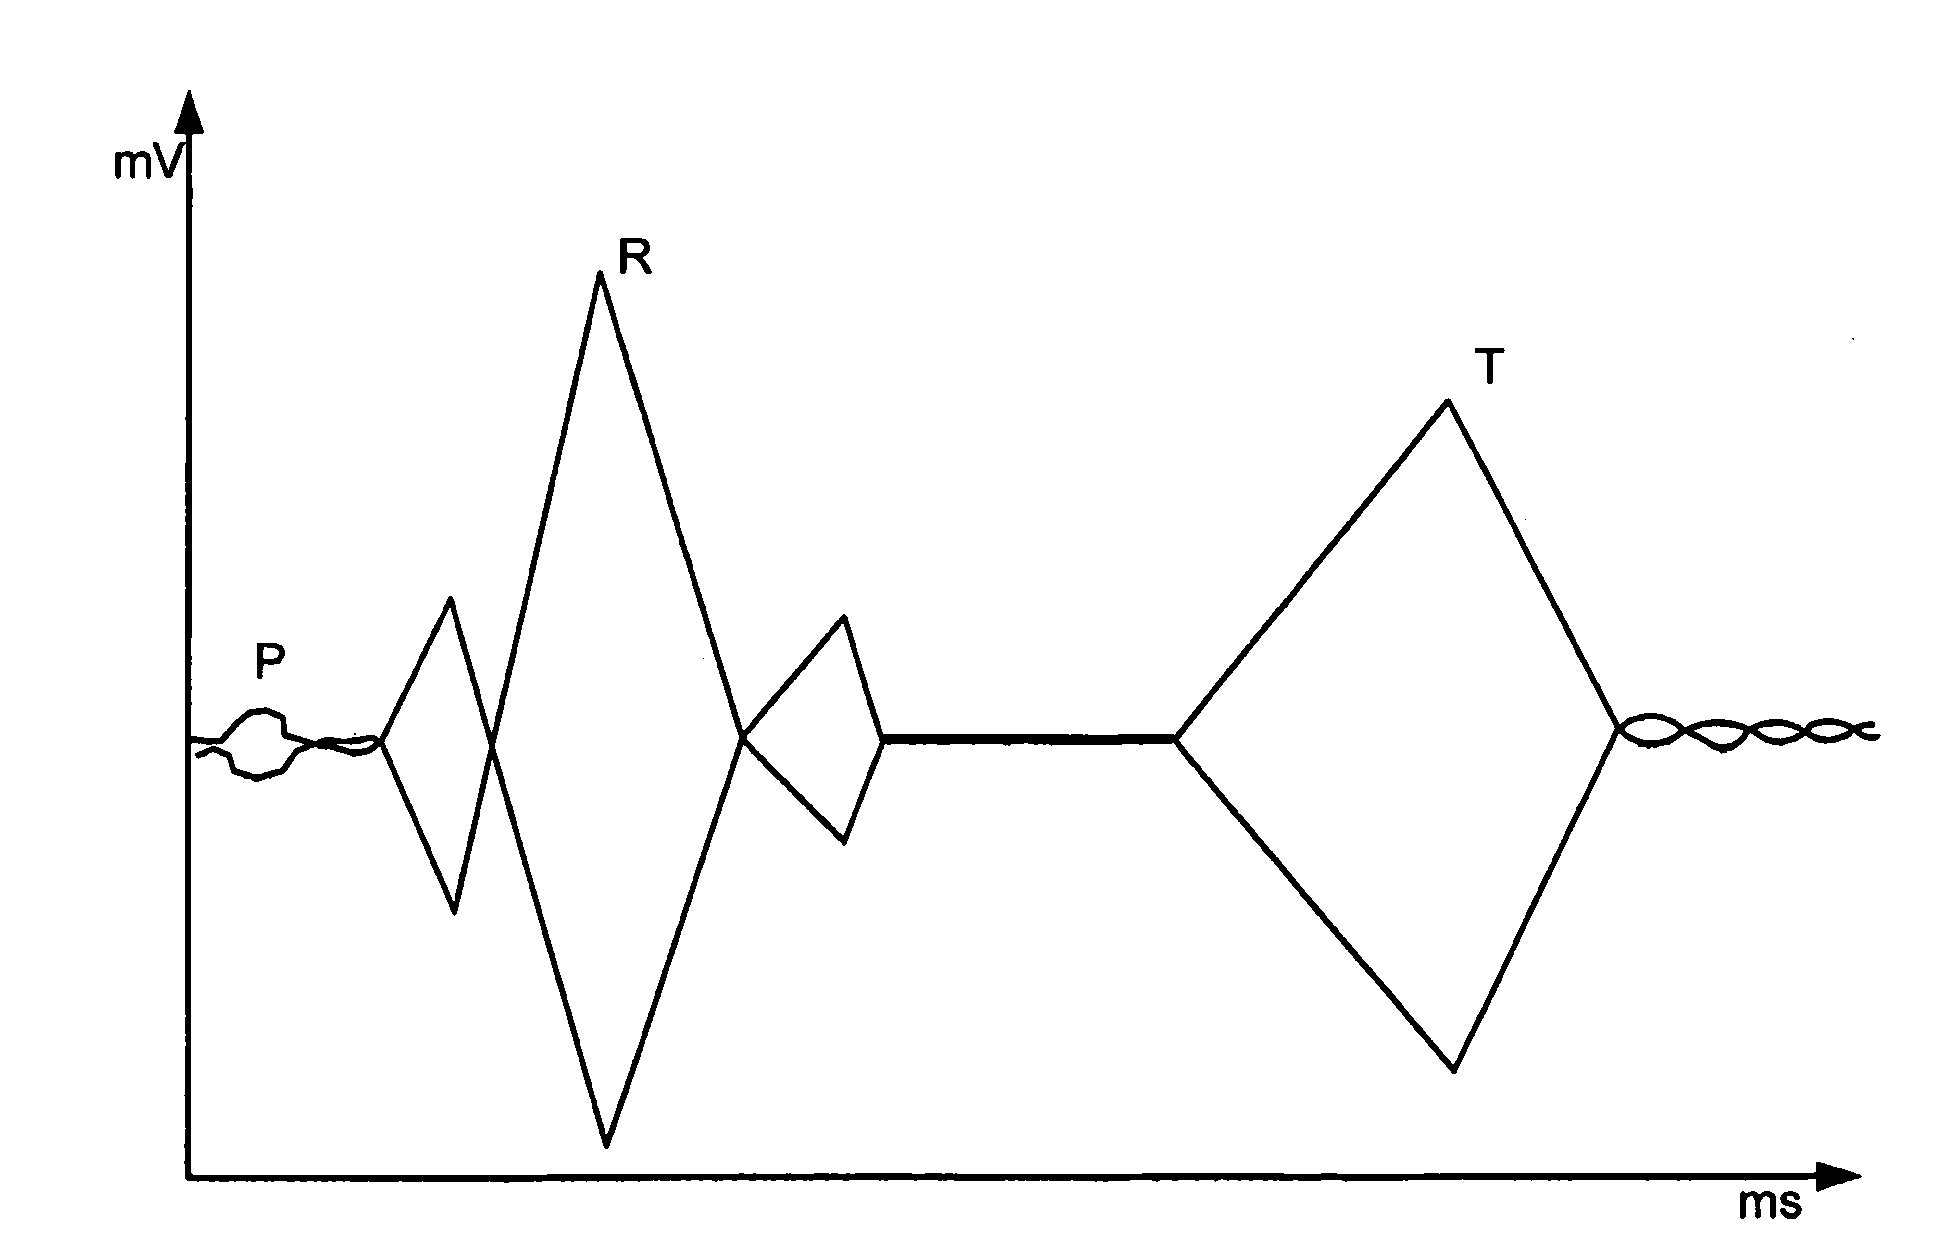
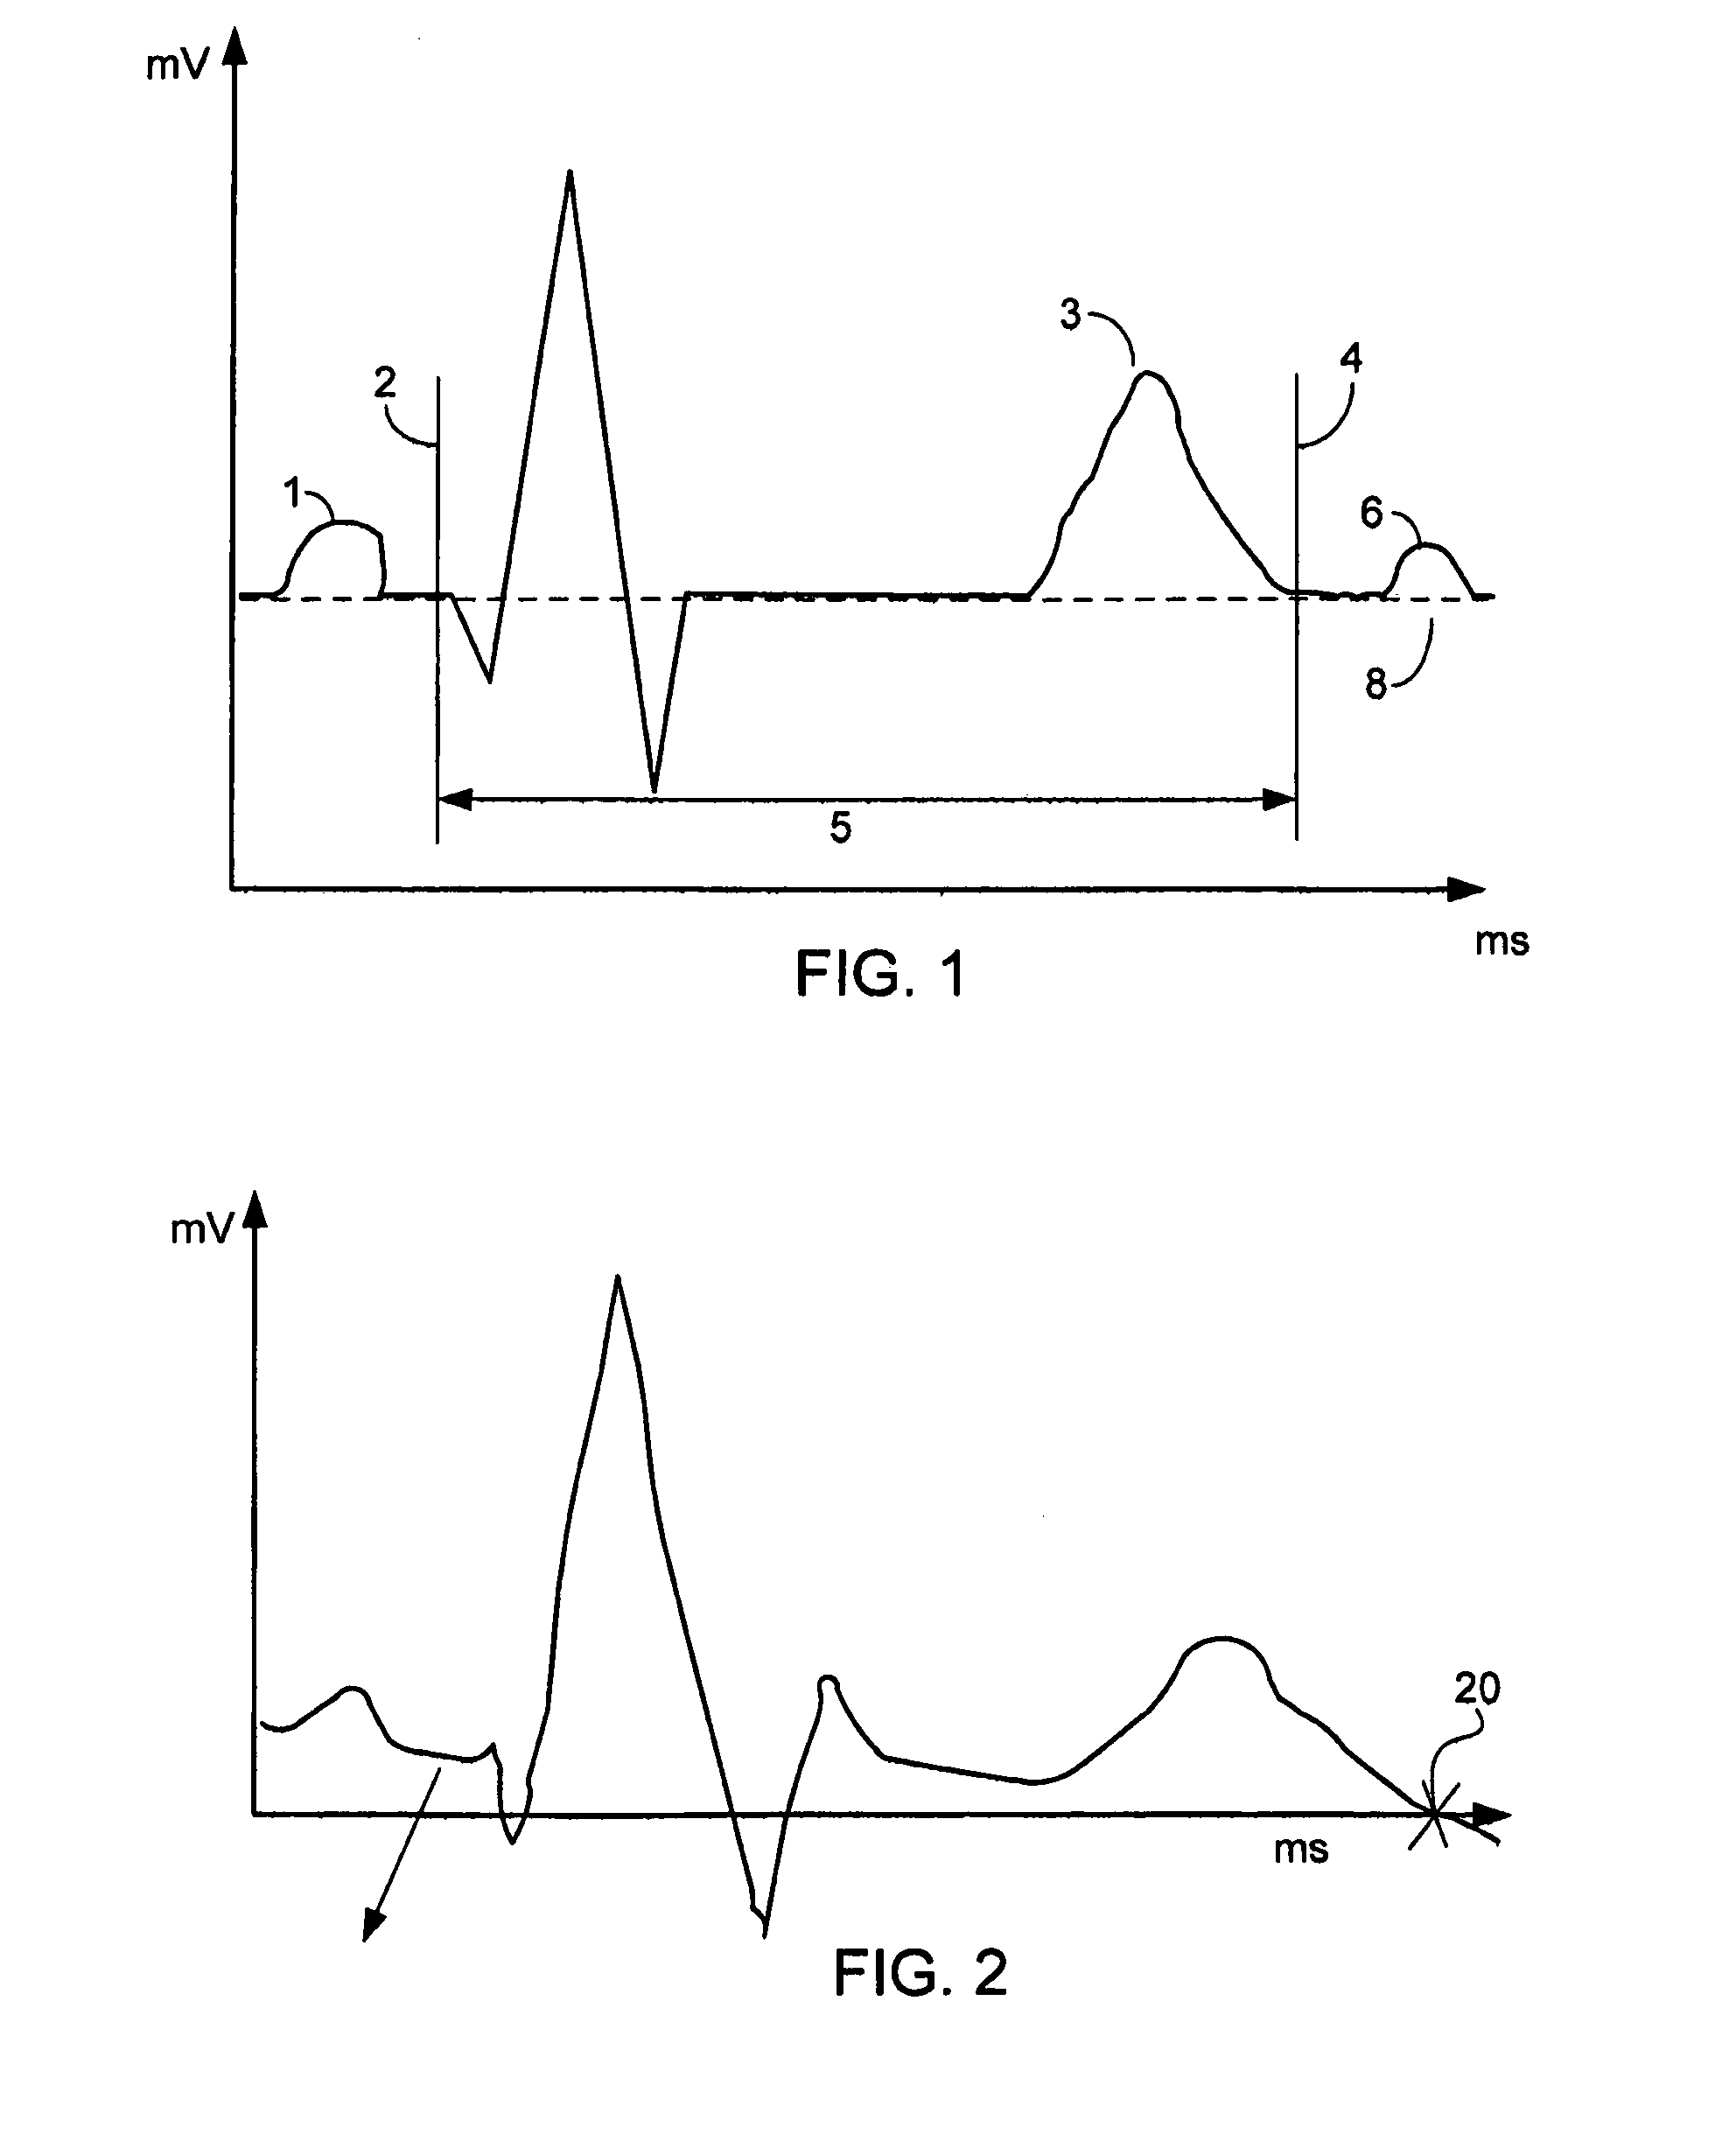
[0042]FIG. 1 represents schematically the trace of a typical ECG signal, showing a single lead vector ECG signal. 1 is the P wave, 2 is the onset deflection of the Q wave (the start of the QT interval), 3 is the peak of the T wave, 4 is the approximate end of the QT interval, 5 is the QT interval duration to be measured, and 6 is the U wave. 8 is the isoelectric baseline of the ECG signal.

[0043]The X-axis represents time in milliseconds and the Y-axis represents millivolts above and below the isoelectric line baseline. The isoelectric line baseline is the voltage at which there is silent electrical activity within the myocardium, this being theoretically zero millivolts in the absence of noise.

[0044]The start of the QT interval is easily timed at 2 when the wave has high frequency content with a negative or positive deflection from a zero baseline value. The end of the QT interval is in theory the time at which the T wave returns to the isoelectric baseline. The isoelectric baseline...


PUM


Abstract

A method and apparatus for measuring the QT interval of an electrocardiogram (ECG) signal is provided wherein the end of the T wave is identified from ECG data. The end of the T wave is defined as the first time of intersection at which an upright T wave of a first set of derived ECG signal data intersects an inverted T wave of a second set of derived ECG signal data. The intersection of the two sets of ECG data is along an isoelectric line within the trough after the positive T wave peak when the superimposed isoelectric baselines from the upright and inverted ECG signals demonstrate the best least squares fit.

Description

CROSS-REFERENCE TO RELATED APPLICATIONS[0001]This application is a Section 371 filing of International Application No. PCT / GB2003 / 004436 filed Oct. 10, 2003 and published in English as WO 2005 / 044102 A1on May 19, 2005, which application is incorporated herein by reference, in its entirety.BACKGROUND OF THE INVENTION[0002]The present invention relates to methods and apparatus for measuring the QT interval on an electrocardiogram.[0003]An electrocardiogram (ECG) measures the instantaneous voltage potential difference of myocardial electrical activity in a number of lead vectors. “Leads” (or signals) are obtained from a subject using electrodes placed on their skin, placed on standardised locations around the body. Each electrode is connected to a signal processing apparatus via a respective wire (or “lead”). The term “lead” commonly refers to either a physical wire to an electrode or to an ECG signal itself. Commonly 12 different leads are used although it is also known to collapse al...

Claims


Application Information

Patent Timeline
IPC IPC(8): A61B5/0452
CPCA61B5/0452A61B5/349A61B5/36
Inventor HUNT, ANTHONY CHARLES
Owner PSI HEARTSIGNALS GLOBAL
Why Eureka
Try Eureka