Method for factor analysis of GC/MS data

Active Publication Date: 2012-09-11
NAT TECH & ENG SOLUTIONS OF SANDIA LLC
View PDF6 Cites 21 Cited by
  • Summary
  • Abstract
  • Description
  • Claims
  • Application Information

AI Technical Summary

Benefits of technology

[0010]The present invention is directed a method for factor analysis of GC/MS data, comprising measuring a mass-charge (m/z) spectrum of a sample with a gas chromatograph/mass spectrometer (GC/MS), whereby the spectrum is represented a matrix of GC/MS data; factoring the data matrix into the product orthogonal scores vectors, representing mass spectral space, and orthonormal loading vectors, representing chromatographic space, using Principal Component Analysis (PCA); and rotating the PCA solution to provide more realistic factors. In general, the pseudo

Problems solved by technology

One of the remaining obstacles to adopting these techniques for routine use is the difficulty of reducing the vast quantities of raw spectral data to meaningful chemical information.
It is well known, however, that factor-based methods suffer from a “rotational ambiguity.” Given any invertible p×p transformation ma

Method used


Image

  • Method for factor analysis of GC/MS data
  • Method for factor analysis of GC/MS data
  • Method for factor analysis of GC/MS data

Examples


Embodiment Construction

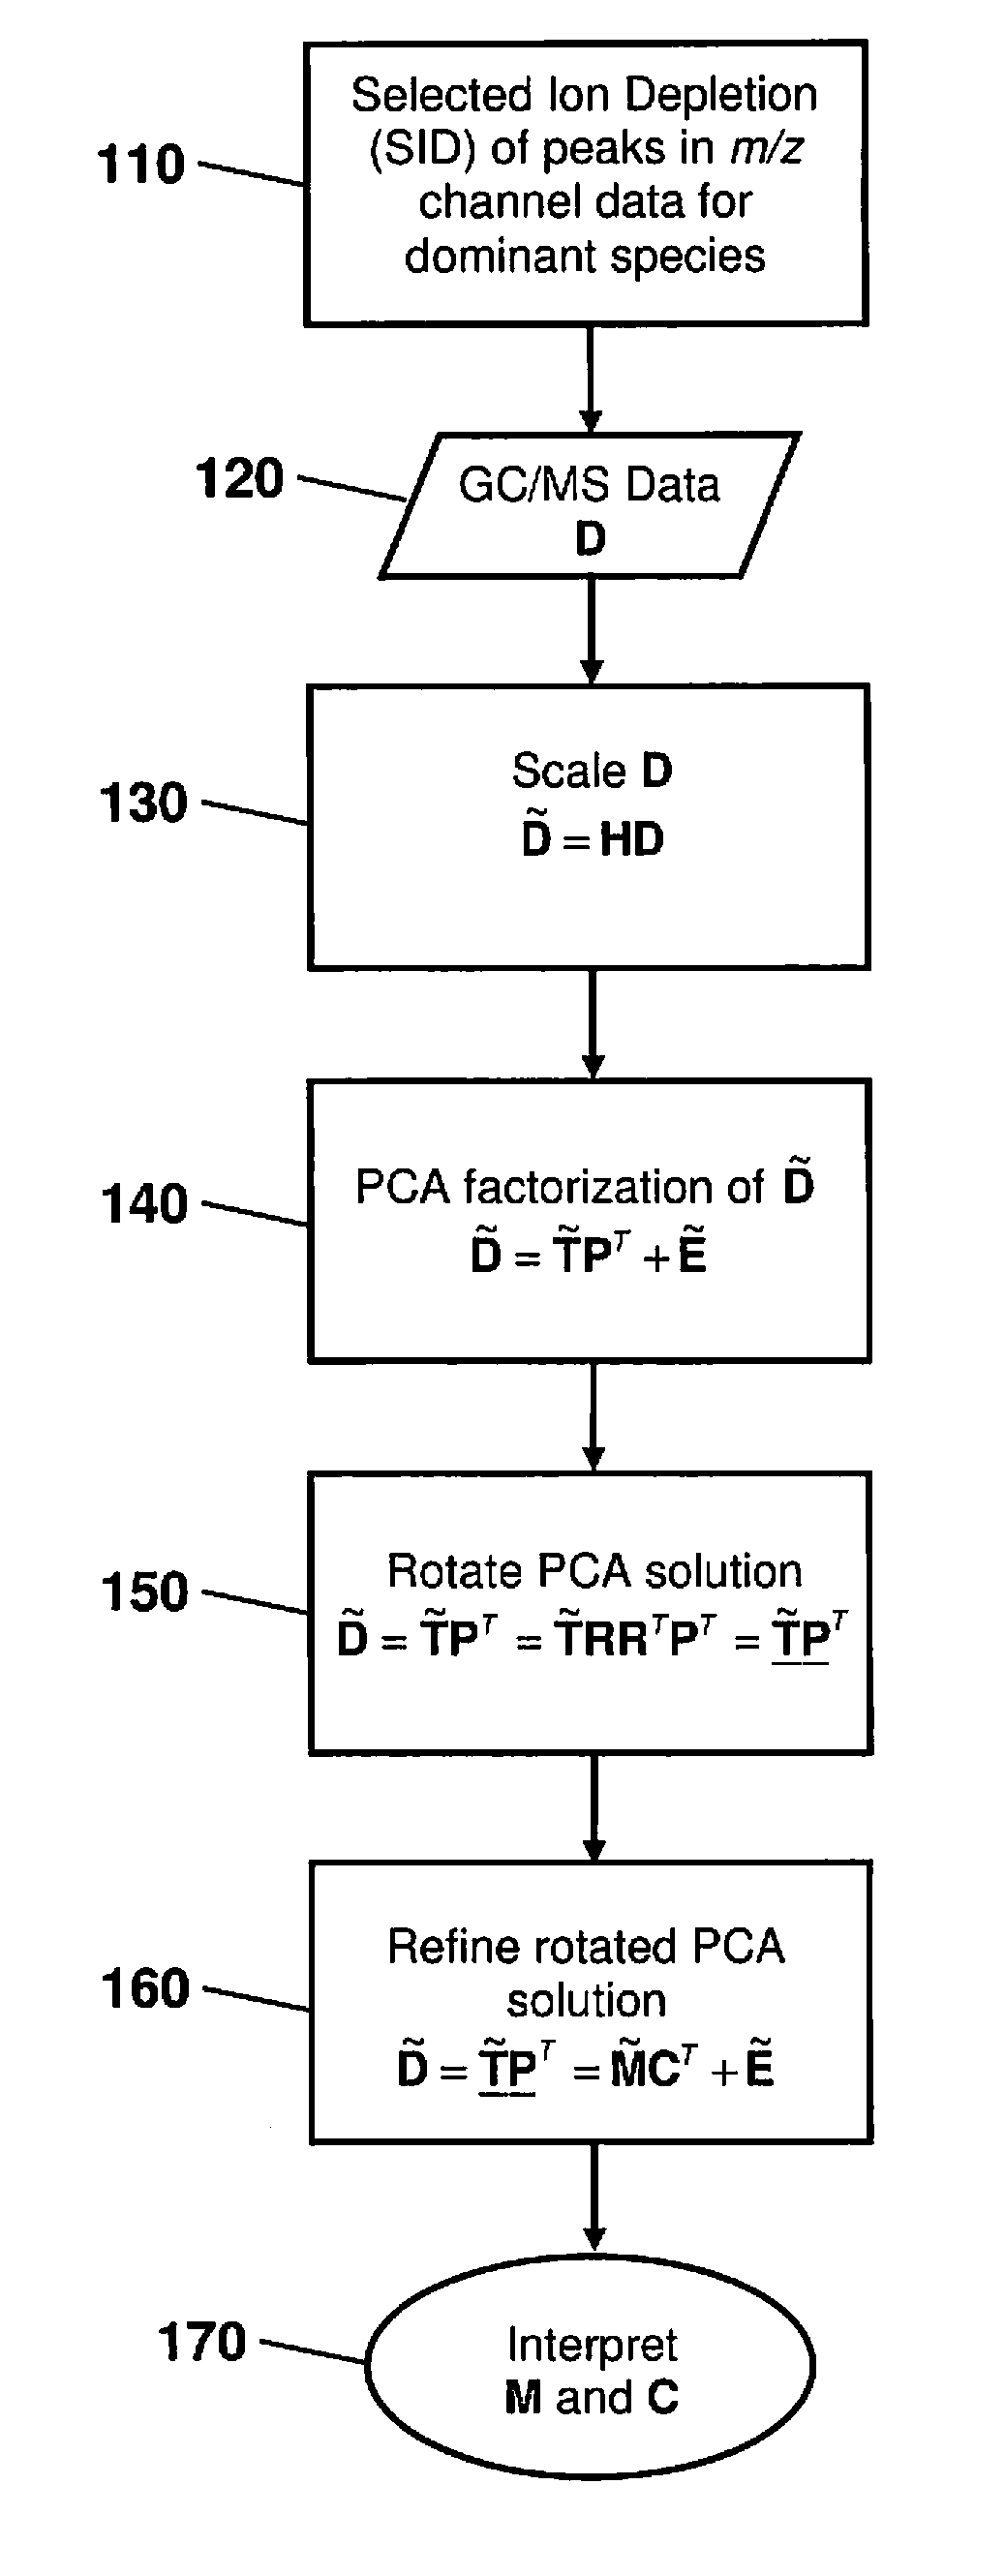
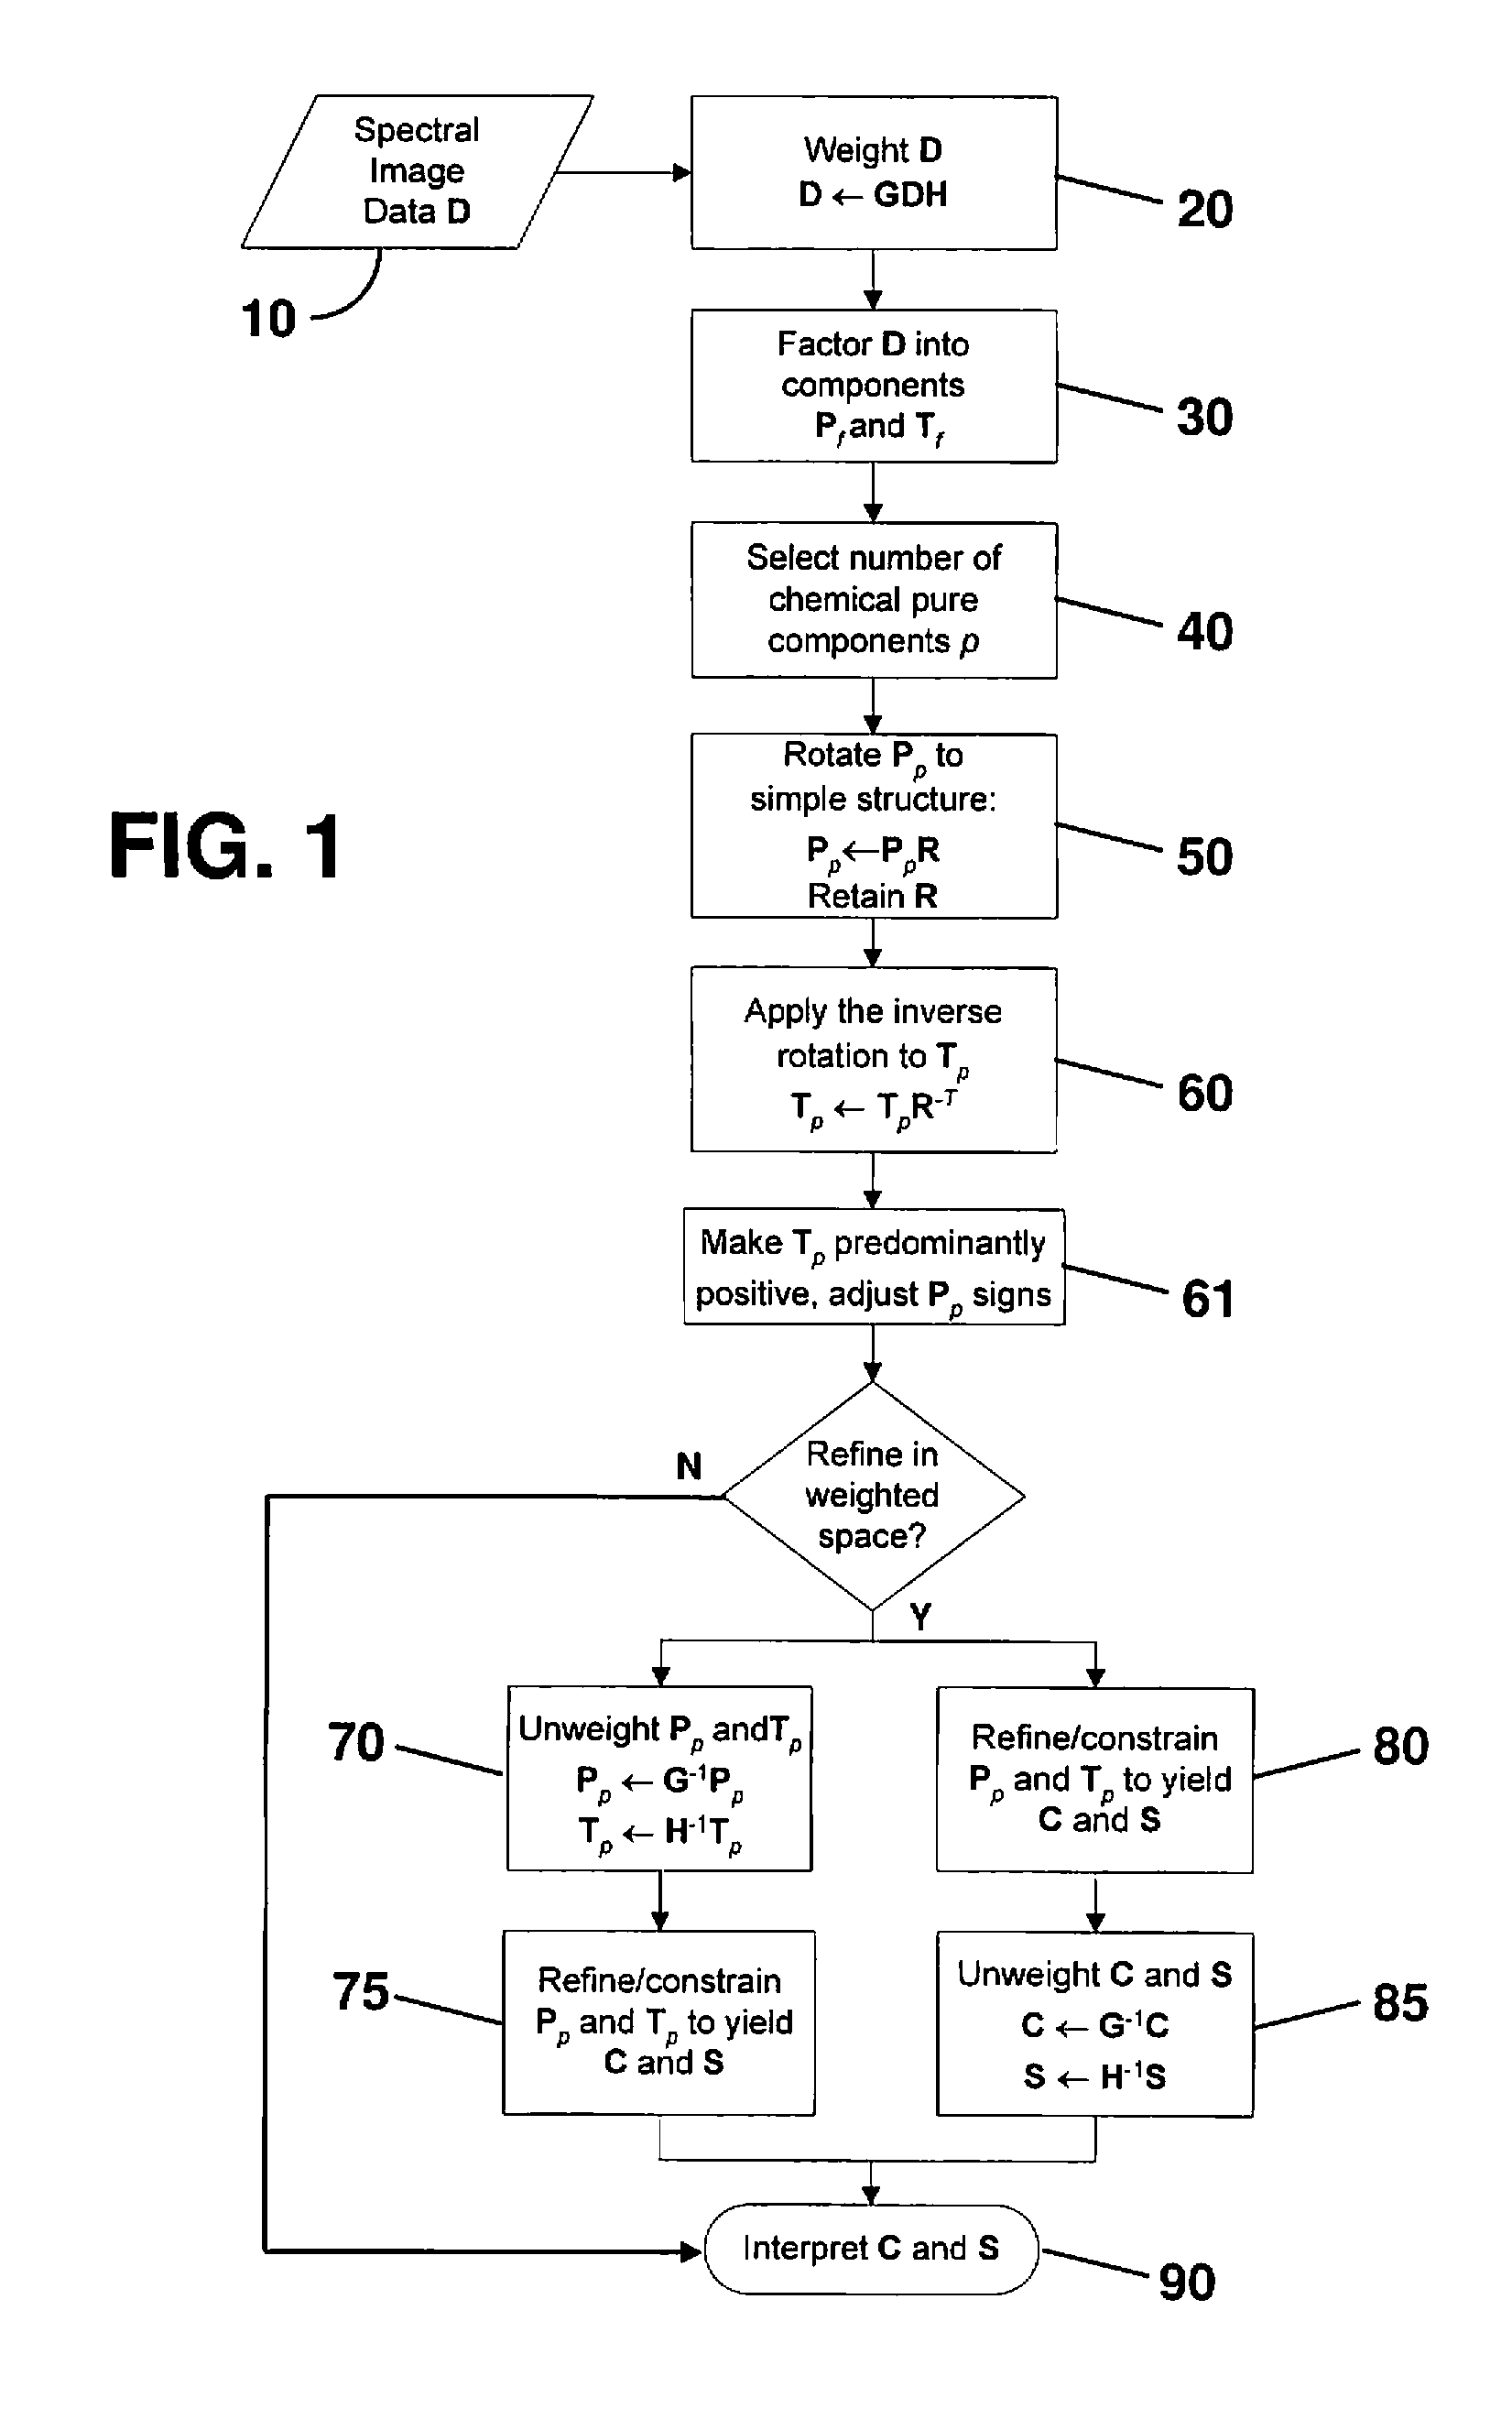
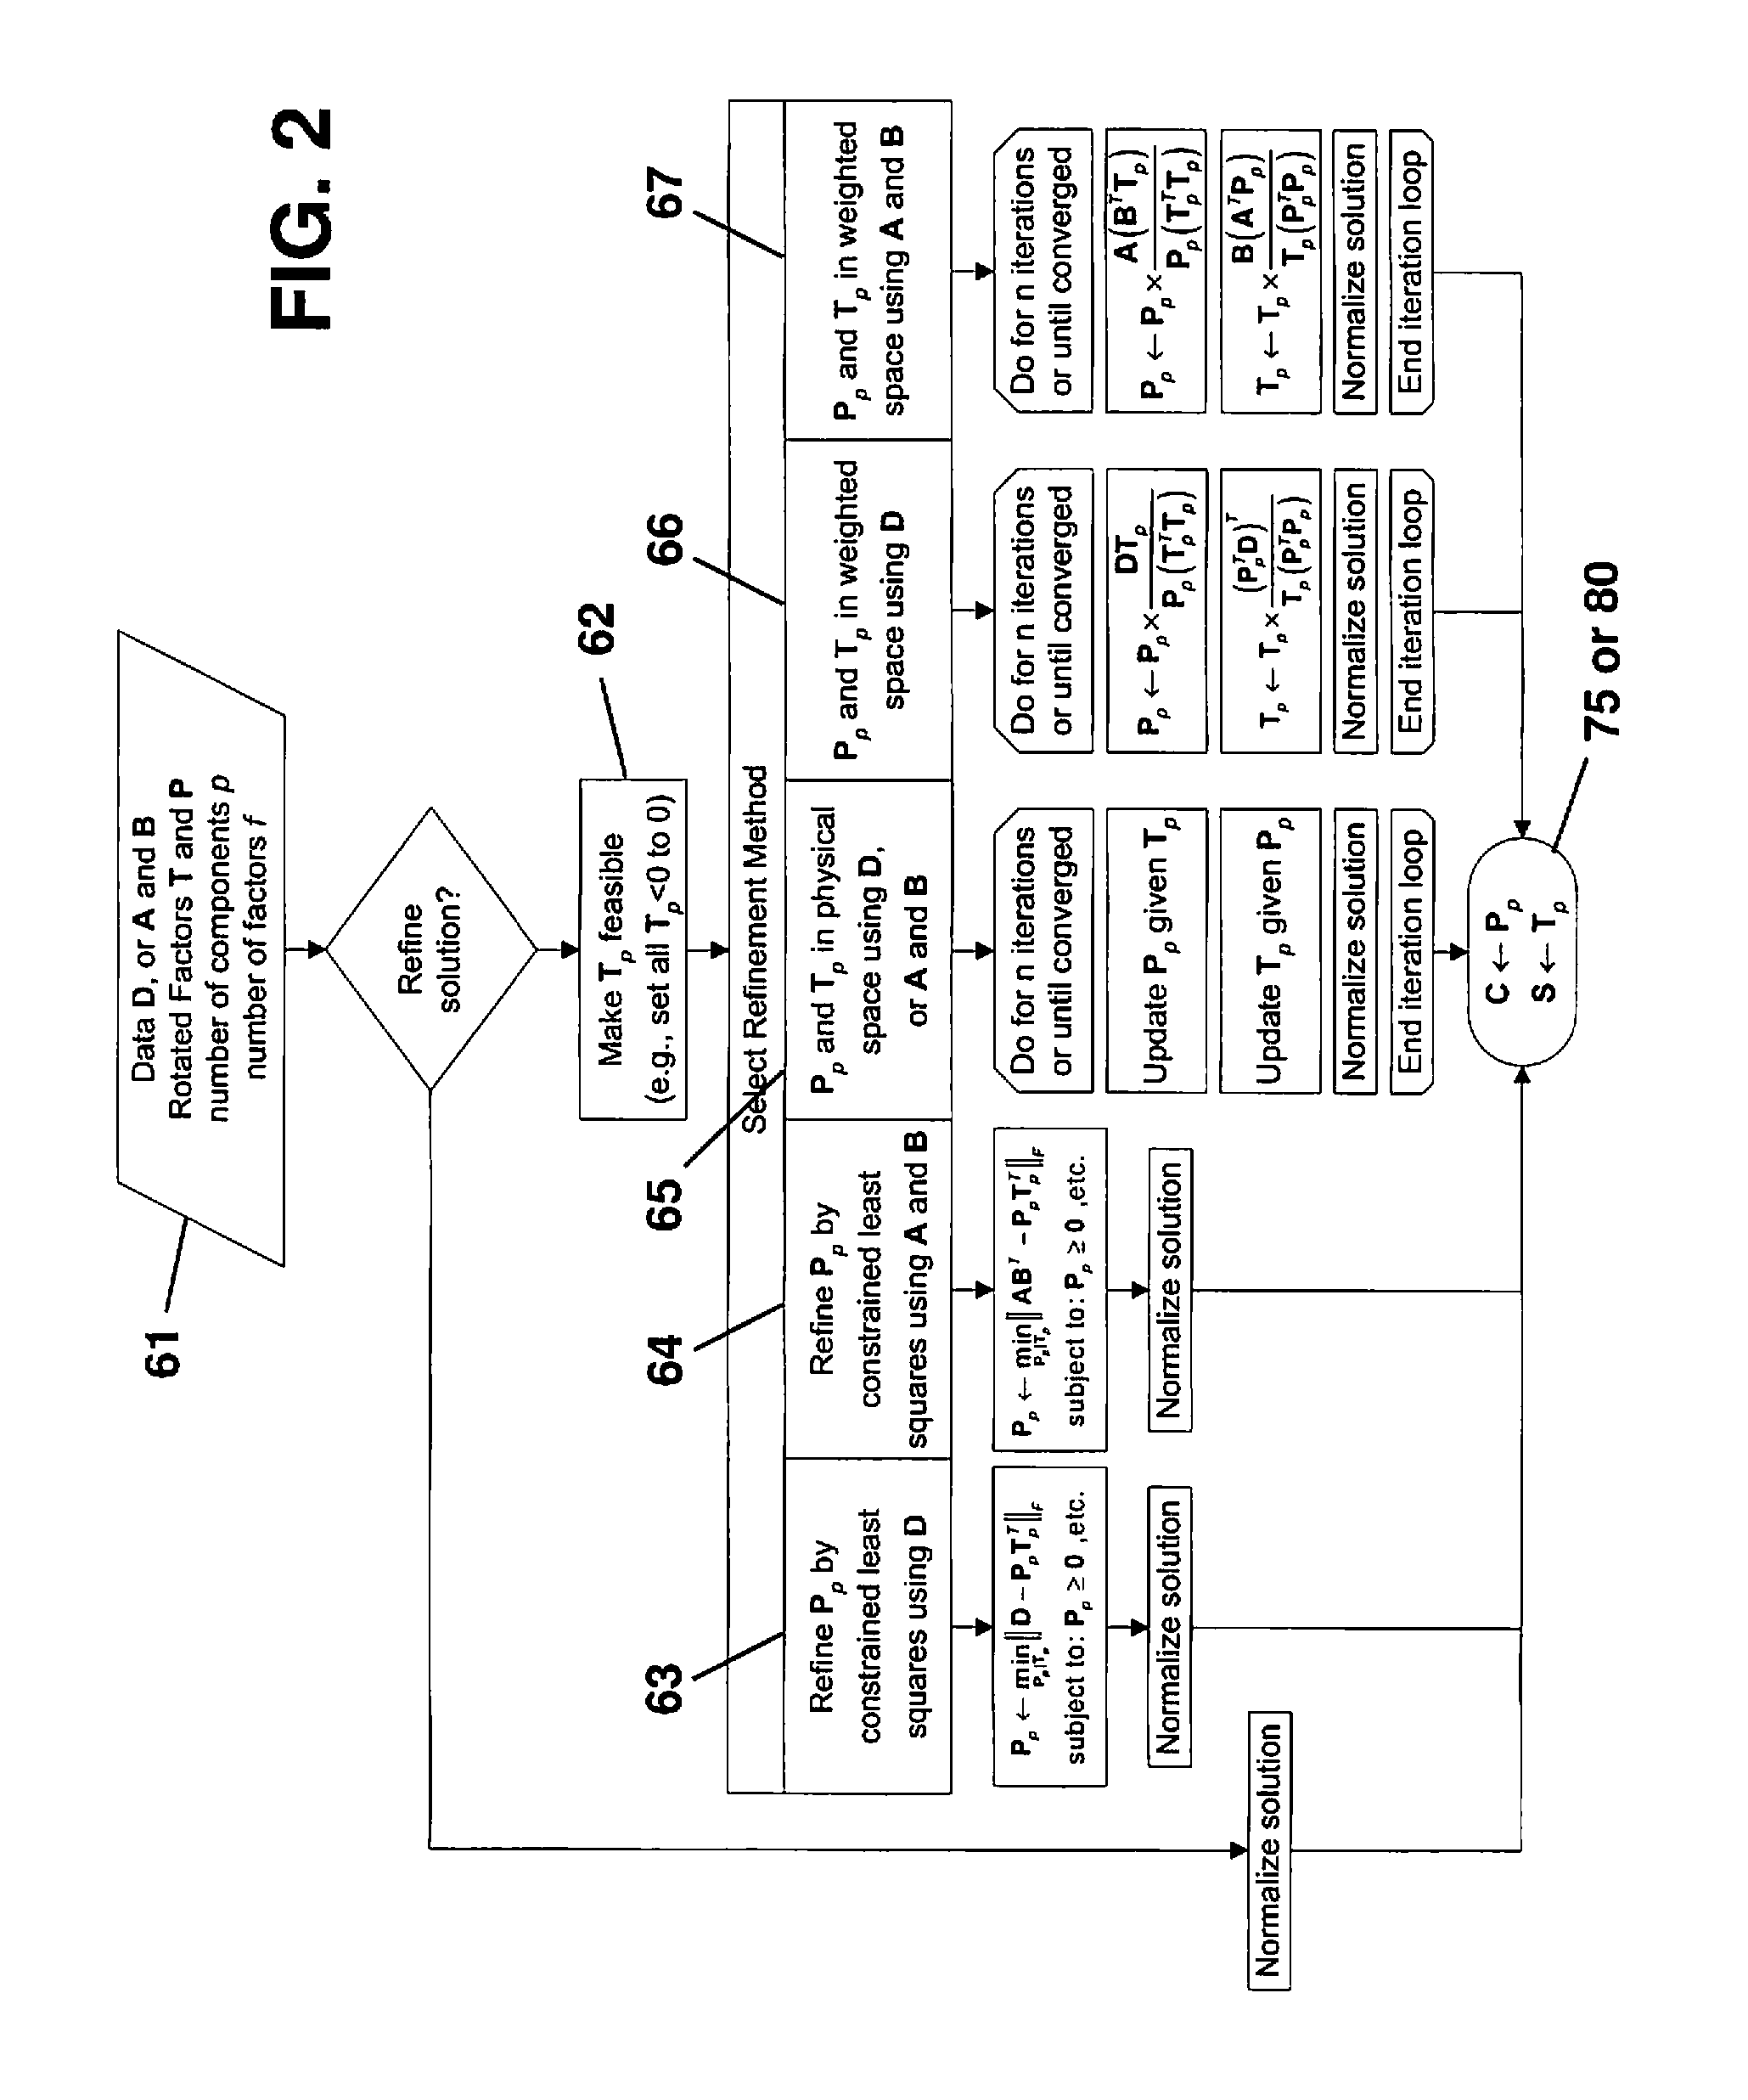
[0024]In general, an image can comprise any arbitrary, multidimensional array of points. The image can include a spatial dimension, such as lines, traditional 2D images, or 3D volumes; or a temporal dimension, such as a time series of images. For example, in the case of Energy Dispersive X-ray (EDS) images, the spatial dimension is a 2D pixel array. In the case of a GC / MS image, the temporal dimension is a separation coordinate. The description that follows will begin with a description of a generalized multivariate image analysis method as applied to a spatial dimension. This generalized method is described more fully in U.S. application Ser. No. 11 / 233,223, which is incorporated herein by reference. This general description is then followed by a detailed description of an application of the method to the factor analysis of GC / MS data, comprising a temporal dimension or chromatographic separation coordinate.

Method for Spectral Image Analysis by Exploiting Spatial Simplicity

[0025]Mu...


PUM


Abstract

The method of the present invention provides a fast, robust, and automated multivariate statistical analysis of gas chromatography/mass spectroscopy (GC/MS) data sets. The method can involve systematic elimination of undesired, saturated peak masses to yield data that follow a linear, additive model. The cleaned data can then be subjected to a combination of PCA and orthogonal factor rotation followed by refinement with MCR-ALS to yield highly interpretable results.

Description

CROSS-REFERENCE TO RELATED APPLICATIONS[0001]This application is a continuation-in-part of application Ser. No. 11 / 233,223, filed Sep. 22, 2005, now U.S. Pat. No. 7,725,517, which claims the benefit of U.S. Provisional Application No. 60 / 614,867, filed Sep. 29, 2004, both of which are incorporated herein by reference.STATEMENT OF GOVERNMENT INTEREST[0002]This invention was made with Government support under contract no. DE-AC04-94AL85000 awarded by the U.S. Department of Energy to Sandia Corporation. The invention was made with the support of the U.S. Department of Homeland Security through interagency agreement no. HSHQDC-10-00041 with the U.S. Department of Energy. The Government has certain rights in the invention.FIELD OF THE INVENTION[0003]The present invention relates to spectral image analysis and, in particular, to a method for factor analysis of gas chromatography / mass spectroscopy (GC / MS) data.BACKGROUND OF THE INVENTION[0004]Several full-spectrum imaging techniques have b...

Claims


Application Information

Patent Timeline
IPC IPC(8): G06F7/38G01N31/10
CPCG01N23/223G01N30/8686G01N30/7206G01N2223/076G01N2223/611
Inventor VAN BENTHEM, MARK H.KOTULA, PAUL G.KEENAN, MICHAEL R.
Owner NAT TECH & ENG SOLUTIONS OF SANDIA LLC
Why Eureka
Try Eureka