
Detection of selected defects in relatively noisy inspection data

Active Publication Date: 2016-05-31
KLA TENCOR CORP
View PDF26 Cites 22 Cited by
  • Summary
  • Abstract
  • Description
  • Claims
  • Application Information

AI Technical Summary

Benefits of technology

This patent describes a computer-implemented method for detecting defects on a substrate using a spatial filter algorithm. The method involves applying a spatial filter algorithm to inspection data acquired across an area on the substrate to determine a first portion of the inspection data that has a higher probability of being a selected type of defect than a second portion of the inspection data. The selected type of defect includes a non-point defect. The method also includes generating a two-dimensional map illustrating the first portion of the inspection data and searching the map for an event that has spatial characteristics that match those of the selected type of defect. The event that matches the selected type of defect is determined to be the defect. The method can be performed using a computer system and a computer-readable medium storing program instructions executable on a computer system. The technical effect of this patent is to provide a reliable and accurate method for detecting defects on substrates with greater precision and accuracy.

Problems solved by technology

For instance, on many commercially available inspection systems, defects are found by detecting point defects via signal thresholding on individual data points in simple one-dimensional scans.
There are, however, several disadvantages to the above methods of inspection data processing for detecting the presence of particular types of defects.
In particular, these methods can be relatively inaccurate when detecting defects in relatively noisy inspection data.
Consequently, portions of faint two-dimensional defects may be lost to background noise due to failure of some of its associated point defect signals to exceed the threshold.
As a result, the above-described methods for detecting defects may be substantially inaccurate when detecting defects in noisy inspection data since many defects may not be detected at all.
In addition, the above-described methods for detecting defects may be substantially inaccurate in detecting the types of defects that are present on a substrate since portions of defects may not be detected thereby increasing the probability of misclassification of defects.

Method used


Image

  • Detection of selected defects in relatively noisy inspection data
  • Detection of selected defects in relatively noisy inspection data
  • Detection of selected defects in relatively noisy inspection data

Examples


Embodiment Construction

[0021]Turning now to the drawings, it is noted that the figures are not drawn to scale. In particular, the scale of some of the elements of the figures is greatly exaggerated to emphasize characteristics of the elements. It is also noted that the figures are not drawn to the same scale. Elements shown in more than one figure that may be similarly configured have been indicated using the same reference numerals.

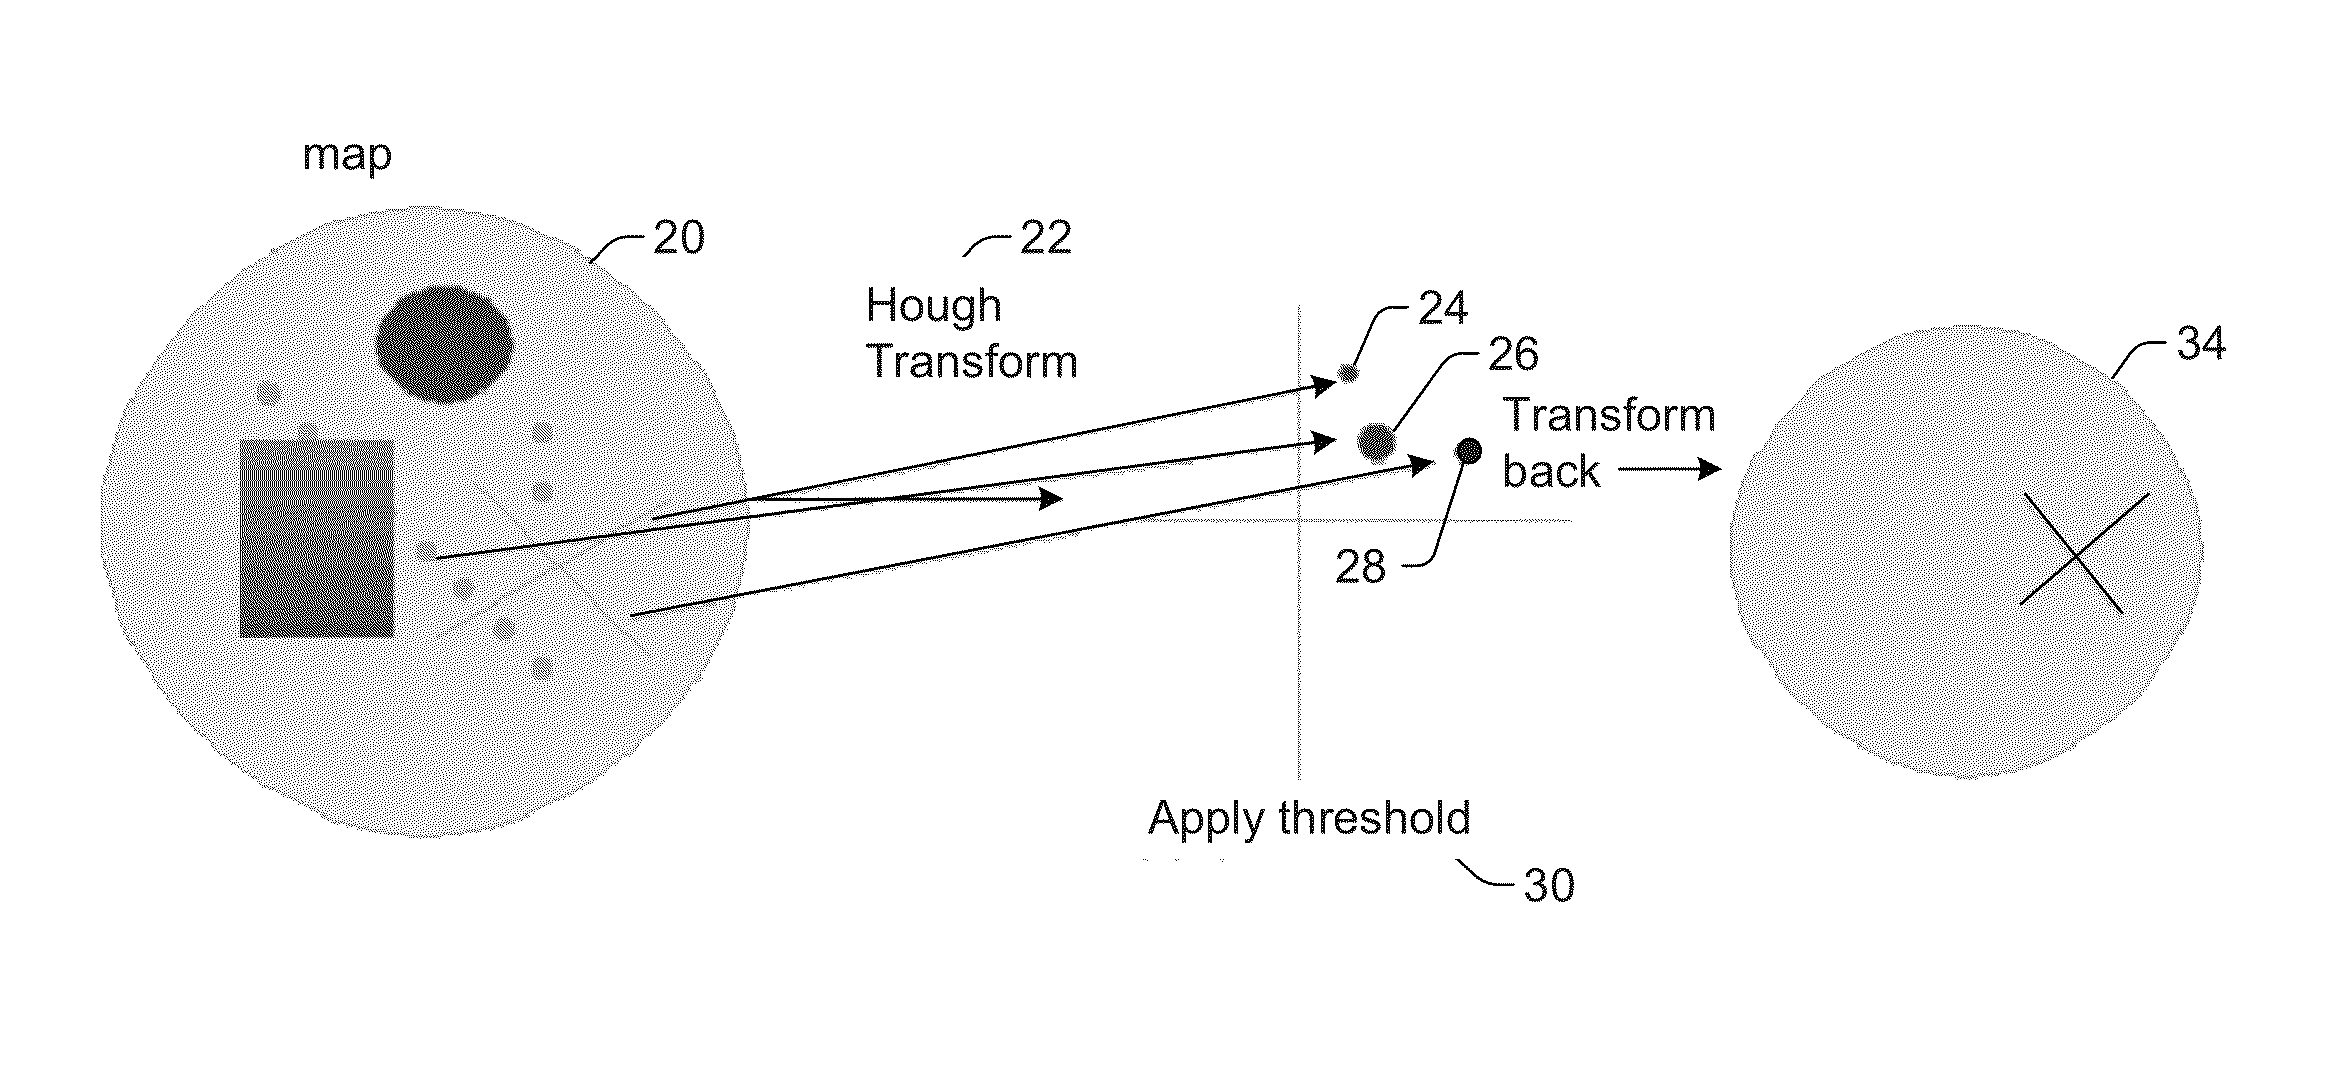
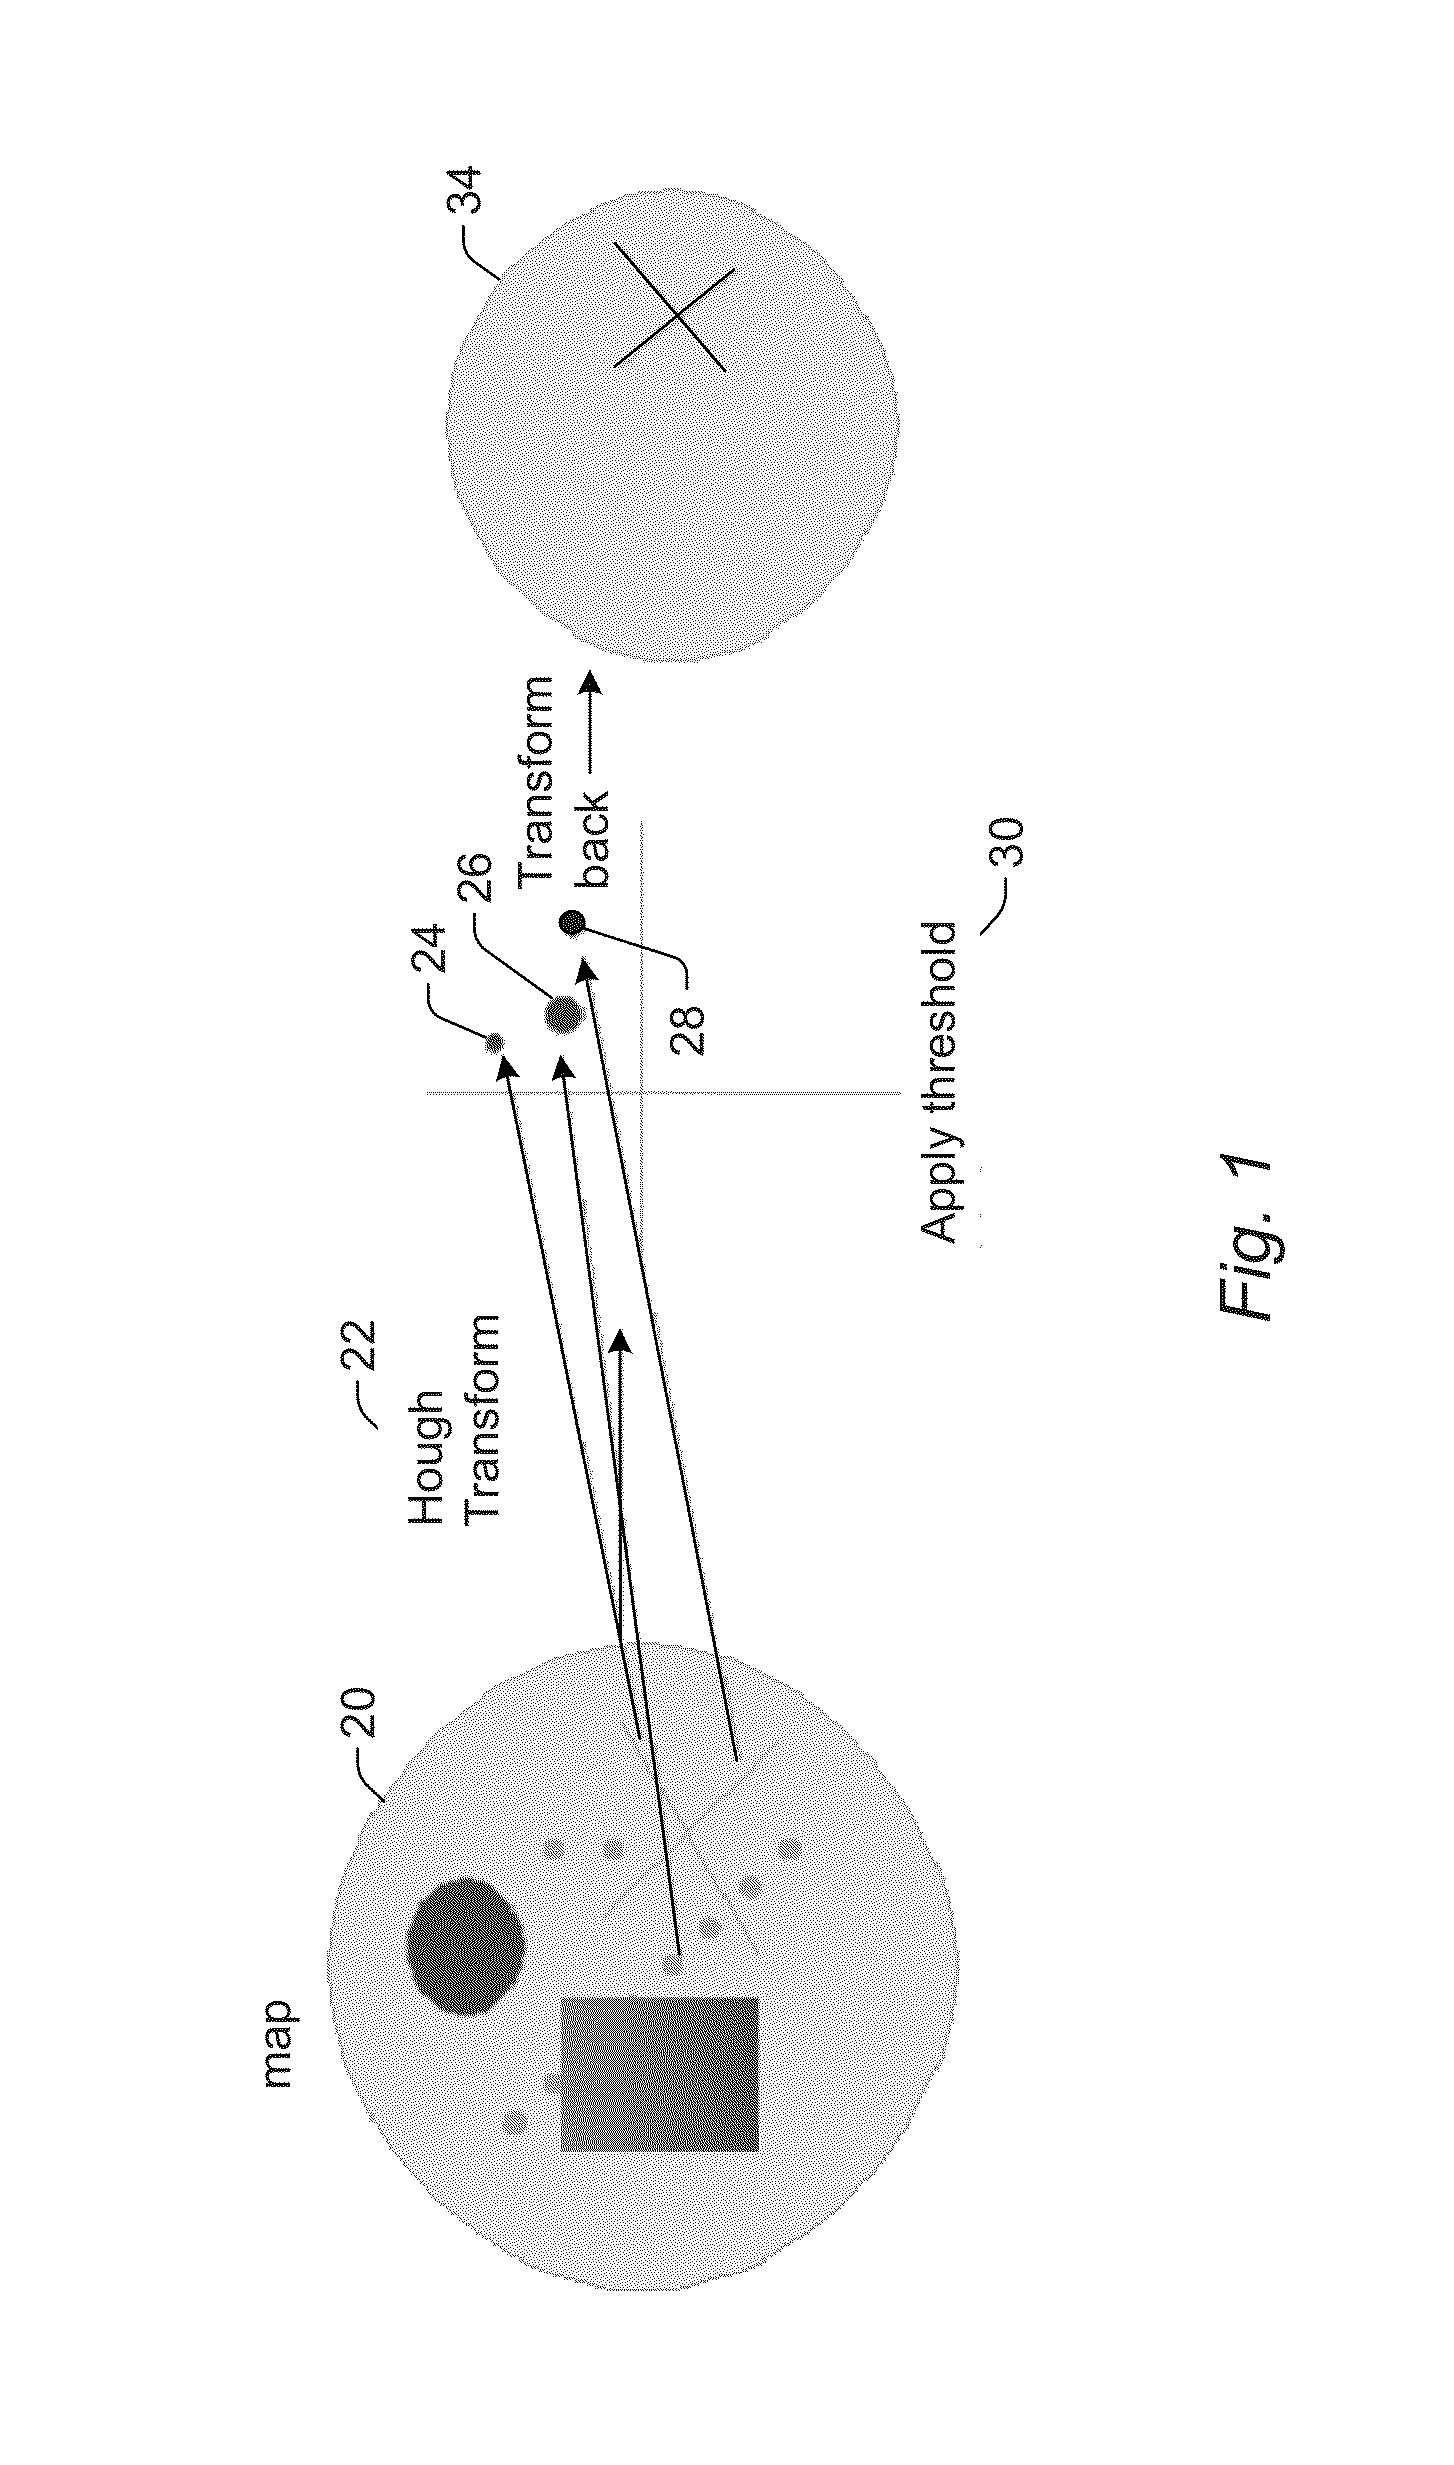
[0022]In general, the embodiments described herein relate to detecting two-dimensional defects on a substrate in relatively noisy inspection data. For example, one embodiment relates to a computer-implemented method for detecting defects on a substrate.

[0023]As used herein, the term “raw inspection data” generally refers to data acquired by inspection of a substrate that has not been processed to alter the signal-to-noise ratio of the data. For example, raw inspection data may be data that has been translated from one form to another (e.g., digitized or transformed from one sp...


PUM


Abstract

Methods and systems for detection of selected defects in relatively noisy inspection data are provided. One method includes applying a spatial filter algorithm to inspection data acquired across an area on a substrate to determine a first portion of the inspection data that has a higher probability of being a selected type of defect than a second portion of the inspection data. The selected type of defect includes a non-point defect. The inspection data is generated by combining two or more raw inspection data corresponding to substantially the same locations on the substrate. The method also includes generating a two-dimensional map illustrating the first portion of the inspection data. The method further includes searching the two-dimensional map for an event that has spatial characteristics that approximately match spatial characteristics of the selected type of defect and determining if the event corresponds to a defect having the selected type.

Description

BACKGROUND OF THE INVENTION[0001]1. Field of the Invention[0002]The present invention generally relates to methods and systems for detection of defects in relatively noisy inspection data.[0003]2. Description of the Related Art[0004]The following description and examples are not admitted to be prior art by virtue of their inclusion in this section.[0005]Inspection of semiconductor wafers is and will continue to be of significant importance in semiconductor manufacturing. In addition, the ability of inspection tools or systems to detect a range of defect types may determine how well semiconductor fabrication processes can be monitored and controlled. Consequently, there have been significant efforts in improving the processing of inspection data to increase the accuracy with which defects can be detected.[0006]Most inspection data processing involves two steps: defect detection and then classification. For instance, on many commercially available inspection systems, defects are found...

Claims


Application Information

Patent Timeline
IPC IPC(8): G06T7/00G01N21/88G06V10/48
CPCG06T7/0004G01N21/8851G06T2207/20061G06T2207/30148G01N2021/8887G01N21/95623G06V10/48G06V2201/06G06T7/0012G06T7/60G06T2207/20056
Inventor CHEN, HAIGUANGKIRK, MICHAEL D.BIELLAK, STEPHENSINHA, JAYDEEP
Owner KLA TENCOR CORP
Features
  • Generate Ideas
  • Intellectual Property
  • Life Sciences
  • Materials
  • Tech Scout
  • Unparalleled Data Quality
  • Higher Quality Content
  • 60% Fewer Hallucinations
Learn More