Imaging mass spectrometric data processing method and imaging mass spectrometer

a mass spectrometric and data processing technology, applied in mass spectrometers, particle separator tube details, instruments, etc., can solve the problems of difficult to completely load the previously mentioned high-precision imaging mass spectrometric data, limited storage capacity actually available in the main memory of commonly used personal computers, and inability to display imaging graphic, average mass spectrum and/or other information, and easy comparison of information. , the effect of reducing the cost of the system

Active Publication Date: 2016-08-09
SHIMADZU CORP
View PDF13 Cites 1 Cited by
  • Summary
  • Abstract
  • Description
  • Claims
  • Application Information

AI Technical Summary

Benefits of technology

[0057]With the imaging mass spectrometric data processing method and the imaging mass spectrometer according to the present invention, when imaging graphics and / or average mass spectra which have undergone various normalizations under different conditions are to be created and displayed, it is unnecessary to prepare a plurality of data files which respectively hold imaging mass spectrometric data obtained through those different kinds of normalizations, and to load those data files into the main memory and process them every time a display command or the like is given. In particular, the original imaging mass spectrometric data (in the compressed form) are statically held in the main memory, and the normalization coefficients to be used for normalizing the intensity values under various conditions are also held in the main memory. Therefore, it is possible to quickly display the imaging graphic, average mass spectrum and / or other information obtained by the normalizing process using those normalization coefficients. It is also possible to temporarily hold, in the main memory, a plurality of average spectra, imaging graphics or the like obtained from the same set of imaging mass spectrometric data under different normalization conditions, in which case a plurality of average spectra, imaging graphics or the like obtained under different normalization conditions can be simultaneously displayed so that the operator can easily compare those pieces of information. Even in the case of displaying such information, the amount of data to be held in the main memory is not significantly larger than the total of the compressed data of the imaging mass spectrometric data and the data of the normalization coefficients used under various conditions, since the amount of data of the average spectra, imaging graphics or the like is not significantly large. Accordingly, it is possible to create a less expensive system by using a main memory with a comparatively low capacity.
[0058]Furthermore, the imaging mass spectrometric data processing method and the imaging mass spectrometer according to the present invention allow for a linkage between the creation and display of an imaging graphic and the statistical analysis. For example, it is possible to quickly and smoothly display an imaging graphic for a mass-to-charge ratio which has been determined to be significant as a result of a statistical analysis. For the display of such an imaging graphic, it is possible to create an imaging graphic using the original imaging mass spectrometric data instead of creating an imaging graphic from the intensity values held as the peak matrix. Therefore, a fine and detailed imaging graphic can be displayed. Furthermore, the integration of the software for creating and displaying an imaging graphic or mass spectrum and the software for the statistical analysis eliminates the necessity of manually starting and ending each of the separate software programs, which improves the working efficiency.

Problems solved by technology

Therefore, if the mass spectrometric imaging needs to be performed with a high level of mass-resolving power and a high level of spatial resolution, the total amount of data per one sample will be enormous.
However, the storage capacity actually available in the main memory of commonly used personal computers is limited, and it is difficult to entirely load the previously mentioned high-precision imaging mass spectrometric data.
However, it has the drawback that the ion intensity varies by a considerable amount for each measurement (i.e. for each shot of a laser beam).
However, in some cases, such an accumulation cannot sufficiently cancel the influence of the variation in the ion intensity among the measurement points.
Therefore, an imaging graphic which has been simply created from the ion-intensity values obtained at the respective measurement points for a specific mass-to-charge ratio does not always correctly reflect the distribution of the substance concerned.
Therefore, every time the normalization condition is changed, it is necessary to perform related processes, such as calculating the normalization coefficient and performing the normalization of the imaging mass spectrometric data using the new coefficient, whereby a considerable amount of time is required for the data processing.
Furthermore, storing the entire set of mass spectrum data normalized under various normalization conditions is impractical since the data size will be considerably large even if the aforementioned data compression technique for the storage of mass spectrum data obtained at each measurement point is applied.
However, this significantly lowers the working efficiency, since the calculation of the peak matrix takes a considerable amount of time.
The process will be even more complex and time-consuming if it includes a statistical analysis based on imaging mass spectrometric data normalized under various conditions.
Furthermore, in general, the software for creating and displaying an imaging graphic for a specific mass-to-charge ratio or an average spectrum over a specific region of interest based on imaging mass spectrometric data, and the software for performing statistical analyses have been provided as independent programs due to the limitation on the capacity of the main memory available on a computer.
Therefore, for example, in order to visually check a detailed imaging graphic for a mass-to-charge ratio which has been determined to be useful by a statistical analysis, the operator needs to perform the extremely cumbersome task of interchanging a data file between the separate software programs as well as starting and ending each of those programs.

Method used


Image

  • Imaging mass spectrometric data processing method and imaging mass spectrometer
  • Imaging mass spectrometric data processing method and imaging mass spectrometer
  • Imaging mass spectrometric data processing method and imaging mass spectrometer

Examples


Embodiment Construction

[0069]One embodiment of the imaging mass spectrometric data processing method according to the present invention and the imaging mass spectrometer using the same method is hereinafter described with reference to the attached drawings.

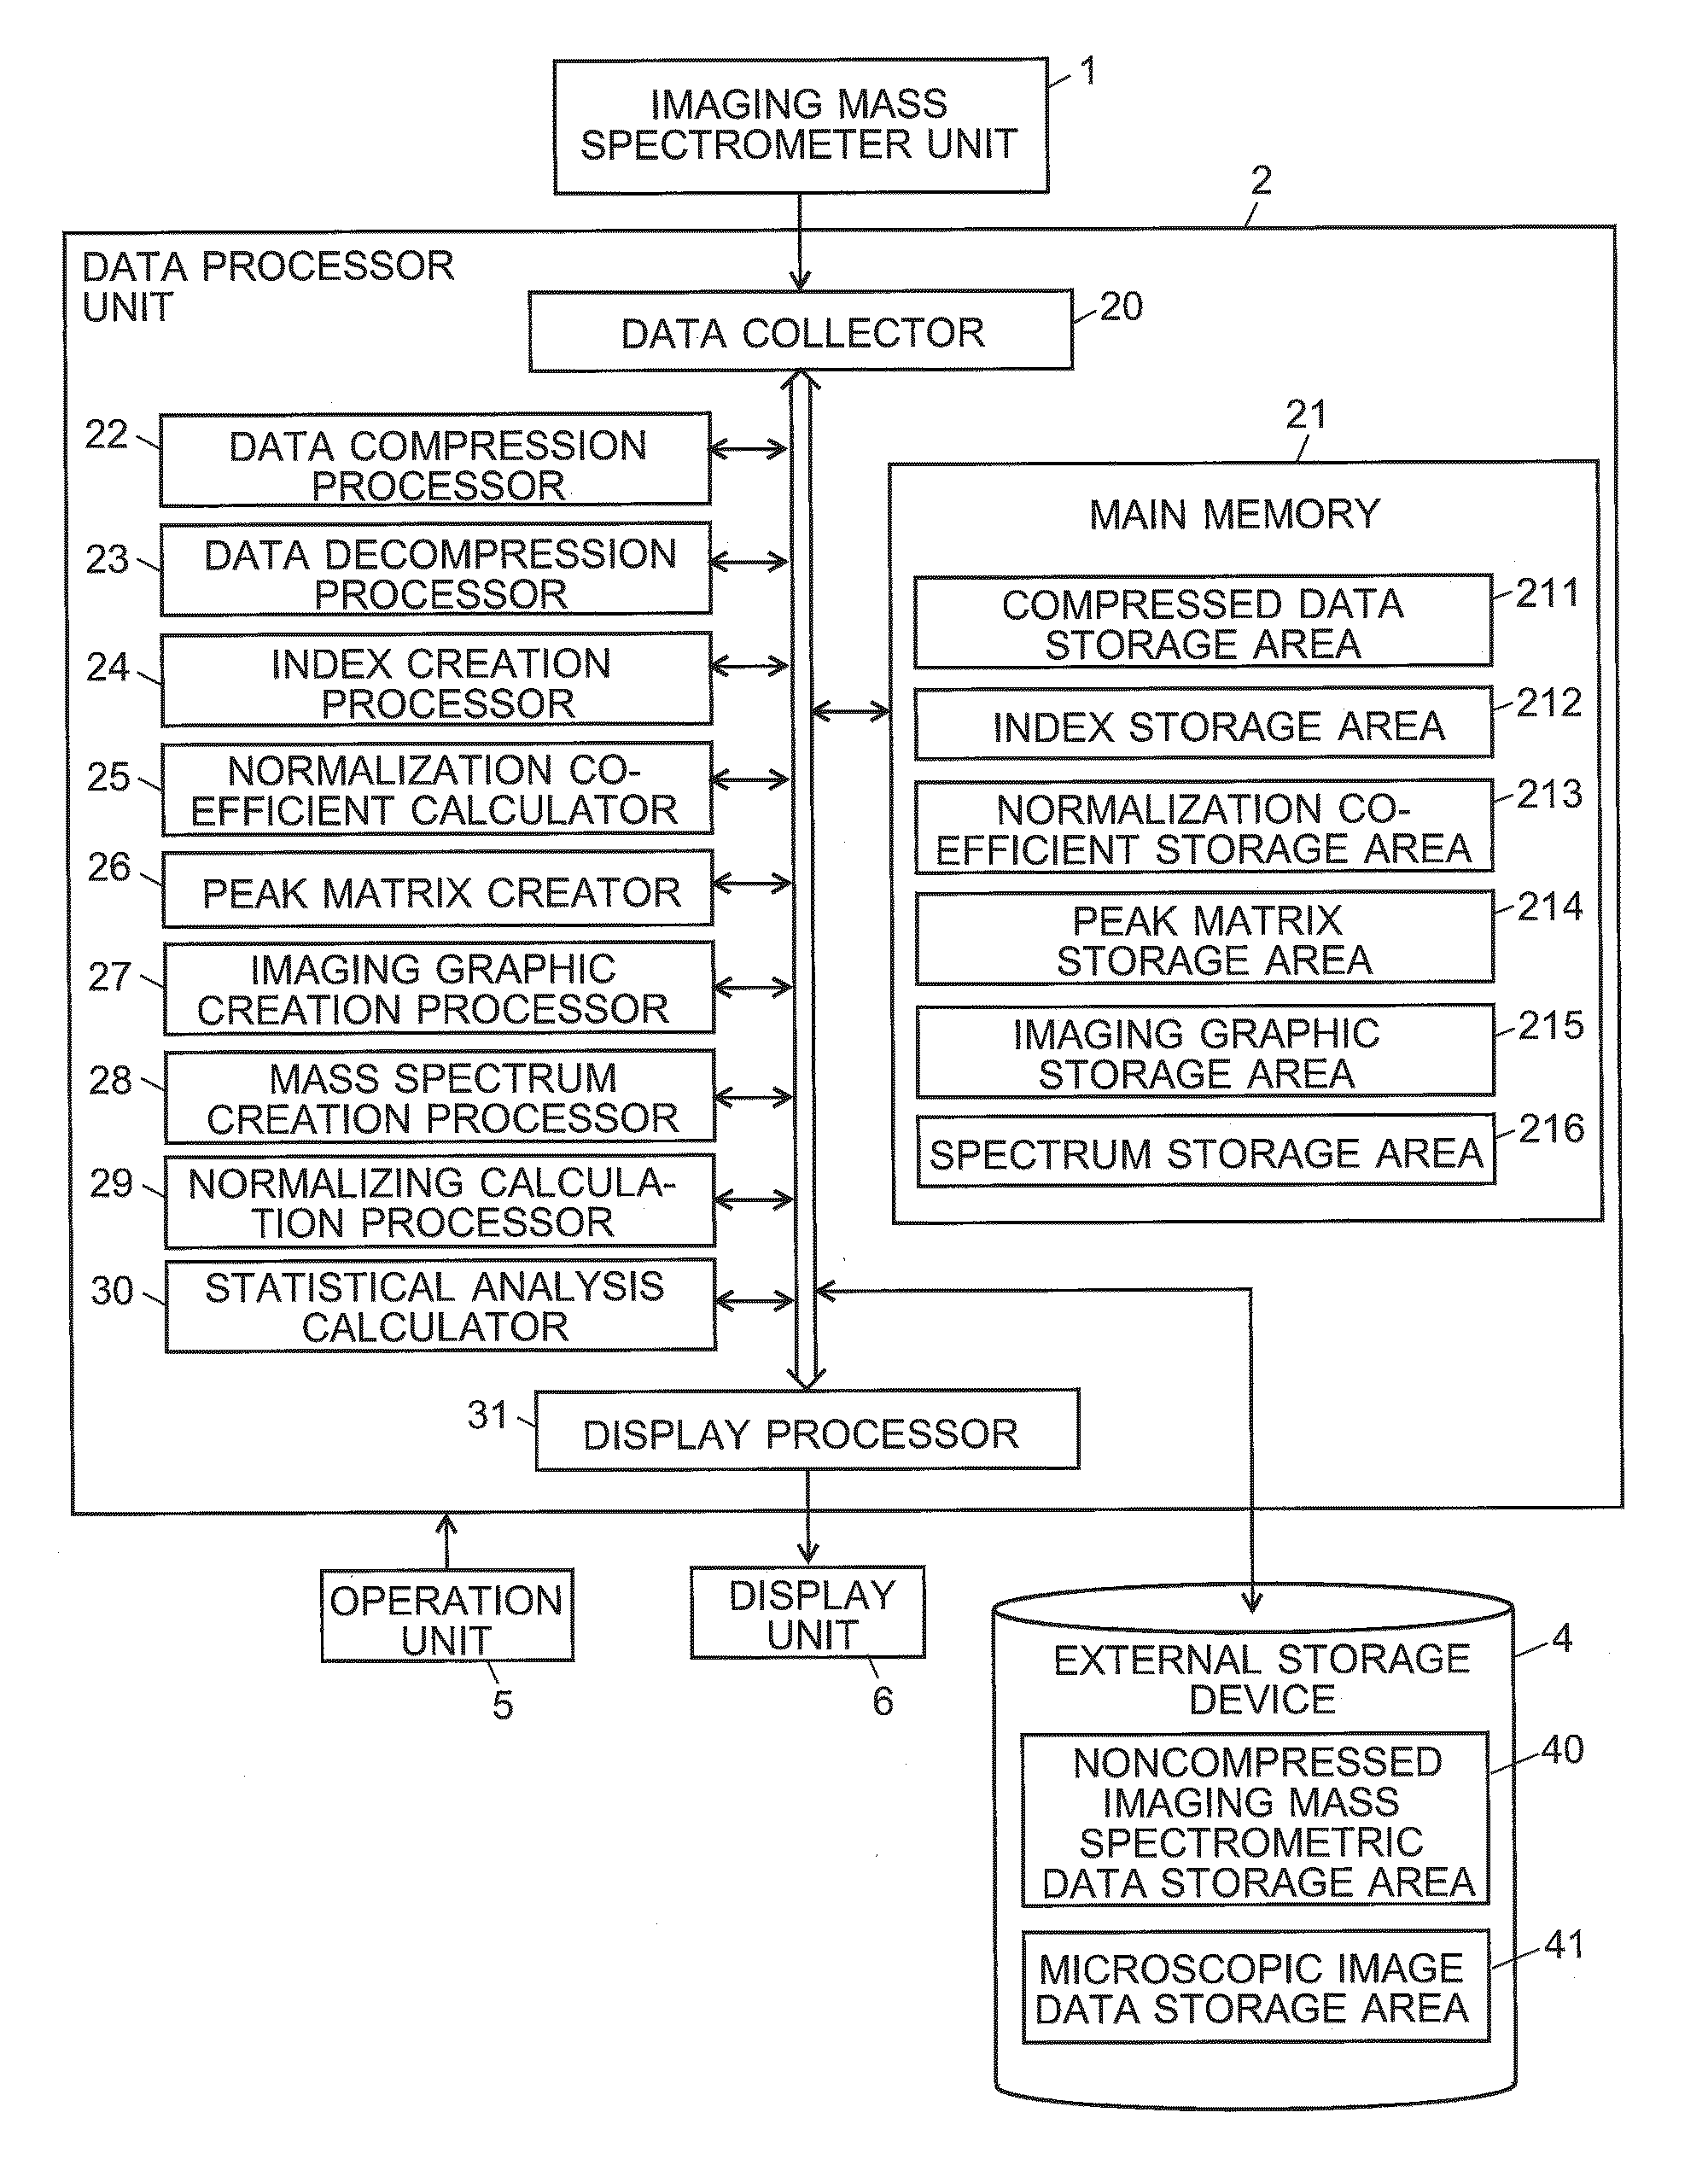
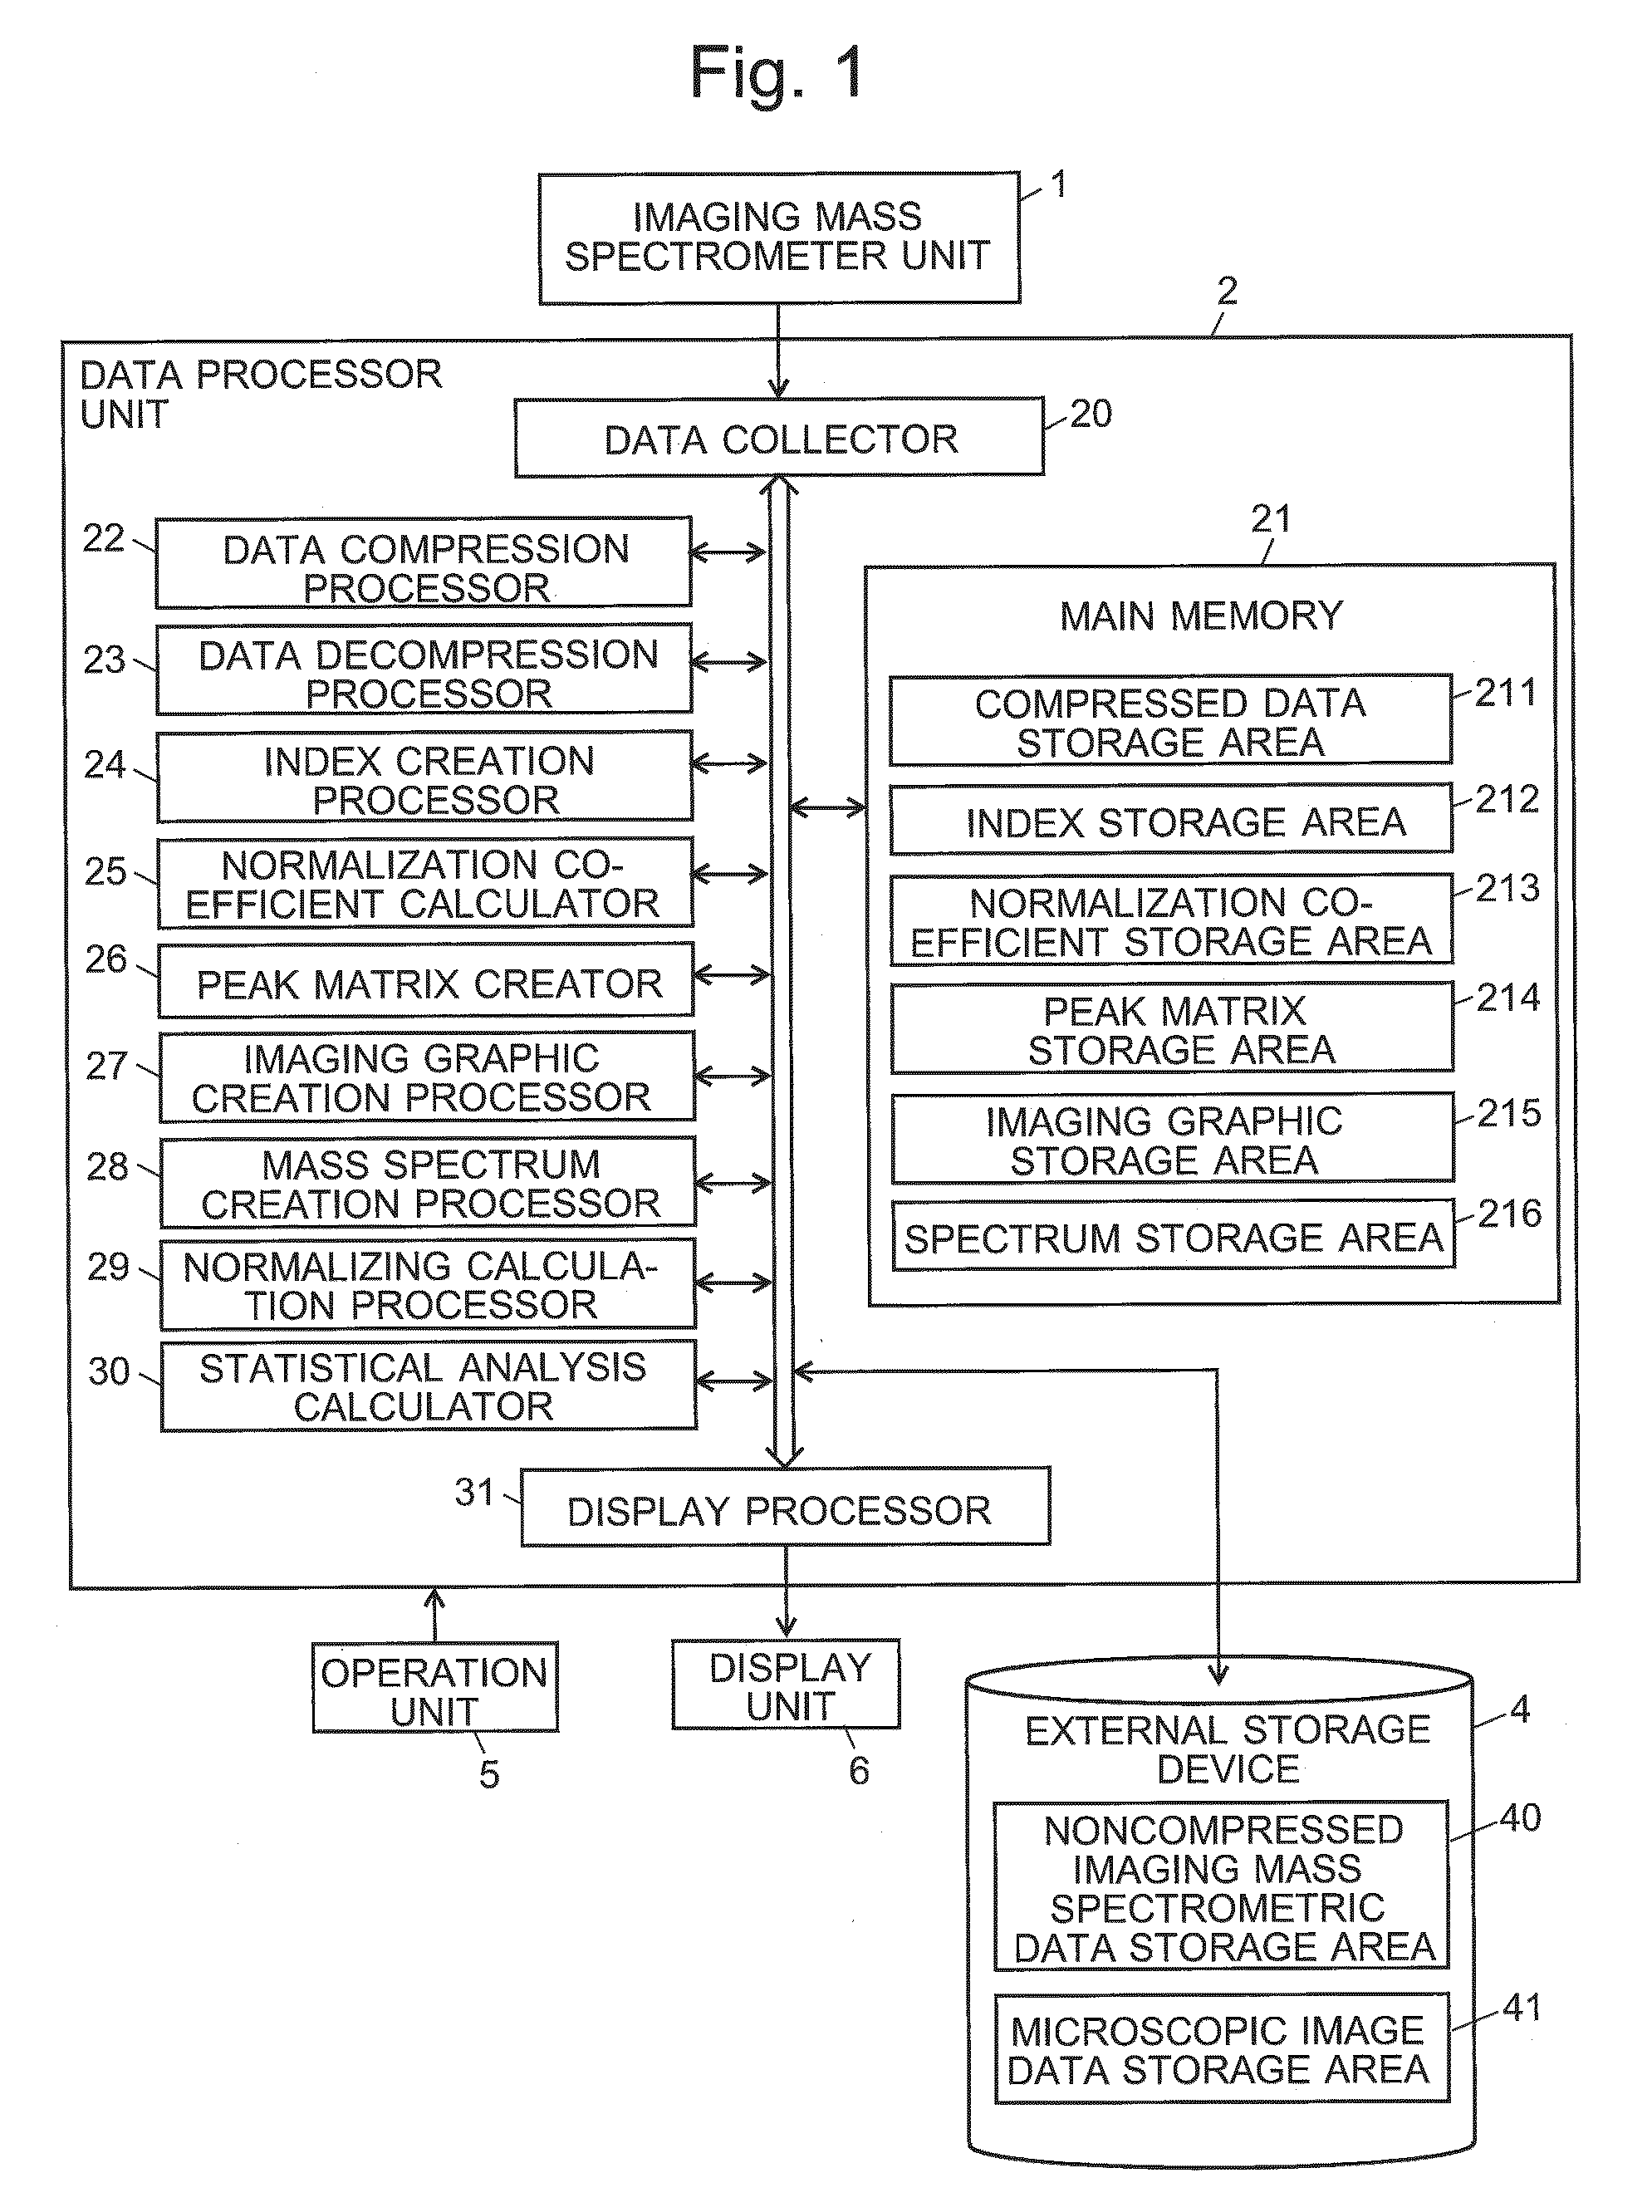
[0070]FIG. 1 is a configuration diagram showing the main components of an imaging mass spectrometric system capable of performing an imaging mass spectrometric data processing method which is one embodiment of the present invention.

[0071]This imaging mass spectrometric system includes: an imaging mass spectrometer unit 1 for performing a mass spectrometry for each of a large number of two-dimensionally arranged measurement points on a sample to obtain mass spectrum data within a predetermined mass-to-charge-ratio range for each measurement point; a data processing unit 2 for performing various kinds of data processing (which will be described later) on the obtained data; a high-capacity external storage device 4, such as a hard disk drive (HDD) or solid...


PUM


Abstract

Compressed data of mass spectra obtained at respective measurement points and normalization coefficients for XIC normalization or the like are stored in a memory (21). When a normalized imaging graphic at a specific m / z value is to be displayed, a data decompression processor (23) reads the minimally required set of compressed data from the memory (21) and restores the intensity value corresponding to the m / z value at each measurement point. A normalizing calculation processor (29) reads an XIC normalization coefficient corresponding to the m / z value from the memory (21) and corrects the intensity values at each measurement point by multiplying those values by the coefficient. An imaging graphic creation processor (27) assigns a display color to each of the corrected intensity values to create an imaging graphic, and displays the imaging graphic on the screen of a display unit (6). According to this method, even in the case of sequentially displaying imaging graphics while changing the normalization condition, those graphics can be displayed at high speeds if the normalization coefficients are previously calculated and stored.

Description

CROSS REFERENCE TO RELATED APPLICATIONS[0001]This application is a National Stage of International Application No. PCT / JP2014 / 061161, filed on Apr. 21, 2014, which claims priority from Japanese Patent Application No. 2013-089398, filed on Apr. 22, 2013, the contents of all of which are incorporated herein by reference in their entirety.TECHNICAL FIELD[0002]The present invention relates to a data processing method suitable for an imaging mass spectrometer capable of acquiring an imaging graphic showing the signal intensity distribution of an ion having a specific mass-to-charge ratio or ions within a specific range of mass-to-charge ratios on a sample, as well as an imaging mass spectrometer using the same data processing method.BACKGROUND ART[0003]Mass spectrometric imaging is a technique for investigating the distribution of a substance having a specific mass by performing a mass spectrometry on each of a plurality of measurement points (micro areas) within a two-dimensional area o...

Claims


Application Information

Patent Timeline
Patent Type & Authority Patents(United States)
IPC IPC(8): G06F17/30G06K9/00H01J49/00H01J49/40H01J49/16
CPCH01J49/0004H01J49/0036H01J49/40H01J49/164
Inventor IKEGAMI, MASAHIRO
Owner SHIMADZU CORP
Why Eureka
Try Eureka