
Waveform processing assistance method and system

a technology of assistance method and waveform, applied in the field of waveform processing assistance method and system, can solve the problems of difficult to specify the value of the parameter “slope” in the automatic process using a computer, the difficulty of intuitively determining whether or not the “slope” value is appropriate, and the inability to flexibly deal with such situations, so as to achieve quick specified and shorten the analysis time of waveform processing.

Active Publication Date: 2017-10-24
SHIMADZU CORP
View PDF7 Cites 4 Cited by
  • Summary
  • Abstract
  • Description
  • Claims
  • Application Information

AI Technical Summary

Benefits of technology

[0023]For a waveform including a peak of measurement data, the information related to the slope of the waveform at an arbitrarily specified point is displayed on the display screen on which the peak waveform is shown. This information helps users intuitively determine the value of the slope of the peak or other parameters whose validity has conventionally been difficult to be intuitively determined. Therefore, even a user who is not accustomed to an analysis for the waveform processing can perform an analysis of a peak waveform of the measurement data.
[0024]In the case where a plurality of spectra which only differ from each other in peak intensity are shown in a superposed form, the displayed information enables users to determine whether or not the rising and falling points of the peak in a spectrum are appropriate, even if the spectrum has a low peak intensity. Accordingly, the values of the parameters necessary for the waveform processing can be quickly specified and the analysis time of the waveform processing can be shortened.

Problems solved by technology

Therefore, it is difficult for users to intuitively determine whether or not the “Slope” value is appropriate.
The automatic determination of the values of the parameters “Width” and “Slope” using a computer is a standardized process and does not allow the rising or falling point of the peak to be arbitrarily selected as needed by users.
However, the automatized process using a computer cannot flexibly deal with such situations.
However, specifying the value of the parameter “Slope” is difficult for those who are not accustomed to an analysis for the waveform processing.
This is because, as explained earlier, it is difficult for users to intuitively determine whether or not the “Slope” value is appropriate.
When the user directly specifies the values of the parameters “Width” and “Slope” and determines the rising and falling points of a peak in such a low-intensity spectrum, it is difficult to determine, from the screen display, whether or not the rising and falling points of the peak are appropriate.
Therefore, the user needs to perform the cumbersome task of expanding the vertical axis of the spectrum whose peak intensity is low and then determining the rising and falling points of the peak by directly specifying the values of the parameters “Width” and “Slope.”

Method used


Image

  • Waveform processing assistance method and system
  • Waveform processing assistance method and system
  • Waveform processing assistance method and system

Examples


first embodiment

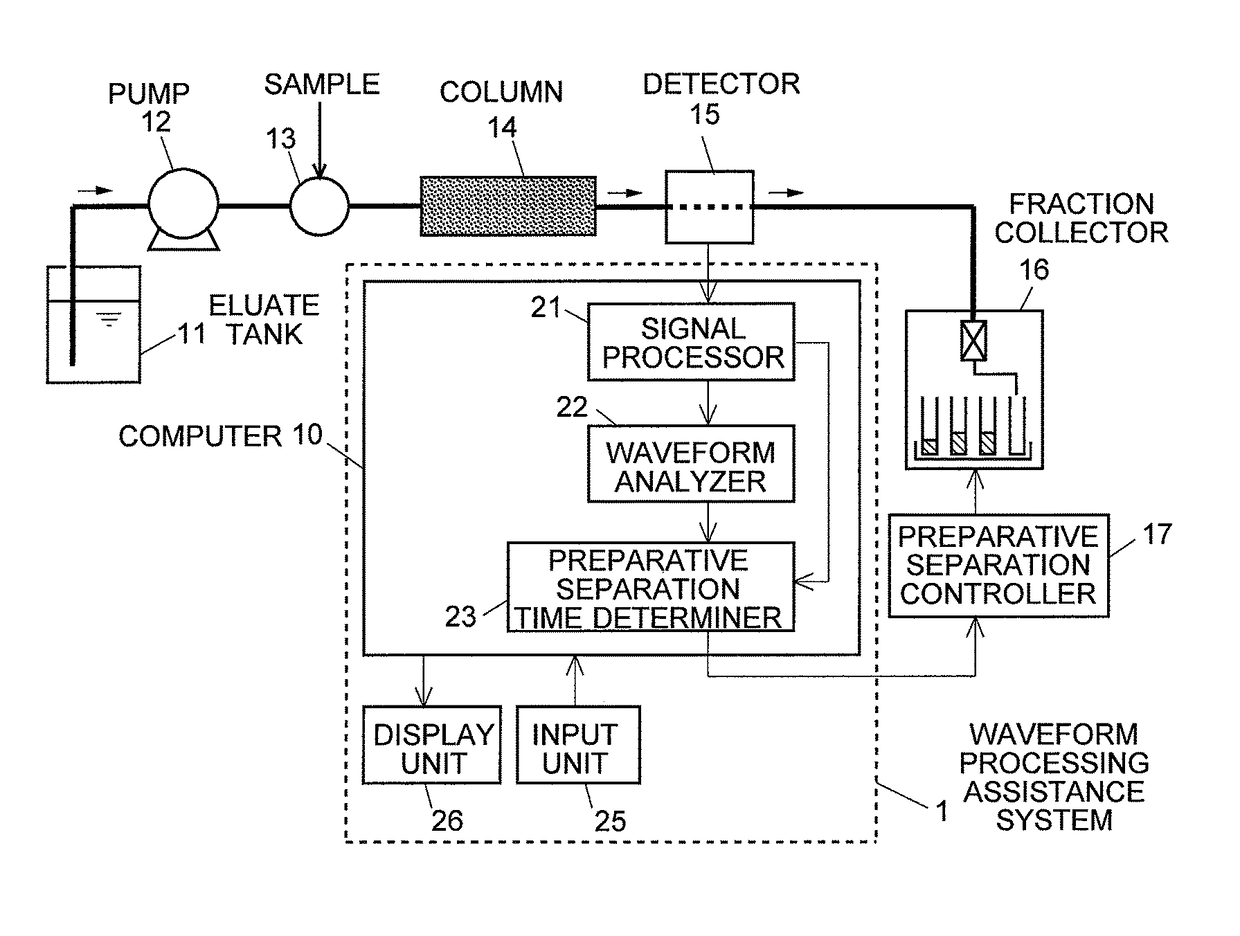
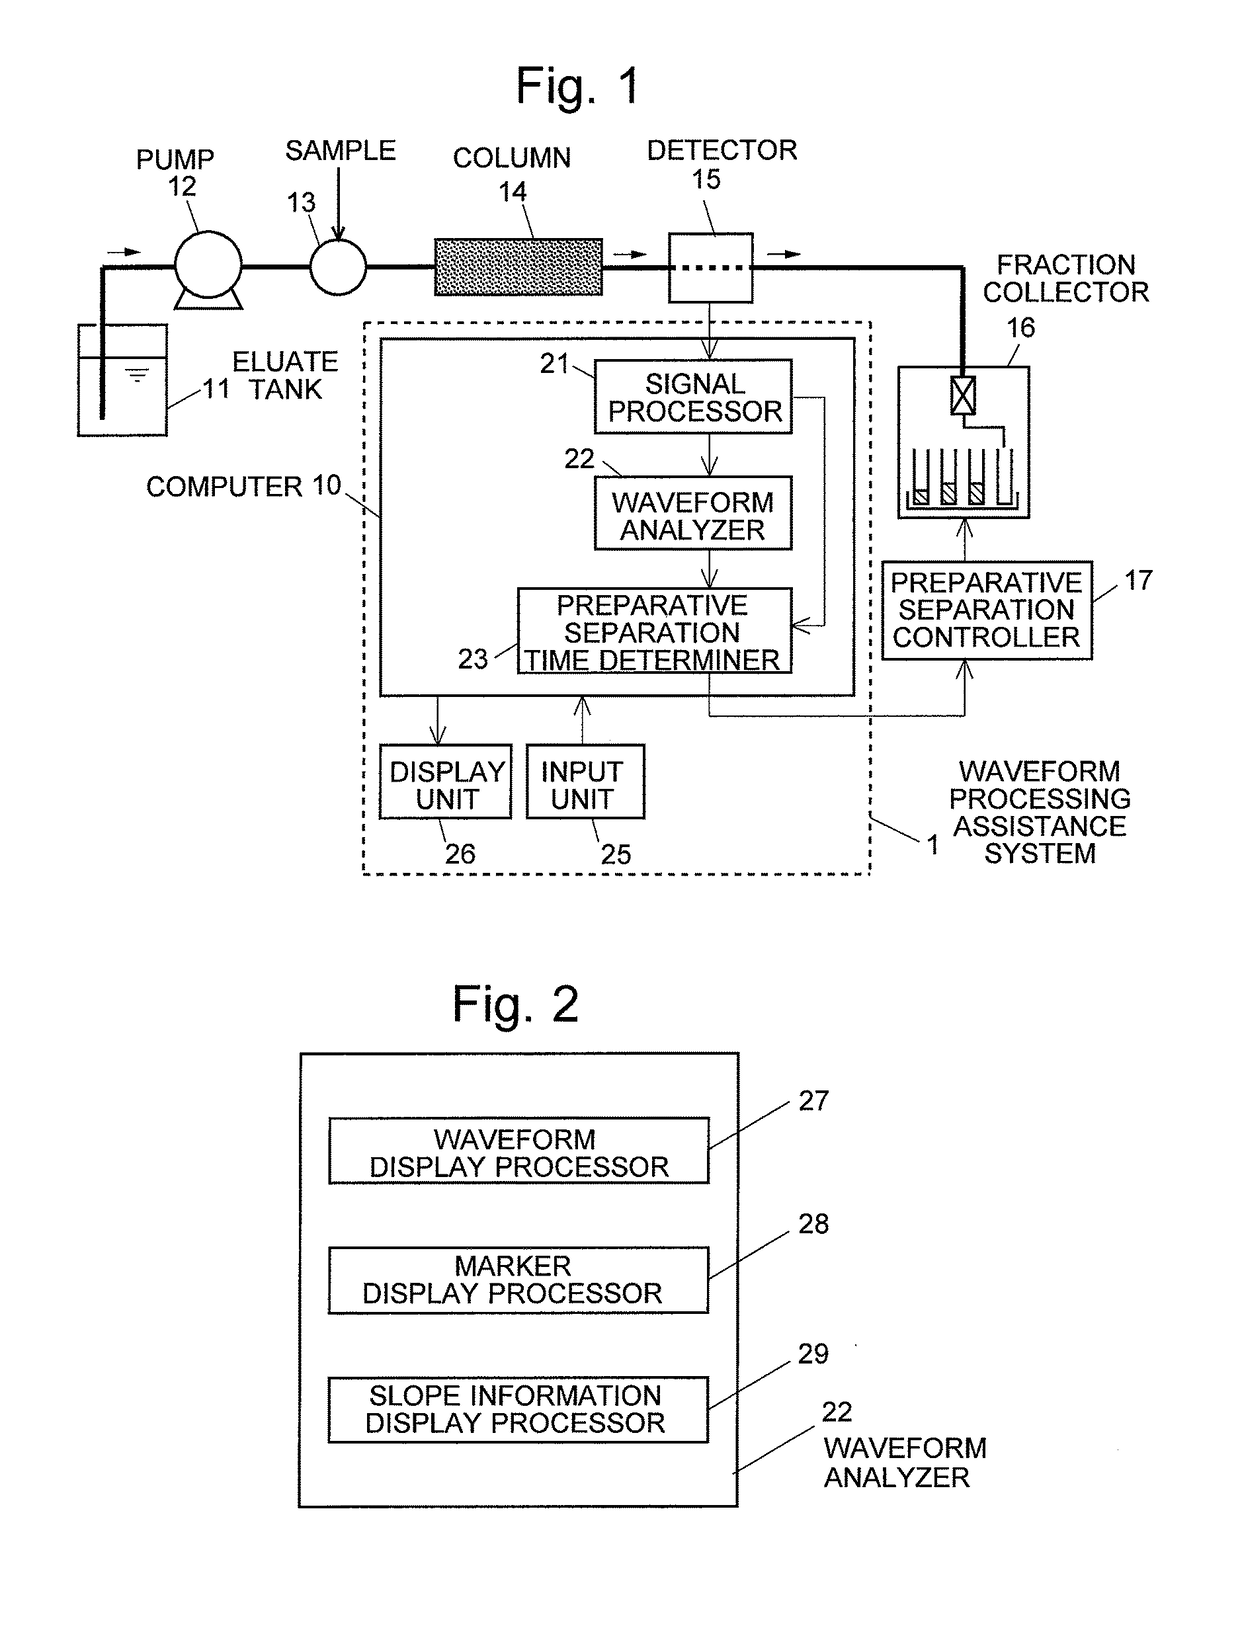
[0031]A waveform processing assistance system according to the first embodiment of the present invention is described with reference to FigS. 1 and 2.

[0032]Fig. 1 is a block diagram showing the main components of a preparative liquid chromatograph system in which the waveform processing assistance system 1 of the present embodiment is used. An eluent (mobile phase) held in an eluent tank 11 is drawn by a liquid-sending pump 12 and supplied into a column 14 via a sample injector 13 at a constant flow rate. A sample solution injected into the mobile phase in the sample injector 13 is carried by the mobile phase and introduced into the column 14. While passing through this column 14, the sample is separated into components, which are eluted from the column 14 at different points in time. A detector 15, which is an ultraviolet-visible spectrophotometer, sequentially detects the components eluted from the column 14 and sends detection signals to a signal processor 21. After passing throu...

second embodiment

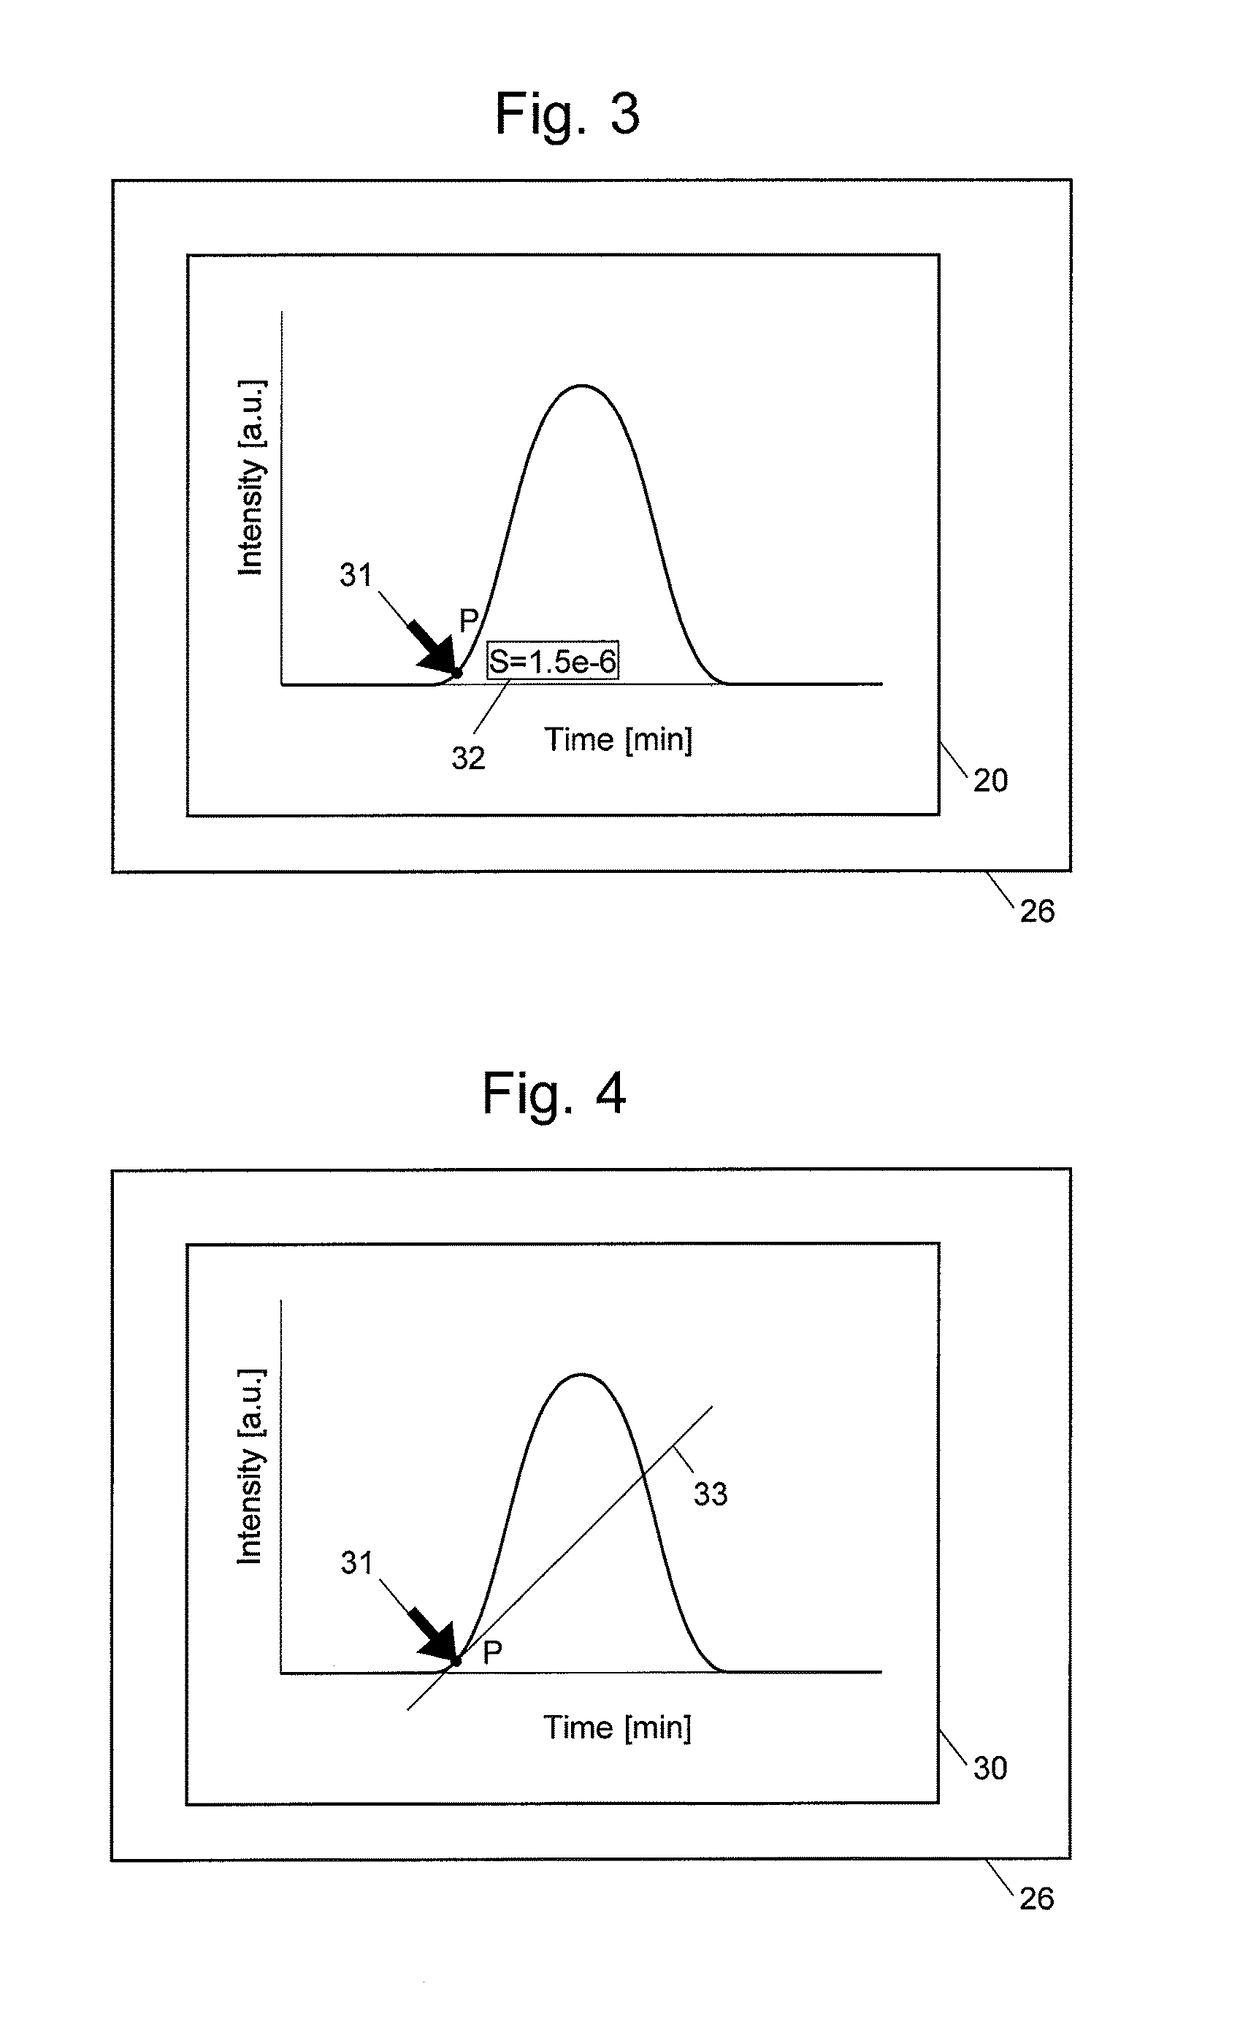
[0041]The second embodiment of the present invention is hereinafter described by means of Fig. 4, which shows one example of the display screen on which a peak waveform of a chromatogram is shown. The following description only deals with the operation of the waveform analyzer 22, since the other operations are the same as in the first embodiment.

[0042]The display screen of the display unit 26 has a screen area 30 for showing a peak waveform of a chromatogram, with the horizontal axis indicating time and the vertical axis indicating the intensity. The display screen in the present example shows the situation where the user has specified a point P on the peak waveform as the rising point of the peak in the screen area 30.

[0043]When a point P on the peak waveform is specified by the user, the slope information display processor 29 of the waveform analyzer 22 determines the slope of the waveform at the specified point P, calculates a tangent 33 to the curve at the point P, and displays...

third embodiment

[0046]The third embodiment of the present invention is hereinafter described by means of Fig. 5, which shows one example of the display screen on which a peak waveform of a chromatogram is shown. The following description only deals with the operation of the waveform analyzer 22, since the other operations are the same as in the first embodiment.

[0047]The display screen of the display unit 26 has a screen area 40 for showing a peak waveform of a chromatogram, with the horizontal axis indicating time and the vertical axis indicating the intensity. The display screen in the present example shows the situation where the user has specified a point P on the peak waveform as the rising point of the peak in the screen area 40.

[0048]When a point P on the peak waveform is specified by the user, the slope information display processor 29 of the waveform analyzer 22 immediately calculates the tangent to the curve at the point P and displays the tangent on the screen. Furthermore, the processor...


PUM


Abstract

Provided is a waveform processing assistance system for helping users determine the value of a parameter which is necessary in a waveform processing method for determining the rising and falling points of a peak and whose validity cannot be easily and intuitively determined The system includes: a waveform displayer for showing, on a display screen, a waveform including a peak; a marker displayer for showing, on the display screen, a marker which is capable of being moved by a user; and a slope information displayer for showing information related to the slope of the waveform at a point lying on the waveform and meeting the marker, or at a point which lies on the waveform, which meets the marker, and at which a predetermined operation has been performed by the user. Examples of the slope-related information include a numerical value of the slope, a tangent, and a grid.

Description

TECHNICAL FIELD[0001]The present invention relates to a method and system for assisting an analysis of a peak waveform of measurement data obtained with a chromatograph system, spectrometer or other devices.BACKGROUND ART[0002]Some measurement systems, such as a chromatograph system or a spectroscopic analyzer, produce measurement data in the form of waves with one or more peaks. In those systems, the result of a measurement is analyzed by determining the width, intensity, area and other values of a peak waveform of the measurement data by waveform processing including the steps of determining the rising and falling points of the peak, setting the baseline, and calculating a fitting curve using a Lorenz distribution function or Gaussian distribution function (see Patent Literature 1).[0003]Correct determination of the rising and falling points of a peak is important since these points affect the value of the peak area. In a preparative chromatography, in which a specific target comp...

Claims


Application Information

Patent Timeline
Patent Type & Authority Patents(United States)
IPC IPC(8): G01R13/02
CPCG01R13/0245
Inventor NAKAYAMA, DAISUKE
Owner SHIMADZU CORP
Learn More