Method and apparatus for the detection of distortion or corruption of cellular communication signals

a technology of cellular communication and detection method, applied in the field of wireless telecommunications networks, to achieve the effect of good reliability, interference or noise level ris

Active Publication Date: 2018-04-10
VIAVI SOLUTIONS INC
View PDF48 Cites 20 Cited by
  • Summary
  • Abstract
  • Description
  • Claims
  • Application Information

AI Technical Summary

Problems solved by technology

If the digital signal (1s and 0s) is not received exactly as it was transmitted, then there is distortion in the audio signal, and the person at the receiving end may not understand the conversation.
The limiting factor in the network equipment's ability to accurately recover the signal is the signal to interference plus noise ratio (“SINR”) at the receiver.
Every receiving device has an SINR at which it can no longer correctly recover the signal that was sent by the transmitter.
The environment in which pressure waves are transmitted by a talker to a microphone (item 1) and from a speaker to a listener (item 5) can be a significant source of distortion in the quality of the end-to-end conversation (example: talking or listening in a crowded, noisy room).
However, this SINR environment is outside the control of the Wireless Service Provider (WSP), so it is not a process the WSP tries to quantify, measure, and manage.
If a device outside the control of the wireless service provider is broken and transmitting radio energy on the same frequency as the wireless service provider's network receiver, then this causes high variability in the interference part of the SINR equation.4. The equipment that is used to transmit and receive radio waves over-the-air is exposed to harsh weather conditions while the equipment used for fiber-optic transmission is housed in environmentally-controlled offices.
Therefore, the radio transmission and reception equipment is more prone to degradation and failure.
If there is high variability in the system, it is much more difficult to achieve high reliability.
This is why the RAN environment is always the limiting factor in the reliability of mobile telecommunications networks.
In addition to the reliability problems, there are also capacity constraints in the RAN environment.
Because there is a limited supply of frequency spectrum, and because of the growth in demand for wireless services by consumers, the cost for these licenses has risen dramatically.
SINR=signal⁢⁢power⁢⁢levelinterference+noise⁢⁢power⁢⁢levelWhen SINR goes down, reliability, capacity, and data throughput all go down.When signal power goes down, SINR goes down.When noise or interference goes up, SINR goes down.2. The most disadvantaged receiver in all wireless telecom networks 2 is the receiver in the network 2 that must recover the radio signal transmitted by the mobile phone 4.The transmit power of the mobile phone 4 cannot be increased because of safety concerns and because of practical limitations on size and battery power.
This technique works because the probability is very low that both antennas 10 will experience fading by the changing RAN environment at the same time.4. Under normal operating conditions, the noise power level (in the denominator of the SINR equation) is predictable and the interference is non-existent; however, there are often problems in the RAN environment that cause the interference and noise power level to be unpredictable.
However, because of zoning restrictions and practical economic and construction limitations, wireless service providers cannot put receivers everywhere they want.
If a connection between a mobile phone transmitter and the network receiver is operating near that limit and the interference or noise level rises, the radio link can become unusable; then speech becomes garbled or in the worst case the call drops.
Two problems which reduce the reliability and capacity of the wireless telecommunications network 2 are breakdowns in the balance of the diversity antennas 10, and increases in the noise level at the radio receiver.
While fading can cause short term differences, if the difference is large and stays for a while, something else is causing the problem.
The most common causes are a failed antenna or connecting cable in one branch.
These can be outright failures, such as a broken cable, but are more commonly a subtler problem such as Passive Intermodulation Distortion.High RSSI (Received Signal Strength Indicator).
In those circumstances, the RF energy from the mobile phone 4 is considered noise by the other receivers.In most cases, the reason that RSSI is too high is because there is unwanted noise or interference coming into the receiver.
There are many potential causes of problems in the RAN 6, but the common of them are:Interference from an external transmitter (one that is not under the control of the wireless service provider) that is broken and creating noise in the wireless service provider's frequency spectrum.
The key point of the table is that the alarms and notifications are generally insufficient by themselves to diagnose and repair the root causes of the problems.
However, problems are often intermittent (i.e. PIM only when it is windy or intermittent interference).
There is a high cost of mis-diagnosis:Direct cost: wireless service providers spend thousands (sometimes 10s of thousands) of dollars changing antennas and / or transmission lines only to find that the repair did not fix the problem.
)Indirect cost: money and man-hours that could have been spent building out the new network.

Method used


Image

  • Method and apparatus for the detection of distortion or corruption of cellular communication signals
  • Method and apparatus for the detection of distortion or corruption of cellular communication signals
  • Method and apparatus for the detection of distortion or corruption of cellular communication signals

Examples


example pim

[0737 Scenarios:[0738]A) Internal PIM (iPIM) that only affects MIMO branch 1.[0739]B) Internal PIM on both MIMO branch 1 and branch 2. Good isolation between branches (e.g. no reflector).[0740]C) Internal PIM on MIMO branch 1, reflected to MIMO branch 2 via external reflector.[0741]D) External PIM (ePIM) that is equal in both MIMO branches.[0742]E) External PIM that is weak, and only seen in one branch 1.[0743]F) External PIM reflected to both MIMO branch 1 and branch 2, seen much higher in branch 1 than branch 2, due to an external object that polarizes the PIM signal.

[0744]In Table 5:[0745]The top row shows the scenario (A-F) from the above list.[0746]The second row is an indication of how common this scenario occurs in the real world, based on the experience of the present authors.[0747]The third row is a short description of the scenario, matching the longer descriptions given above.[0748]The seven cells labelled “Comparisons” in the first column can be interpreted as follows. E...


PUM


Abstract

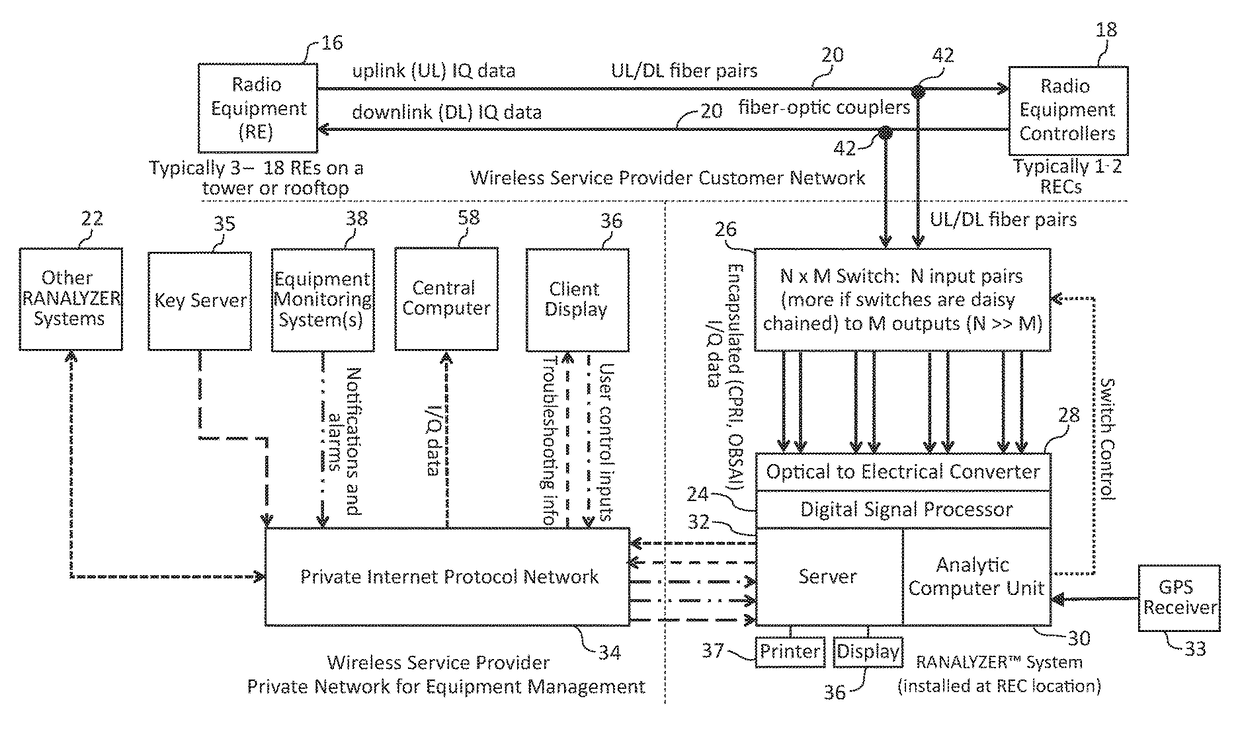
A system for troubleshooting signals in a cellular communications network, and in particular, for determining the cause of distortion or corruption of such signals, includes a robotic or other type of switch. The robotic switch can tap into selected uplink fiber-optic lines and selected downlink fiber-optic lines between radio equipment and radio equipment controllers in a wireless (e.g., cellular) network to extract therefrom the I and Q data. The selected I and Q data, in an optical form, is provided to an optical-to-electrical converter forming part of the system. The system includes an FPGA (Field Programmable Gate Array) or the like, and an analytic computer unit, or web server, and SSD (Solid State Drive) and magnetic disk storage, among other components of the system. The system analyzes the I and Q data provided to it, and determines the cause, or at least narrows the field of possible causes, of impairment to transmitted signals. The system includes a display which provides the troubleshooting information thereon for a user of the system to review, or other form of a report, and may communicate the analytical findings to a remote location over a public or private internet protocol network.

Description

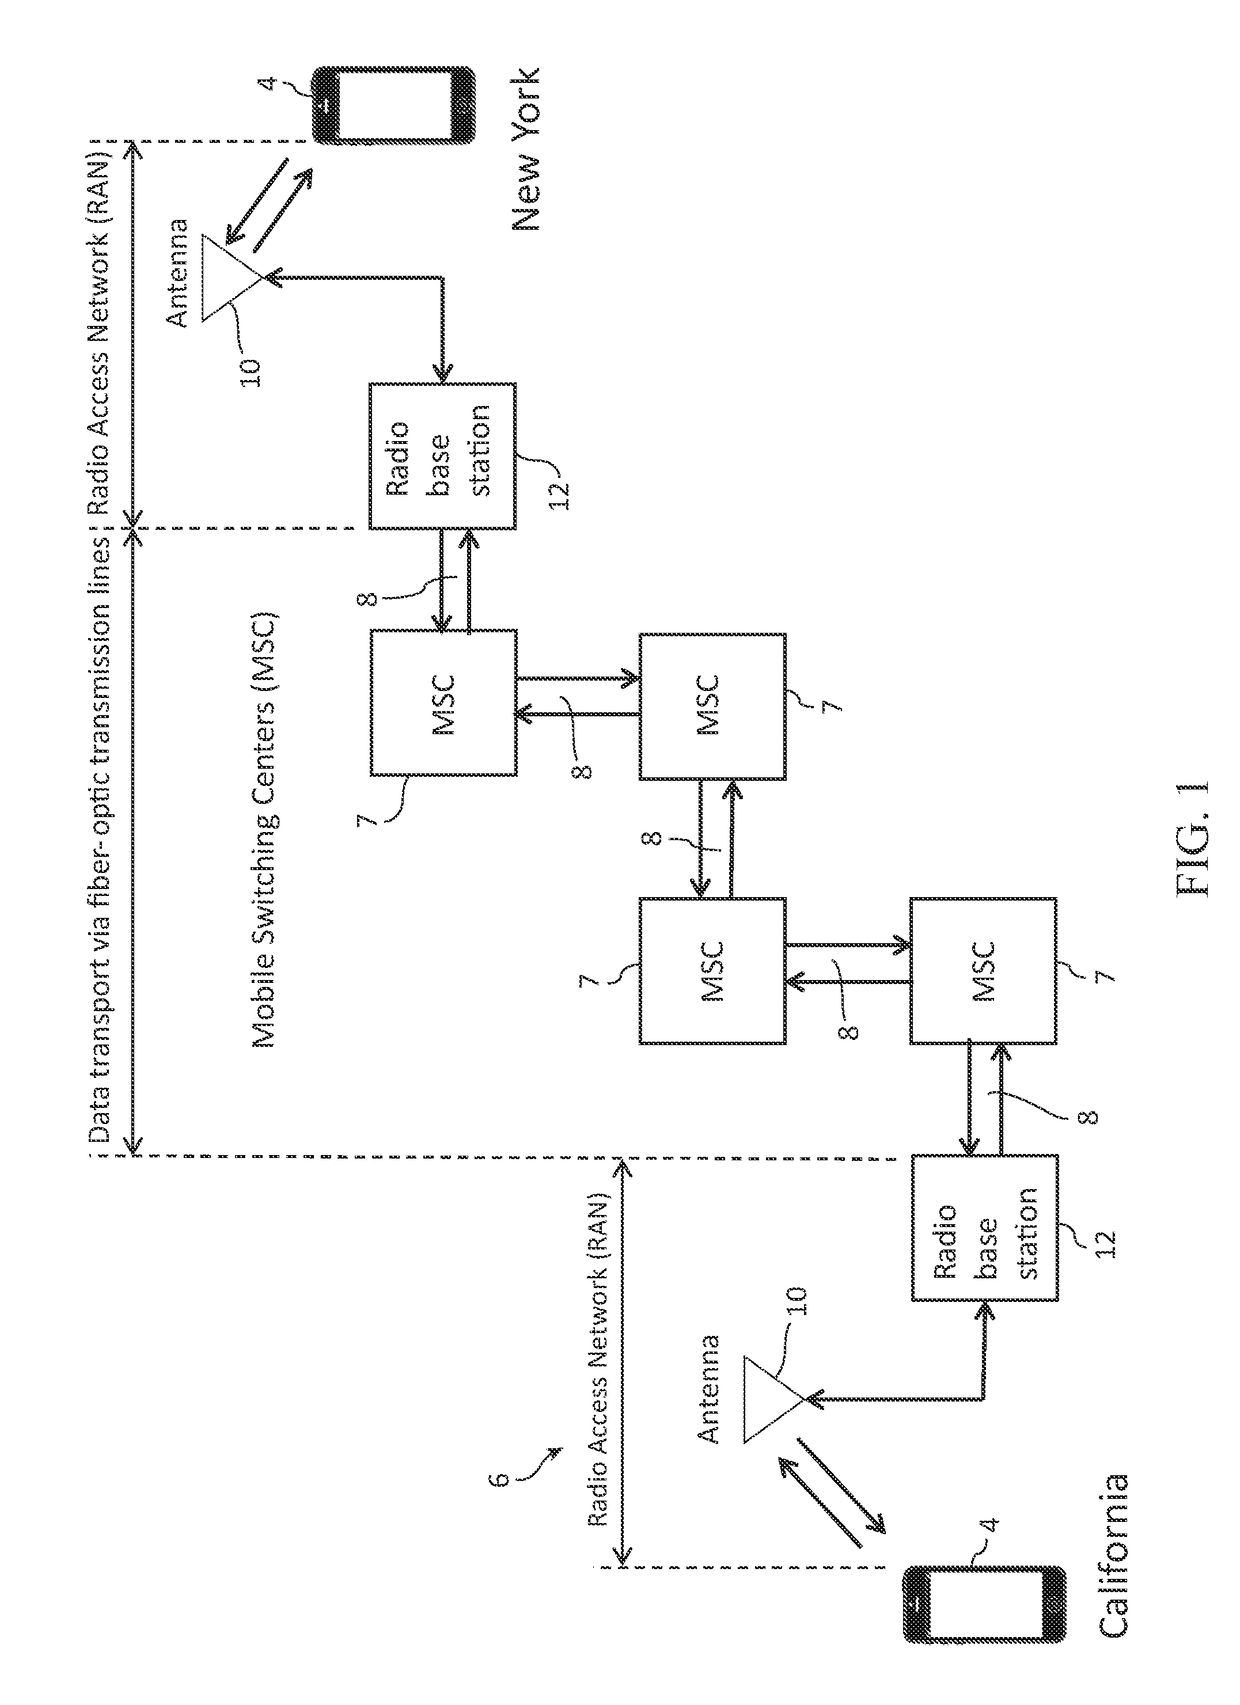
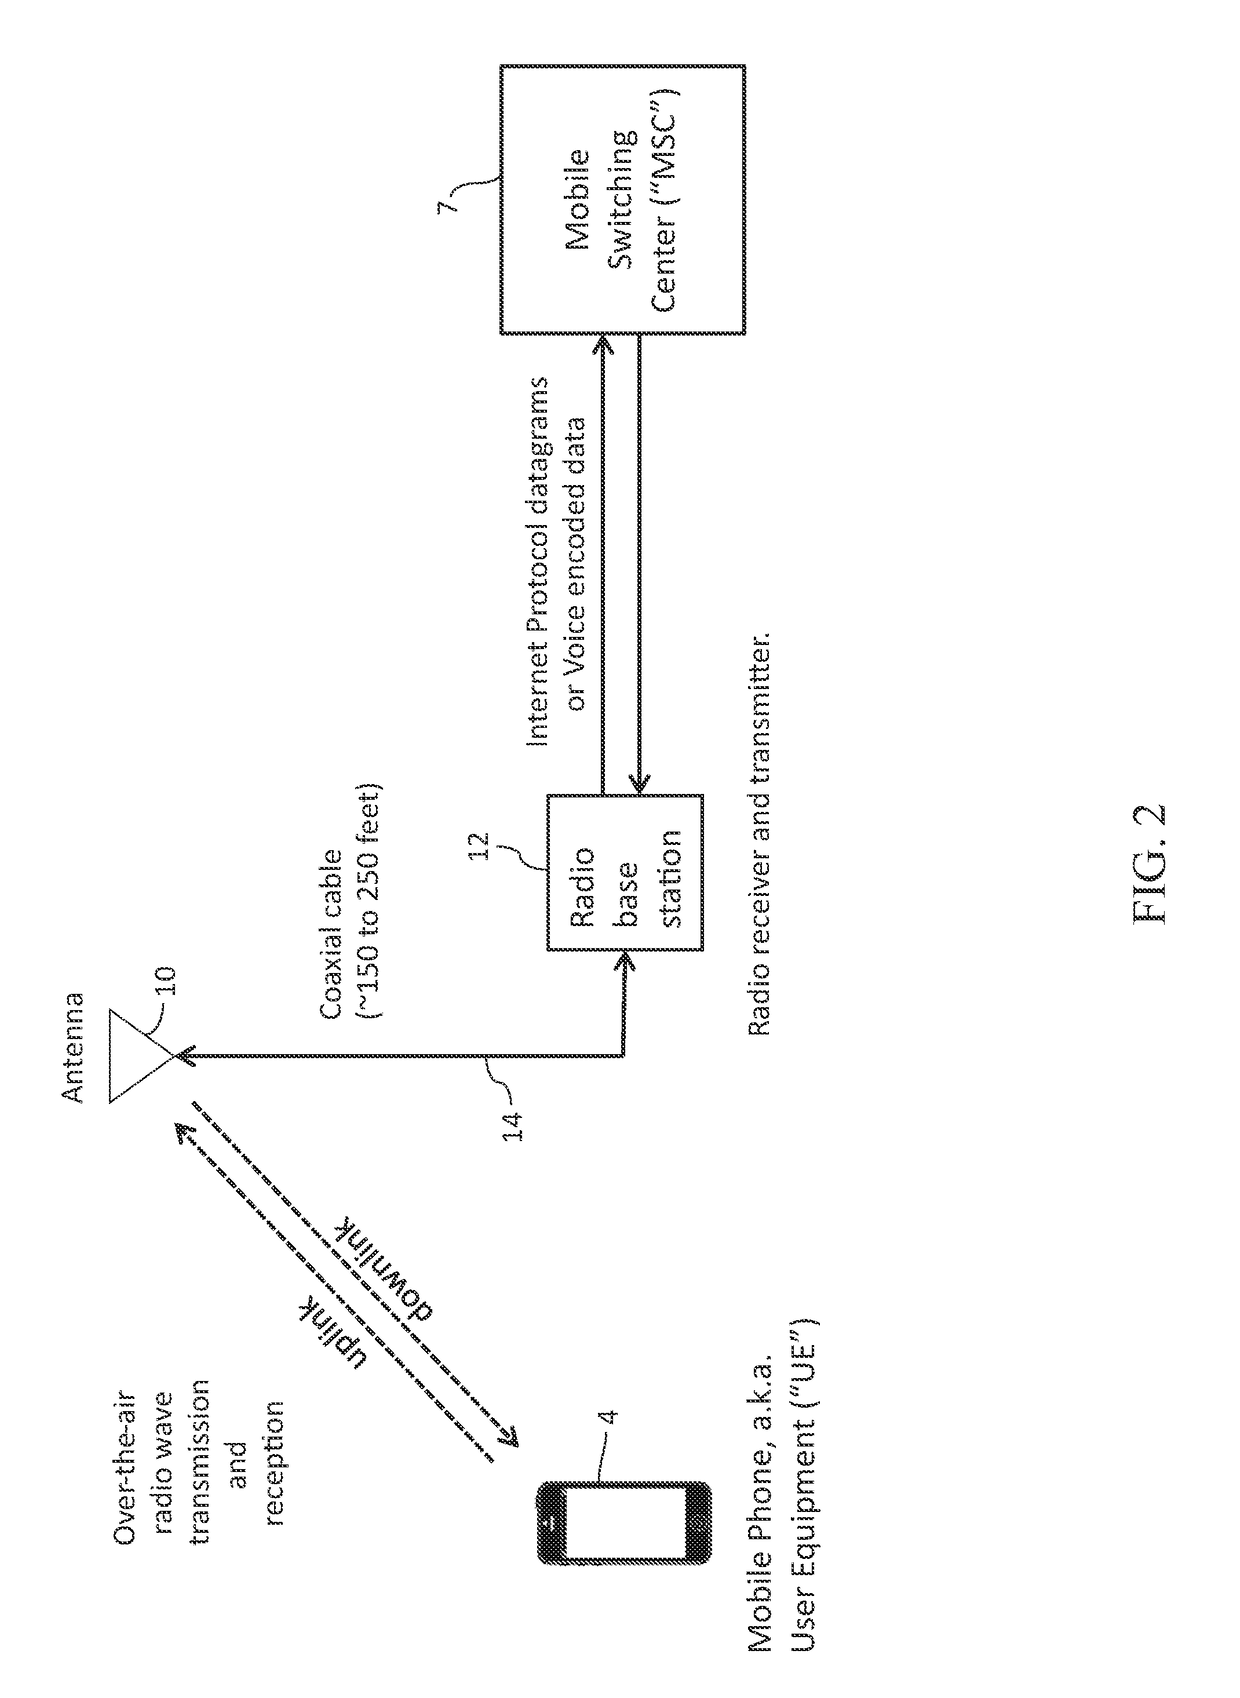
CROSS REFERENCE TO RELATED APPLICATION[0001]This application is related to U.S. Provisional Application Ser. No. 62 / 279,958, filed on Jan. 18, 2016, entitled “Method and Apparatus for the Detection of Distortion or Corruption of Communication Signals based on I / Q Signals”, the disclosure of which is incorporated herein by reference and on which priority is hereby claimed.BACKGROUND OF THE INVENTION[0002]Field of the Invention[0003]The present invention relates to wireless telecommunications networks, and more specifically relates to systems, equipment, components, software and methods for troubleshooting signals in cellular communications networks.[0004]Description of the Prior ArtA) Overview of Wireless Telecommunications Networks[0005]FIG. 1 shows an overview of a typical wireless telecommunications network 2. To facilitate an understanding of the invention, the steps in carrying on a conversation between New York and California on a wireless cellular network 2 will now be explain...

Claims


Application Information

Patent Timeline
Patent Type & Authority Patents(United States)
IPC IPC(8): H04B10/00H04L12/24H04Q11/00H04L12/26H04B17/336H04W24/08H04B10/079
CPCH04B10/07953H04B17/336H04L41/069H04L43/045H04Q11/0066H04W24/08H04L41/0645H04Q2011/0083H04B1/10H04B1/1027H04B1/525H04B17/0085
Inventor HEATH, JEFFREY ABRAMSONHAKANSON, ERIC WALTERYAVID, DMITRIYCOSENTINO, CHRISTOPHER SILVIOCARD, STUART WILLIAM
Owner VIAVI SOLUTIONS INC
Why Eureka
Try Eureka