Method for improving quality of energy spectrum face distribution image of inorganic non-metal material sample
An inorganic non-metal, image quality technology, applied in the field of material analysis, can solve the problems of time-consuming, expensive testing, and difficult, and achieve the effects of avoiding image drift, convenient sample disassembly, and firm sample installation.
- Summary
- Abstract
- Description
- Claims
- Application Information
AI Technical Summary
Problems solved by technology
Method used
Image

Examples
Embodiment 1
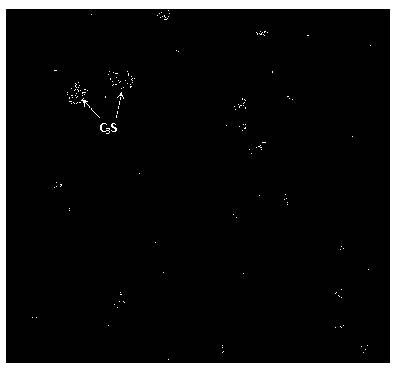
[0029] Embodiment 1, observe the phase composition and the distribution of a kind of cement clinker-gypsum mixture with energy spectrum surface distribution map, carry out image collection according to the following steps:
[0030] (1) Sample installation: put the cement clinker-gypsum-epoxy resin sample that has been ground, polished, and evaporated carbon conductive layer into a non-magnetic stainless steel bracket, with the observation surface facing up, and the installation is firm, and then, through the bracket Bolts at the bottom fix the sample and the bracket as a whole on the observation platform of the scanning electron microscope;
[0031] (2) Paste conductive glue: use 3 conductive glue to connect the observation surface of the sample and the side wall of the bracket;
[0032] (3) Acquisition of energy spectrum surface distribution image: the energy spectrum surface distribution image of Ca element is collected by silicon drift electric cooling X-ray energy spectrum...
Embodiment 2
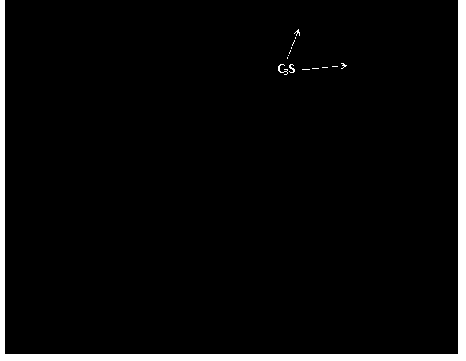
[0033] Example 2, observe the phase composition and distribution of a type I Portland cement with an energy spectrum distribution map, and perform image acquisition according to the following steps:
[0034] (1) Sample installation: Put the Portland cement-epoxy resin sample that has been ground, polished, and evaporated carbon conductive layer into a non-magnetic stainless steel bracket, with the observation side facing up, and the installation is firm, and then, through the bottom of the bracket The bolts fix the sample and the bracket as a whole on the observation platform of the scanning electron microscope;
[0035] (2) Paste conductive glue: use 3 conductive glue to connect the observation surface of the sample and the side wall of the bracket;
[0036] (3) Acquisition of energy spectrum surface distribution image: use silicon drift electric cooling X-ray energy spectrum detector to simultaneously collect energy spectrum surface distribution images of Ca and Si elements....
Embodiment 3
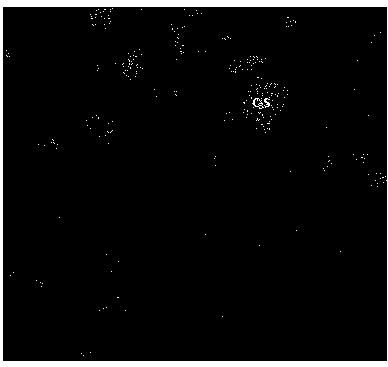
[0037] Embodiment 3, observe the phase composition and the distribution of a kind of fly ash with energy spectrum surface distribution map, carry out image acquisition according to the following steps:
[0038] (1) Sample installation: put the fly ash-epoxy resin sample that has been ground, polished, and evaporated a carbon conductive layer into a non-magnetic stainless steel bracket, with the observation side facing up, and the installation is firm, and then, through the bottom of the bracket The bolts fix the sample and the bracket as a whole on the observation platform of the scanning electron microscope;
[0039] (2) Paste conductive glue: use 4 conductive glue to connect the observation surface of the sample and the side wall of the bracket;
[0040] (3) Acquisition of energy spectrum surface distribution image: use silicon drift electric cooling X-ray energy spectrum detector to simultaneously collect energy spectrum surface distribution images of Al and Si elements. T...
PUM
 Abstract
Description
Claims
Application Information
 - R&D
- Intellectual Property
- Life Sciences
- Materials
- Tech Scout
- Unparalleled Data Quality
- Higher Quality Content
- 60% Fewer Hallucinations
Browse by: Latest US Patents, China's latest patents, Technical Efficacy Thesaurus, Application Domain, Technology Topic, Popular Technical Reports.
© 2025 PatSnap. All rights reserved.Legal|Privacy policy|Modern Slavery Act Transparency Statement|Sitemap|About US| Contact US: help@patsnap.com