Programmable information visualization interaction type design method

A design method and interactive technology, applied in the field of information visualization, can solve the problems of reducing the cost of use, less visual styles, and increasing the ease of use of the system, so as to expand the design space, enhance the expression ability, and reduce the cost of learning and operation. Effect

Inactive Publication Date: 2015-12-16
ZHEJIANG UNIV
View PDF5 Cites 8 Cited by
  • Summary
  • Abstract
  • Description
  • Claims
  • Application Information

AI Technical Summary

Problems solved by technology

In order to meet this demand, two different forms of visual design frameworks have developed rapidly: one is information visualization programming frameworks, such as D3 and Processing, which greatly extend the design restrictions on users, and can be programmed with great freedom. Highly achieve various visualization styles, but their high requirements for programming ability have raised the learning threshold for ordinary users; the other is an interactive information visualization design integrated development environment (IDE), such as Lyra and iVisdesigner, etc. Users are not required to have any programming foundation, and some visual charts can be created only through some simple interactions, such as dragging and clicking, which greatly increases the ease of use of the system and reduces the user's cost of use. Class tools provide fewer visual styles, which limits the user's design space
In the field of information visualization, there is no design method or tool that combines the advantages of these two types of tools.

Method used


Image

  • Programmable information visualization interaction type design method
  • Programmable information visualization interaction type design method

Examples


Embodiment Construction

[0016] The programmable information visualization interactive design method proposed by the present invention is further described below:

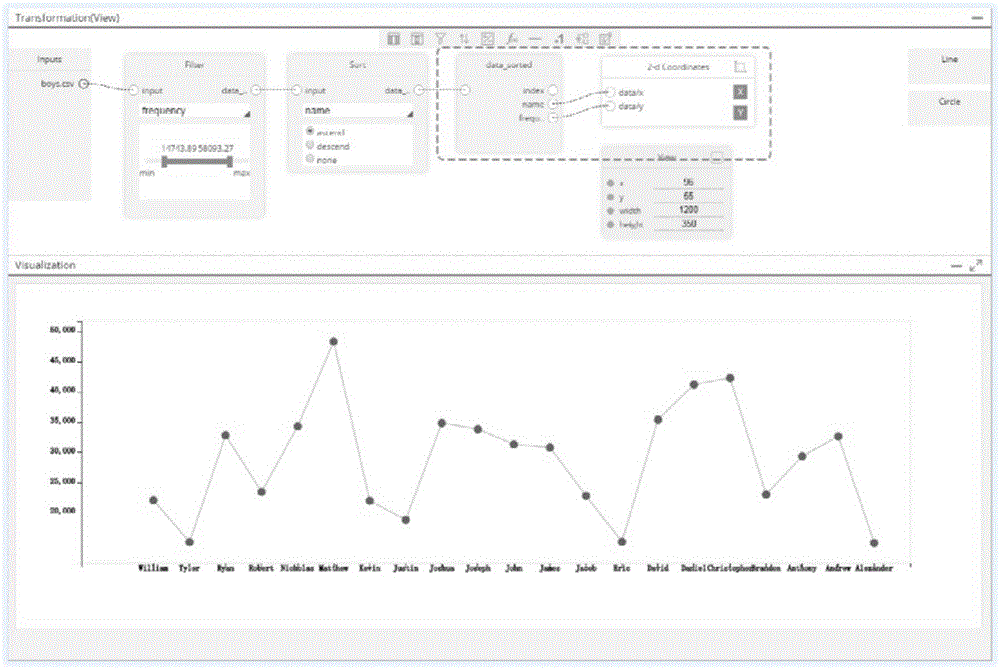
[0017] Step 1) Standardize the information visualization design process and divide it into four stages: data reading, data transformation, visual mapping, and view drawing. Each information visualization design process must include these four stages. Each stage is independent of each other, and the output of the previous stage is used as the input of the next stage. in:

[0018] a) Data reading: This method only supports tabular data files (such as CSV format data) or relational data, and its main function is to parse such data files into tabular data objects. The input to this stage is a data file and the output is a tabular data object.

[0019] b) Data transformation: perform a transformation operation on the above-mentioned table data object and then output new table data, and the transformation operation is one or more of filtering,...


PUM


Abstract

The invention discloses a programmable information visualization interaction type design method. The method comprises: standardizing an information visualization design process and dividing the process into a data reading stage, a data conversion stage, a visual mapping stage and a view drawing stage; providing an interactive graphic interface and a pre-defined data conversion and visual mapping component, so that the information visualization design process can be finished completely based on interaction and cumbersome code writing work is avoided; and in addition, providing a programmable interface for embedding a javascript code by the data conversion and visual mapping component, thereby freely modifying or adding a component function, expanding design space, and enhancing expression capability.

Description

technical field [0001] The invention relates to an interactive design method for programmable information visualization, which belongs to the field of information visualization. Background technique [0002] In today's era of data-driven and information explosion, information visualization is a very important technology. How to provide an information visualization design system (tool) so that both the general public and professional visualization designers can use it to freely create the visualization views they want has become a concern of many users. In order to meet this demand, two different forms of visual design frameworks have developed rapidly: one is information visualization programming frameworks, such as D3 and Processing, which greatly extend the design restrictions on users, and can be programmed with great freedom. Highly achieve various visualization styles, but their high requirements for programming ability have raised the learning threshold for ordinary u...

Claims


Application Information

Patent Timeline
IPC IPC(8): G06F9/44
Inventor陈为胡万祺梅鸿辉马昱欣关会华
OwnerZHEJIANG UNIV