

Image-analysis-based cancer cell DNA content detection method
A tumor cell and detection method technology, which is applied in the field of tumor cell DNA content detection based on image analysis, can solve the problems of cumbersome detection, inability to timely diagnose tumor cells of patients, and long detection time, and achieve fast measurement, convenient and quick diagnosis, and low cost. low effect
- Summary
- Abstract
- Description
- Claims
- Application Information
AI Technical Summary
Problems solved by technology
Method used
Image

Examples
Embodiment Construction
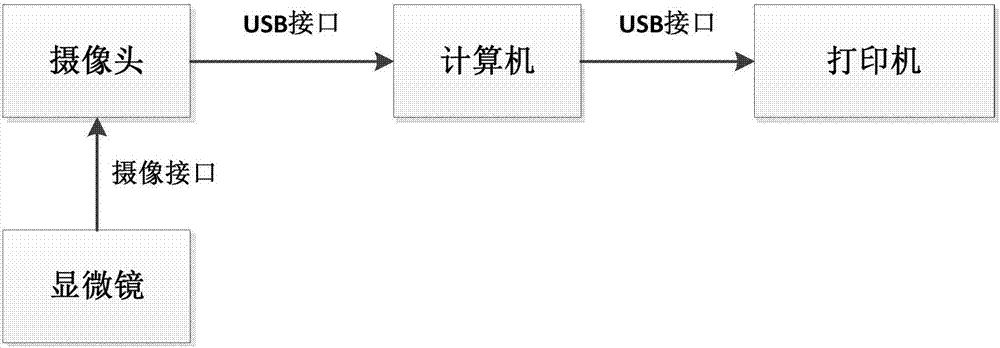
[0037] see figure 1 .
[0038] The hardware device of the present invention is mainly composed of a microscope, a camera, a desktop computer and a printer. The microscope adopts a transmission biological microscope, the camera adopts a high-definition digital camera, the computer adopts a desktop computer, and the printer adopts a color laser printer. The camera is installed on the upper part of the microscope, connected to the microscope through the microscope camera interface, and can collect images of the field of view observed under the microscope; the camera is connected to the USB port of the computer through the data connection line, and the pathological slice images observed by the camera are transmitted to the computer; The printer is connected to the computer through the USB port, and the DNA test report generated by the analysis software is printed out on the printer.
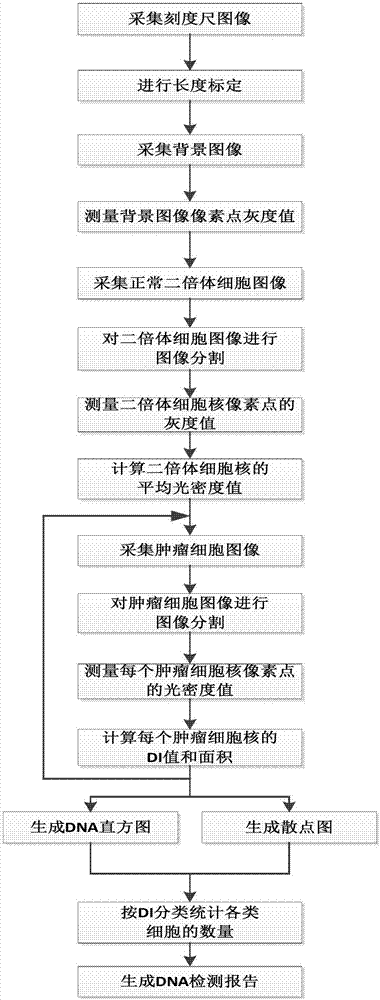
[0039] See attached Figure 2-4 .
[0040] The detection method of DNA content in tumor cells...
PUM
 Abstract
Description
Claims
Application Information