Method for determining quality stability of cigarette paper
A technology of quality stability and cigarette paper, applied in the field of tobacco analysis, can solve the problems of cigarette paper quality stability that have not been reported, and achieve the effects of low cost, accurate experimental results, and small sample volume
- Summary
- Abstract
- Description
- Claims
- Application Information
AI Technical Summary
Problems solved by technology
Method used
Image
Examples
Embodiment 1
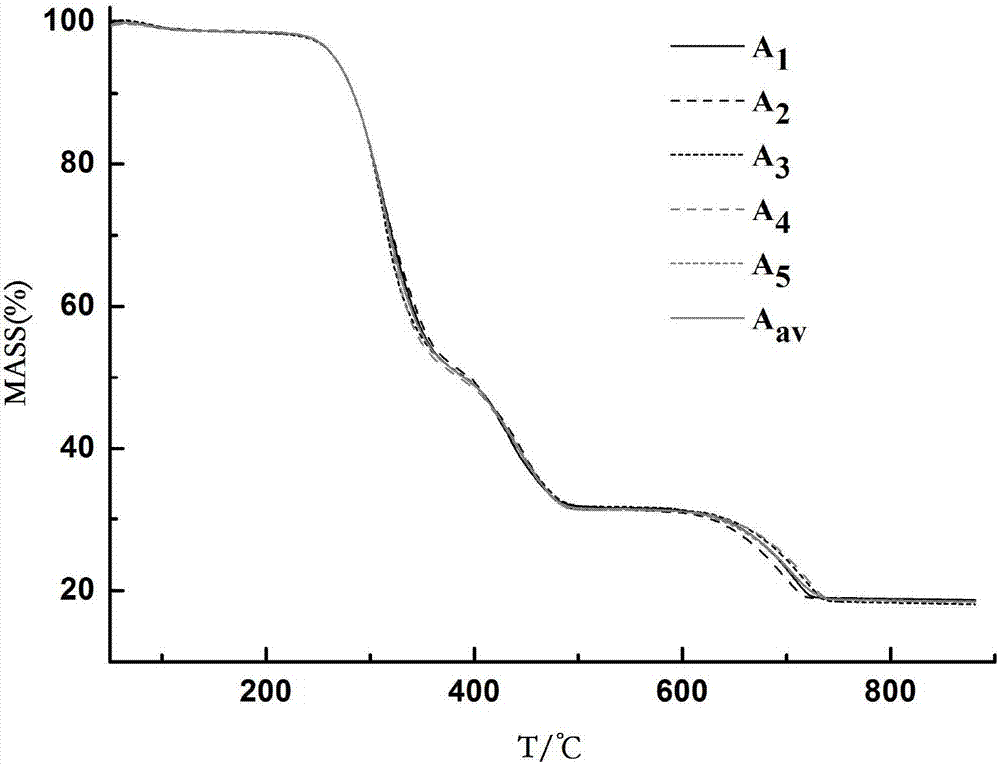
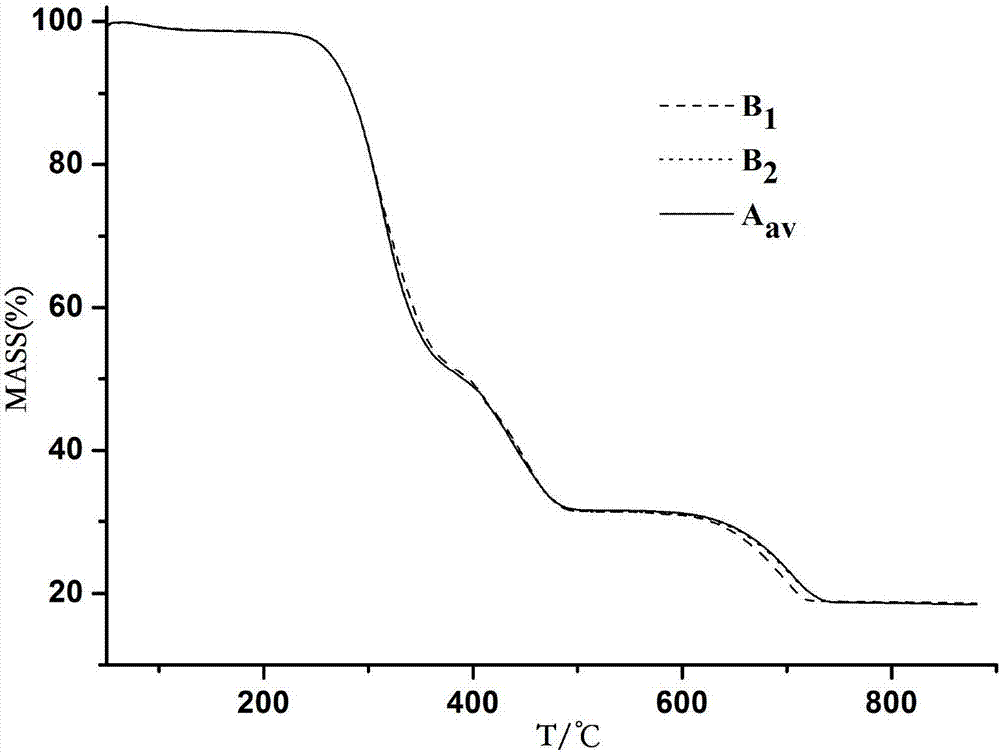
[0034] Embodiment 1, this embodiment takes the first batch of cigarette paper samples (batch A cigarette paper) of a certain brand and specification as a reference, and compares the second batch of cigarette paper samples (batch B cigarette paper) of the same brand and same specification. ) quality stability. The specific operation includes the following steps:
[0035] Step 1. Preprocessing
[0036] Cut the cigarette paper into 1mm 2 sized fragments, and then baked in an oven at 50°C for 48 hours, and then placed in a desiccator for later use;
[0037] Step 2, thermogravimetric analysis
[0038] Place the empty crucible on the test balance of the thermogravimetric analyzer, and when the temperature in the furnace reaches the initial temperature of the thermogravimetric program at 50°C, clear the mass number of the balance; weigh 10 ± 1 mg of pretreated cigarette paper and place it in the crucible. When the temperature in the furnace stabilizes and reaches the initial temp...
Embodiment 2
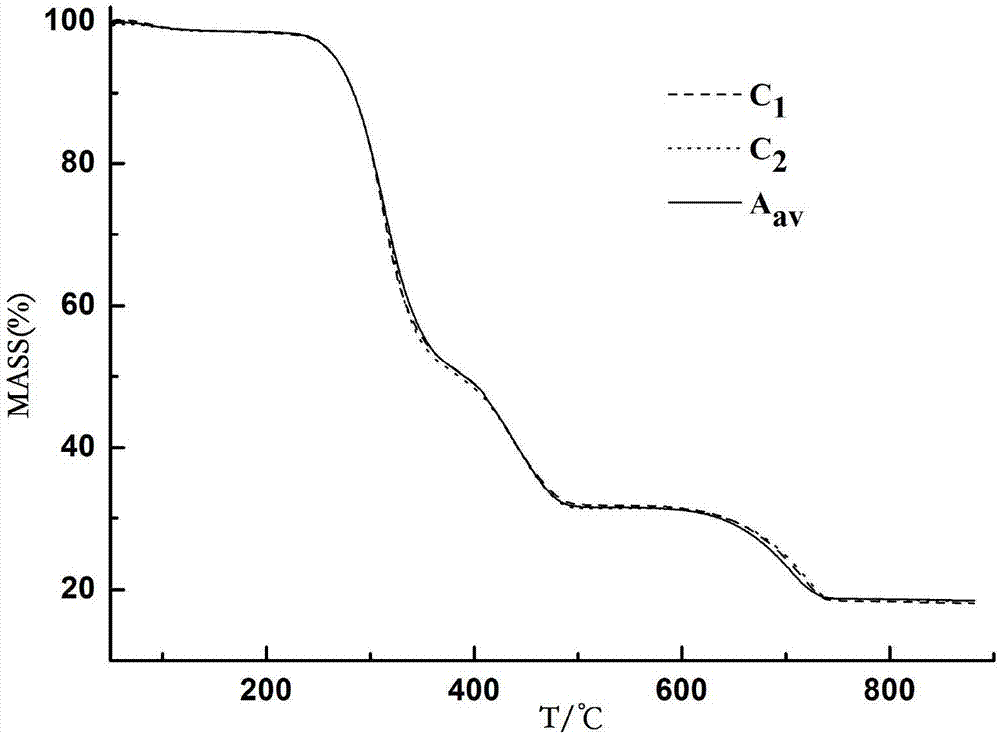
[0058] This embodiment takes the first batch of cigarette paper samples (batch A cigarette paper) samples in Example 1 as a reference, and compares the quality stability of the third batch of cigarette paper samples (batch C cigarette paper) of the same brand and same specification sex.
[0059] image 3 The two TG curves of Batch C cigarette paper and A av atlas.
[0060] After calculation, the two TG curves of the third batch of cigarette paper samples are relative to A av The discrete values of are 2.33×10 -3 , 4.05×10 -3 , all fall within the discrete interval of the thermogravity curve of the batch A cigarette paper, therefore, it is judged that the quality of the batch C cigarette paper is stable compared with that of the batch A cigarette paper.
Embodiment 3
[0062] Repeat steps 1 and 2 in Example 1 with batch A cigarette paper samples to obtain a new TG curve, denoted as A 6 . in A 1 -A 6 Randomly select 5 curves from the 6 TG curves, repeat step 3 in Example 1, and obtain the discrete intervals of thermal weight loss curves of 6 groups of Batch A cigarette papers, as shown in Table 1. The results of 6 tests show that the average discrete interval is in [0, 6.08×10 -3 ], the relative deviations are all within ± 3.20%, and the coefficient of variation of each group of data is 2.06%, illustrating that the repeatability and precision of the test method of the present invention are better.
[0063] Table 1 The results of the repeatability and precision test of the method (n=6, batch A)
[0064]
PUM
 Abstract
Description
Claims
Application Information
 - R&D
- Intellectual Property
- Life Sciences
- Materials
- Tech Scout
- Unparalleled Data Quality
- Higher Quality Content
- 60% Fewer Hallucinations
Browse by: Latest US Patents, China's latest patents, Technical Efficacy Thesaurus, Application Domain, Technology Topic, Popular Technical Reports.
© 2025 PatSnap. All rights reserved.Legal|Privacy policy|Modern Slavery Act Transparency Statement|Sitemap|About US| Contact US: help@patsnap.com


