

A UV-Vis Absorption Spectroscopy Method for Rapidly Detecting Composition of Bromination Reaction Products of Organic Semiconductors
A technology of organic semiconductor and bromination reaction, applied in the direction of material analysis, material analysis, color/spectral characteristic measurement by optical means, to achieve the effect of improving production efficiency, saving cost and low cost
- Summary
- Abstract
- Description
- Claims
- Application Information
AI Technical Summary
Problems solved by technology
Method used
Image

Examples
Embodiment 1
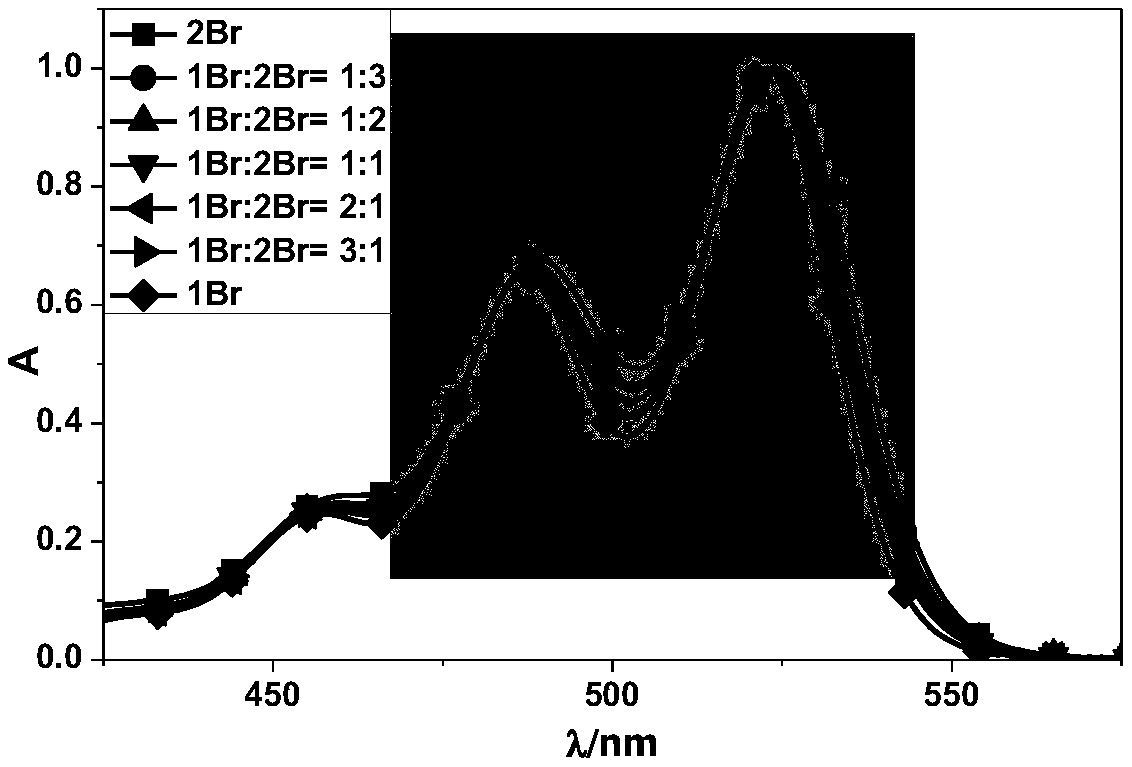
[0032] Embodiment 1: the ultraviolet-visible absorption spectrum test of monobromo, dibromo perylene imide mixed solution
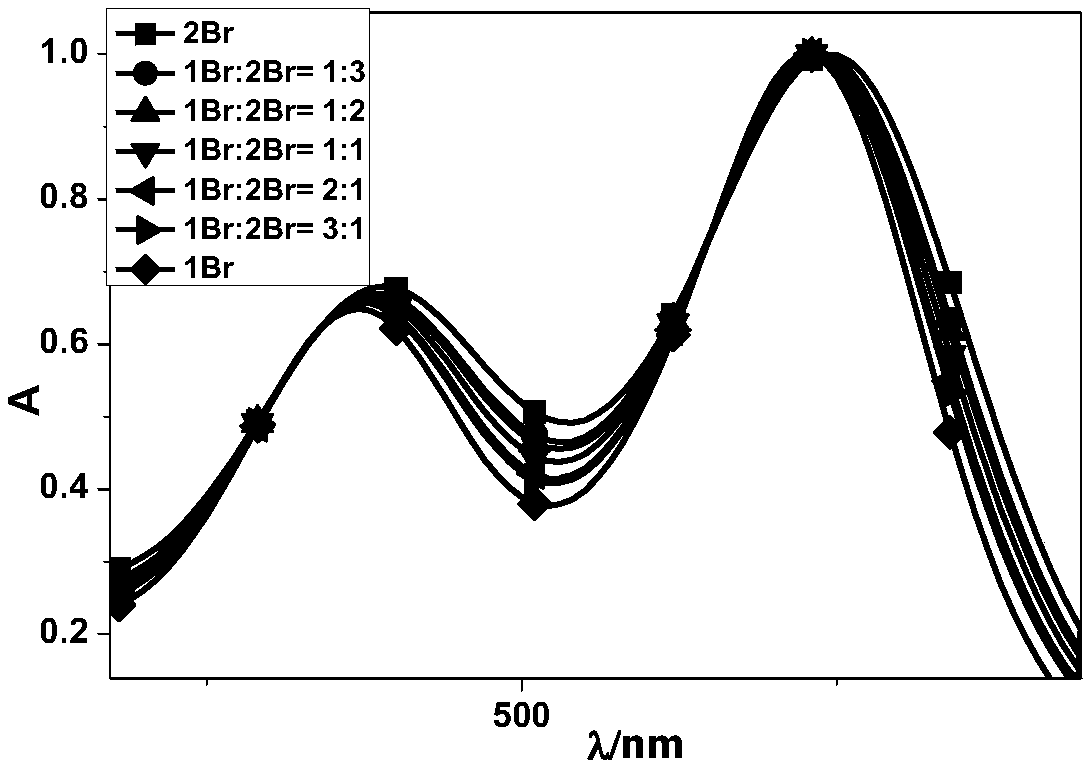
[0033] First, weigh 0.00469g of pure monobromoperyleneimide and 0.00548g of dibromoperyleneimide into two Erlenmeyer flasks, and dissolve them in 100ml of dichloromethane. Take 10ml in two other Erlenmeyer flasks, dilute to 100ml with dichloromethane, respectively to obtain a concentration of 10 -5 mol / L solution of monobromo and dibromoperylene imide. Then pure monobromo and dibromoperyleneimides were mixed in ratios of 1:0, 3:1, 2:1, 1:1, 1:2, 1:3, 0:1 and the mixtures were tested separately UV-Vis absorption spectrum of the solution. The UV-visible absorption spectrum (normalized curve) of monobromo and dibromo perylene imide mixed in different proportions is as follows: figure 1 as shown, figure 2 for figure 1 The map of the middle shaded part after partial zoom-in.
[0034] In order to eliminate the influence of the trace PDI remaining in the ...
Embodiment 2
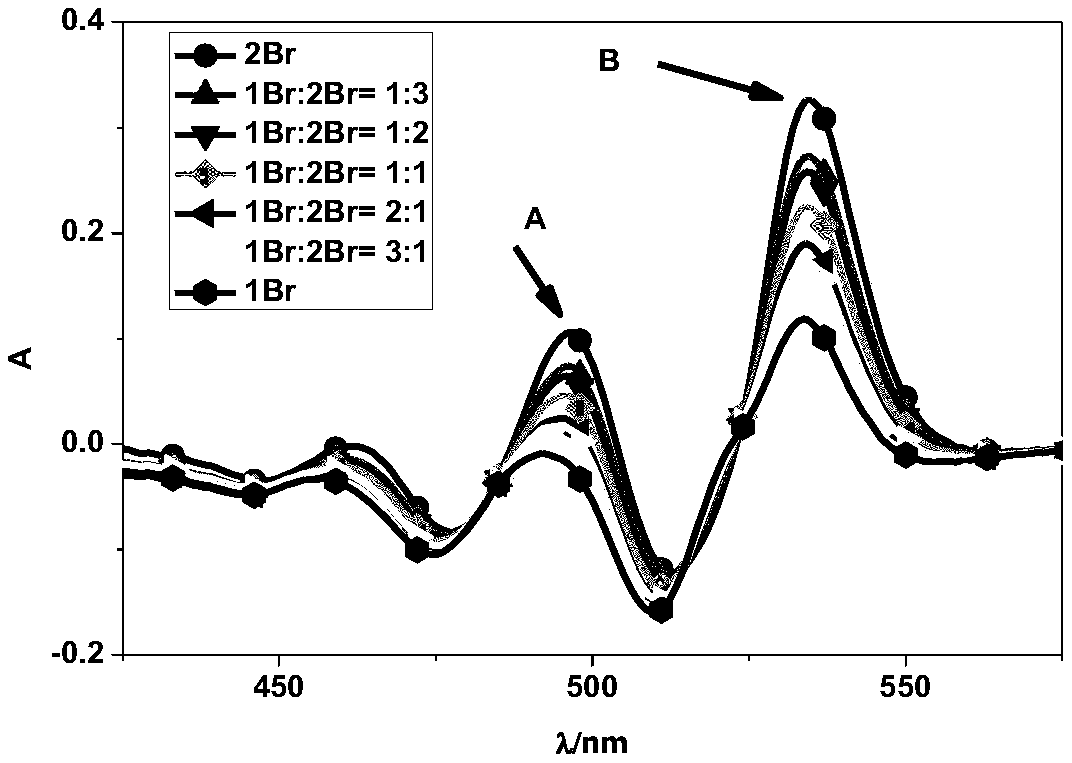
[0035] Example 2: The method for summarizing the relationship between the integral area, peak width, peak height, and the peak height obtained after subtracting the characteristic peak of the absorption curve of the mixed solution from the absorption curve of the raw material and its composition ratio
[0036] By comparison figure 2 , image 3 The relationship between the curve and the composition ratio, the relationship between the five curve data and the composition ratio is obtained:
[0037] (1) Integral area relational expression
[0038] in the above figure 2 In this paper, the differences in the integrated areas of the absorption peaks at 475nm to 550nm in the ultraviolet-visible absorption spectrum of each mixed solution were compared, and the relationship between the size of the integrated area and the solution ratio was summarized.
[0039] Such as Figure 4 As shown, take the lowest point between 450nm and 475nm, such as point A in the figure, shift to the rig...
Embodiment 3
[0068] Example 3: Verify the relational formula and screen the optimal calculation formula
[0069] In this embodiment, two PDI bromination reactions are first carried out, and the reaction temperature is controlled so that only monobromo and dibromoPDI are generated in the reaction. The difference is: once the raw material PDI is completely reacted, and the other time is that the raw material PDI is not completely reacted; Then test the ultraviolet-visible absorption spectrum of the reaction stock solution respectively, and bring the data after the curve normalization into the above five relational expressions, and calculate the corresponding monobromo and dibromo PDI composition ratios; The pure monobrominated and dibrominated PDI solids of the subbrominated reaction are weighed to calculate the molar ratio between them; finally, compared with the results calculated by the five relational formulas, the optimal calculation is selected formula, and finally obtain the ultraviol...
PUM
 Abstract
Description
Claims
Application Information