Method for detecting content of nitrate radicals in high-level liquid waste
A measurement method and high-level waste liquid technology, applied in the field of analytical chemistry, can solve problems such as increasing operational complexity, and achieve the effect of fast measurement speed and high selectivity
- Summary
- Abstract
- Description
- Claims
- Application Information
AI Technical Summary
Problems solved by technology
Method used
Image
Examples
Embodiment 1
[0024] Embodiment 1: the Raman spectrum measurement of different concentration nitric acid and sodium nitrate solution
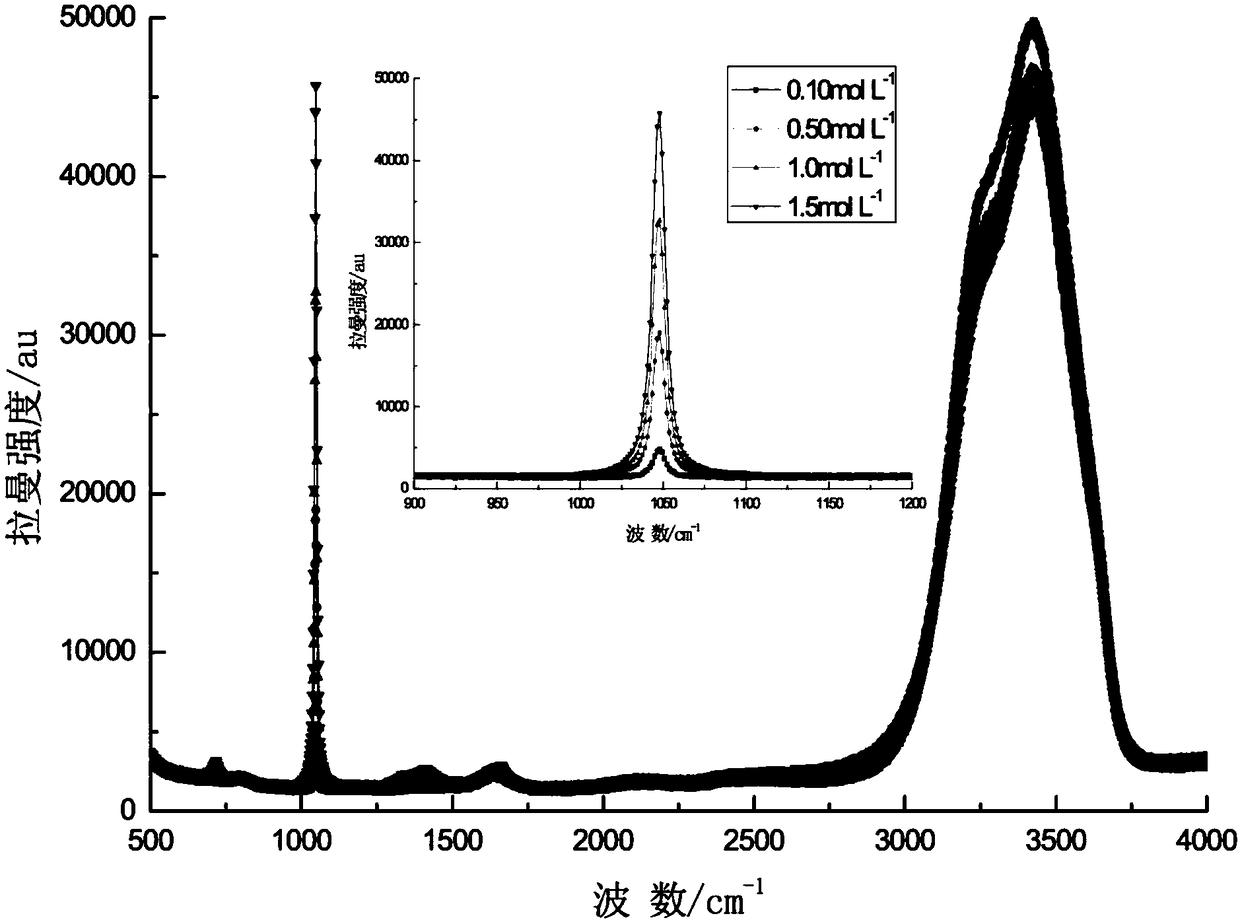
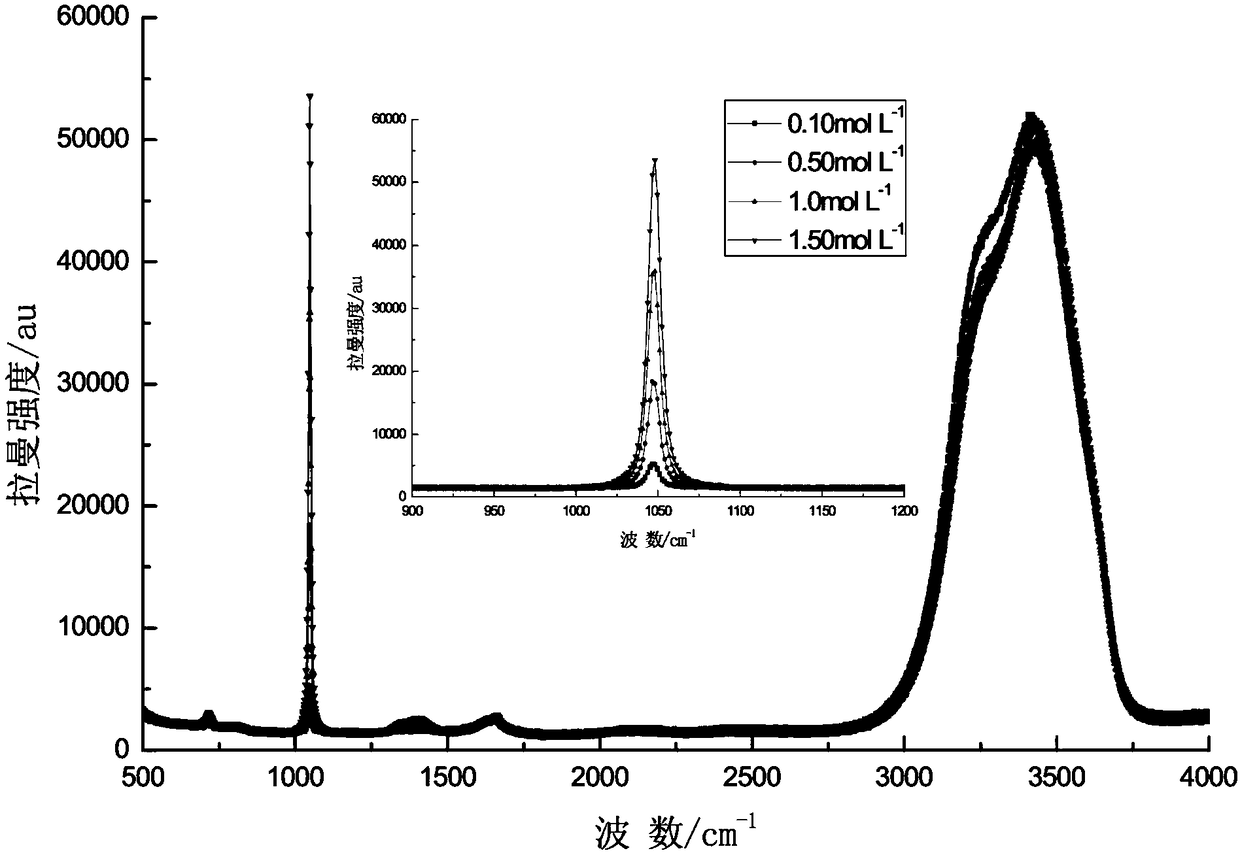
[0025] Nitrate and nitric acid solutions are the main components of high-level radioactive waste, so a series of different concentrations of nitric acid solutions and sodium nitrate solutions were prepared as standard solutions, and the Raman spectra were measured respectively. The results are as follows figure 1 and figure 2 shown.
[0026] From figure 1 and figure 2 It can be seen that the nitrate is at 1047cm -1 has a characteristic signal; but with figure 2 compared to, figure 1 Medium H + When the concentration increases from 0.10mol / L to 1.50mol / L, the peak shape of water changes, and the change of its intensity is determined by H + The peak shape of nitrate is sharp due to the change of concentration, and its intensity increases with the increase of concentration.
[0027] Based on this result, it is necessary to select the best preprocessi...
Embodiment 2
[0028] Embodiment 2: water combination peak area normalization processing and working curve drawing (water combination peak area normalization method)
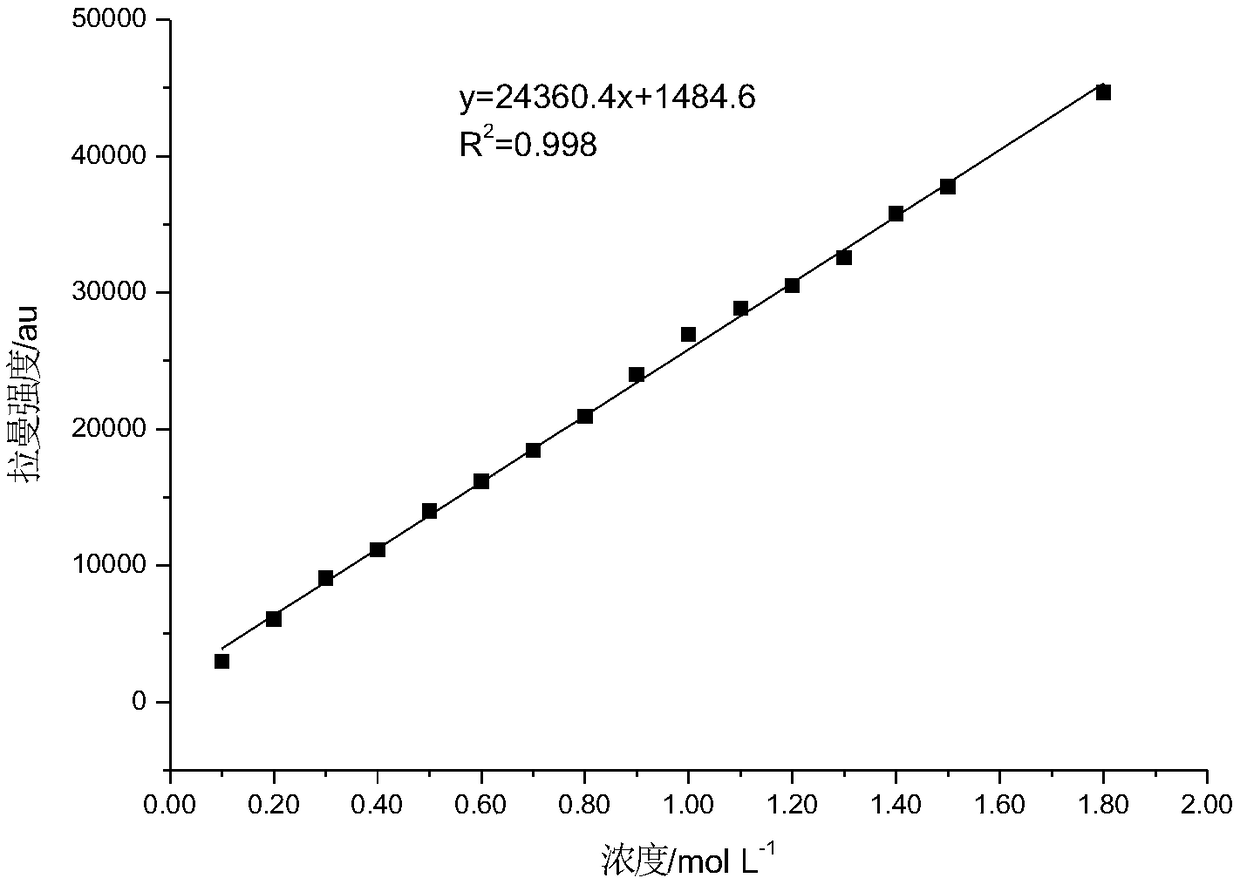
[0029] Use the normalization function in the built-in software of the Renishaw confocal Raman spectrometer-Integratedsignal, with water at 2800-3800cm -1 The combined peak area of the range is the normalization standard, and the Raman spectrum data of different concentrations of nitric acid are processed to obtain the normalized NO 3 - Peak area values, plotted for the NO 3 - The working curve between the peak area value and its concentration is shown in image 3 .
[0030] Depend on image 3 Visible, when the solution H + When the concentration is in the range of 0.10-1.80mol / L, the combined peak area of water can be used as the normalization standard for NO 3 - For quantitative analysis, NO 3 - There is a good linear relationship between the peak area value and its concentration, that is, within this concentrat...
Embodiment 3
[0031] Embodiment 3: the normalization processing of the highest point of the water combination peak and the drawing of the working curve (normalization method of the highest point of the water combination peak)
[0032] After subtracting the baseline from the Raman spectrum of the nitric acid aqueous solution, read the value of the highest point of the combined peak of water, and the NO 3 - The peak height is compared with this value, obtains the peak height ratio, draws the peak height ratio with the nitric acid concentration change relation curve, is shown in Figure 4 . From Figure 4 It can be seen that when the solution H + When the concentration is in the range of 0.10-1.80mol / L, it is feasible to use the highest point of the water combination peak as the internal standard, and the established working curve R 2 = 0.999.
PUM
 Abstract
Description
Claims
Application Information
 - R&D
- Intellectual Property
- Life Sciences
- Materials
- Tech Scout
- Unparalleled Data Quality
- Higher Quality Content
- 60% Fewer Hallucinations
Browse by: Latest US Patents, China's latest patents, Technical Efficacy Thesaurus, Application Domain, Technology Topic, Popular Technical Reports.
© 2025 PatSnap. All rights reserved.Legal|Privacy policy|Modern Slavery Act Transparency Statement|Sitemap|About US| Contact US: help@patsnap.com


