Graphic analysis method, device, equipment and medium for distributed wave recording
An analysis method and graphical technology, applied in the direction of fault location, fault detection according to conductor type, information technology support system, etc., can solve problems that affect the restoration of power supply speed and safe operation of the power grid, and achieve the effect of rapid positioning and resolution
- Summary
- Abstract
- Description
- Claims
- Application Information
AI Technical Summary
Problems solved by technology
Method used
Image

Examples
Embodiment 1
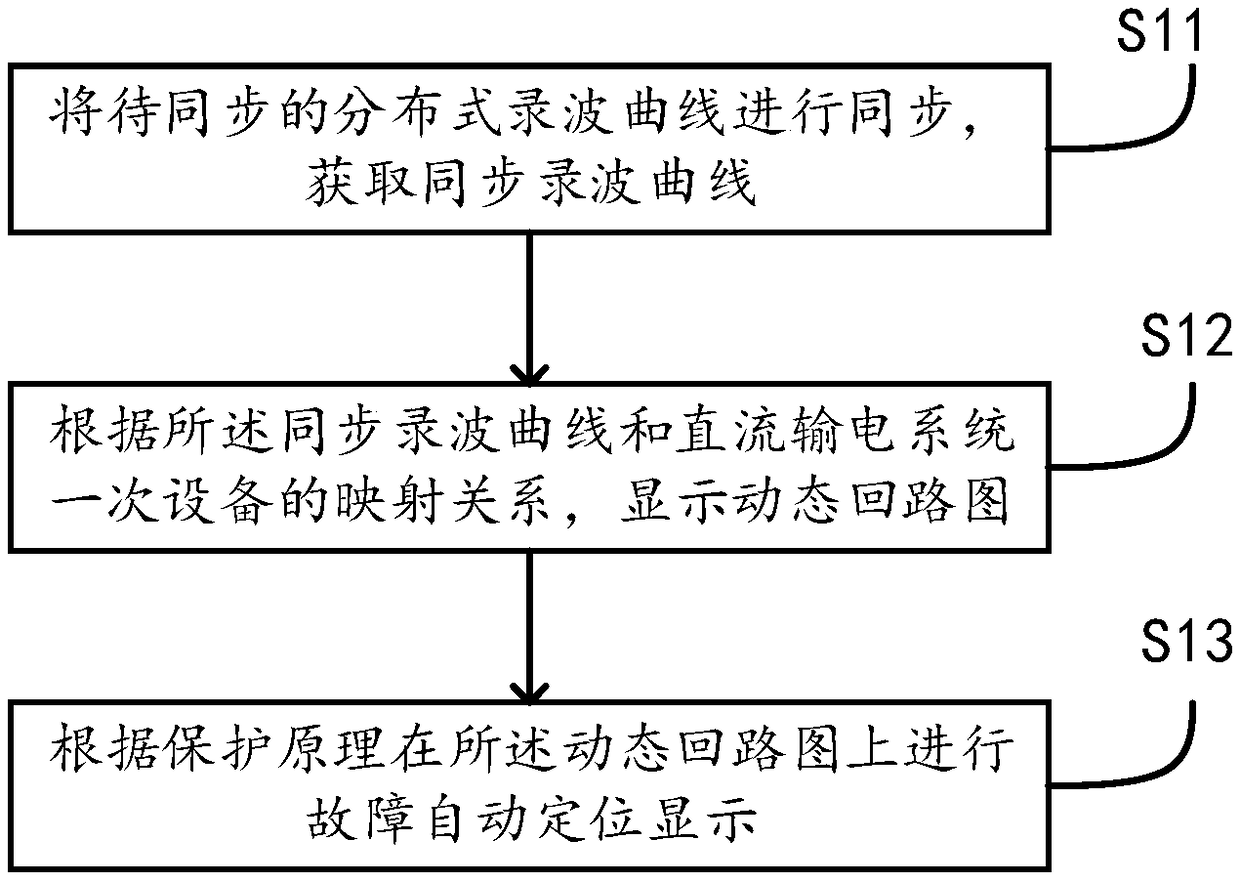
[0059] see figure 1, a schematic flow chart of the distributed wave recording graphical analysis method provided by the first embodiment of the present invention;
[0060] S11. Synchronize the distributed wave recording curves to be synchronized to obtain the synchronous wave recording curves.
[0061] It should be noted that calculations between different physical quantities that are not at the same time are meaningless, so the time scales are not aligned, and the time of the electrical quantities is inconsistent, so formulas cannot be used to calculate and problems cannot be analyzed. Synchronization of wave recording curves is required here.
[0062] In this embodiment, the distributed wave recording includes multiple wave recording files from multiple control and protection devices, each control and protection device has a corresponding wave recording file, and each wave recording curve inside each wave recording file has the same The start and end time and sampling rate ...
Embodiment 2
[0076] Embodiment two, on the basis of embodiment one, refer to Figure 6 It is a schematic flowchart of another distributed wave recording graphical analysis method provided by the second embodiment of the present invention;
[0077] Preferably, according to the mapping relationship between the synchronous wave recording curve and the primary equipment of the direct current transmission system, displaying the dynamic circuit diagram includes:
[0078] S21. Map the synchronous wave recording curve and the primary equipment of the direct current transmission system to obtain a mapped line.
[0079] In this embodiment, the synchronous wave recording curve includes the reference wave recording curve and the wave recording curve to be synchronized, and the primary equipment of the direct current transmission system includes a generator (motor), a transformer, a circuit breaker, an isolating switch , automatic switch, contactor, knife switch, busbar, transmission line, power cable...
Embodiment 3
[0121] Embodiment three, on the basis of embodiment one, refer to Figure 11 It is a schematic flowchart of another distributed wave recording graphical analysis method provided by the third embodiment of the present invention;
[0122] Preferably, the automatic fault location and display on the dynamic circuit diagram according to the protection principle includes:
[0123] S31. Obtain fault points on the dynamic circuit diagram according to protection principles;
[0124] S32. Perform automatic fault location and display on the dynamic circuit diagram according to the fault point.
[0125] Preferably, said obtaining fault points on said dynamic circuit diagram according to protection principles includes:
[0126] When the current value is higher than the preset value, obtain the overcurrent fault point;
[0127] When the total current of the same node or a generalized node is not zero, obtain the regional leakage current fault point;
[0128] When the voltage is higher t...
PUM
 Abstract
Description
Claims
Application Information
 - R&D
- Intellectual Property
- Life Sciences
- Materials
- Tech Scout
- Unparalleled Data Quality
- Higher Quality Content
- 60% Fewer Hallucinations
Browse by: Latest US Patents, China's latest patents, Technical Efficacy Thesaurus, Application Domain, Technology Topic, Popular Technical Reports.
© 2025 PatSnap. All rights reserved.Legal|Privacy policy|Modern Slavery Act Transparency Statement|Sitemap|About US| Contact US: help@patsnap.com